4947
CNR comparison to identify the detectability rate and FA histogram analysis of FLAIR lesions in DTI metrics.1Radiology, Wayne State University, Detroit, MI, United States, 2Center for Neurological Studies, Dearborn, MI, United States, 3Wayne State university, Detroit, MI, United States
Synopsis
There is a paucity of studies trying to investigate the sensitivity of DTI metrics like Fractional Anisotropy (FA), Apparent Diffusion Coefficient (ADC), Axial Diusivity and Radial Diffusivity in areas corresponding to the lesion sites detected in clinical MRI using FLAIR images. Aim of this study was to compare the utility of DTI with FLAIR by evaluating the contrast to noise ratio (CNR) in their detecting capacity of DAI lesions and to evaluate whether DTI is more accurate than FLAIR or vice versa.
Introduction:
Traumatic brain injury (TBI) is a leading cause of death and neurologic disability that affects more than 3.5 million people with consequences lingering more than that of the acute phase. Neuroimaging methods like Fluid-attenuated inversion recovery (FLAIR) and Diffusion Tensor Imaging (DTI) are used extensively in the clinical and research settings to assess WMH, however the relationship between FLAIR detected white matter hyperintensity lesions and DTI detected lesions remains unclear$$$^{1}$$$. Many studies have shown that DTI studies mainly use Fractional Anisotropy (FA)$$$^{2}$$$ and Apparant Diffusion Coefficient (ADC) in evaluating the white matter injury but the major and minor eigen values which contribute in determining the Axial Diffusivity (AD) and Radial Diffusivity (RD)$$$^{3}$$$ that form the basis of calculating FA and ADC are commonly ignored. There is a paucity of studies in evaluating these DTI metrics in these lesion sites and the relationship between FLAIR detected and DTI detected lesions remains unclear. Our goal was to determine which of these DTI metrics have similar Contrast-to-noise ratio (CNR) detected by the Rose criterion$$$^{4}$$$ compared to what is seen in FLAIR. The underlying question is, does DTI have enough sensitivity in detecting the lesions that are easily seen on FLAIR without having any additional processing to enhance the lesion sites and does these two modalities show the same information regarding axonal damage in TBI or is one method superior to the other in some way?Materials and Methods:
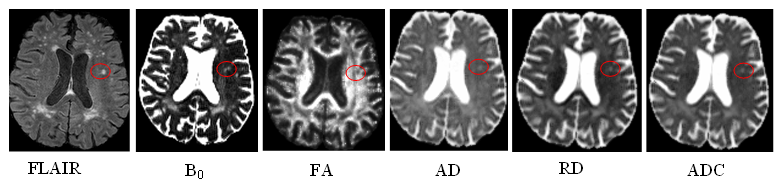
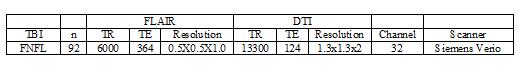
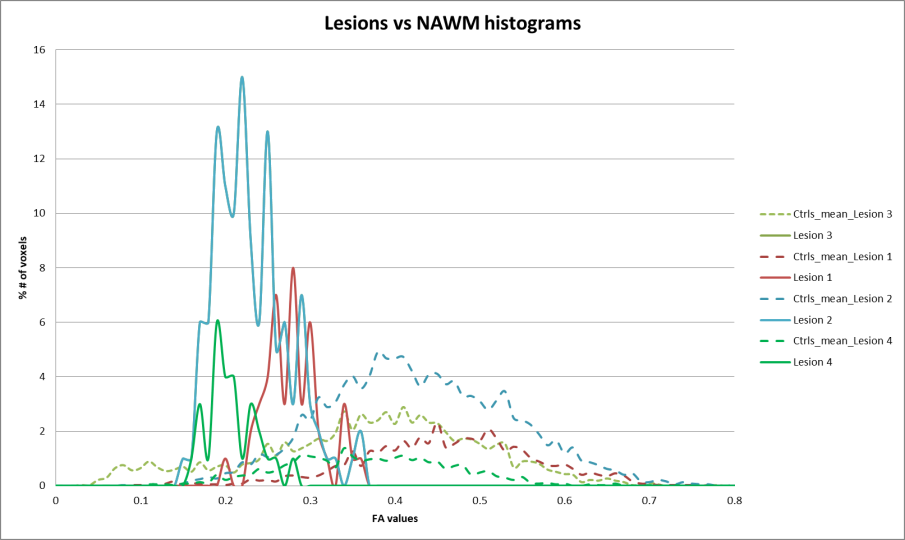
DTI studio was used to create DTI metric maps from diffusion images. Ninety two lesions were manually drawn on FLAIR images (Figure1) and a similar region of equal size was drawn on a normal appearing background tissue in thirty six former NFL subjects enrolled in a trauma study. DTI and FLAIR scan parameters are shown in Table 1. CNR is calculated as $$CNR_{L}=\frac{S_{L}-S_{N}}{\sigma_{N}}\times\sqrt{n}$$ As these lesions cover multiple pixels, a factor of √n needs to be multiplied into the contrast to obtain an effective CNR. Based on the Rose criterion as the detection standard, the detectability of an object is possible when the CNR exceeds 3:1 to 5:1 [3]. Thirty seven healthy controls were used for FA histogram analysis. FA histograms were extracted at the lesion site and in the same corresponding region in the healthy controls. The mean FA histogram of the roi in those thirty seven controls is extracted and plotted against the lesion FA histogram (Figure2).Results:
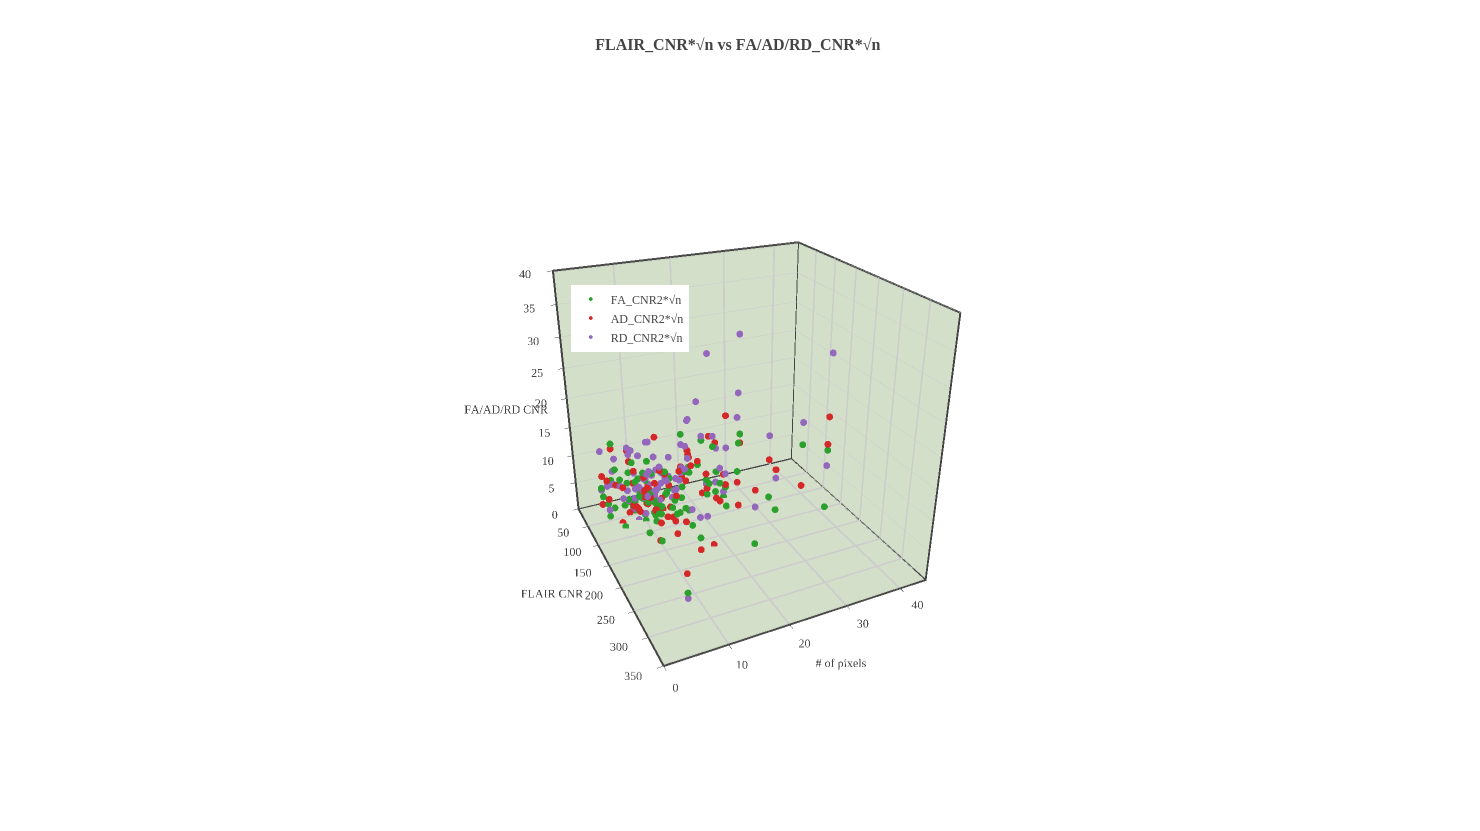
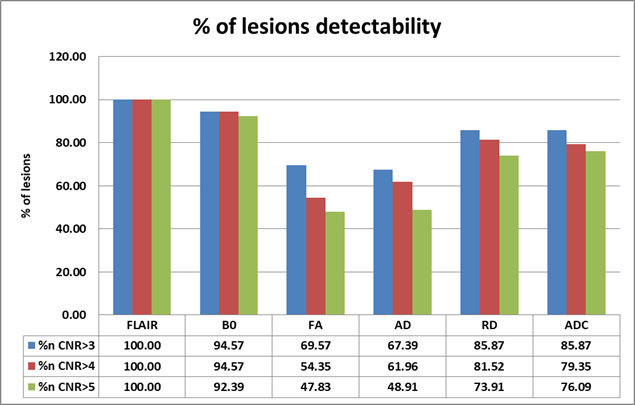
In order to compare the lesion visibilities, the data are plotted for CNR versus size and CNR*sqrt(n), the visibility for FLAIR vs FA/AD/RD (Figure 3). These results indicate that small lesions are seen predominantly because they have high intrinsic CNR (>50 units) while larger lesions have lower intrinsic CNR but much higher visibility (> 300 units). None of the DTI metrics had CNR>70 except the B0 image. Based on the Rose criterion using the visibility criterion as 5:1, it can be seen that the DTI metrics miss many smaller lesions (FA (53%), ADC(24%) and RD (28%)) relative to FLAIR. The detectability rate of small lesions in B0 image (95%) was higher compared to any of the DTI metrics followed by ADC (86%) and RD(85%). Note that the number of pixels seen for the lesions in these two modalities is smaller in the DTI data because the resolution is 13.52 times lower than the FLAIR data. The best correlation was found to be with B0 (0.55), ADC(0.43) and RD(0.39) and less with the FA values (0.29). But the histogram FA analysis have shown a significant shift towards the lower FA and higher narrow peak compared to the controls (Figure 2).Discussion and Conclusion:
Based on the Rose criterion, there is a connection between the CNR value of a lesion and the probability of observing the lesion. Our results suggest that WMHs on FLAIR images have better sensitivity than the DTI metrics and seems to have a stronger association with detectability of the same lesions in the B0, ADC and RD images than AD or FA. In TBI patients traumatic lesions are often present in early clinical MRI and profoundly seen in FLAIR images but might not be easily detectable in any of the DTI component images unless further employing additional processing techniques ( histogram, VBA or tractography). There is enough literature suggesting FA decrease in lesion sites and our study clearly replicates it indicating the severity of injury. Hence the detectability of lesions without any additional techniques can be best visualized using the B0, ADC or RD images and this when combined with enhanced processing of FA images could provide valuable information about the extent of injury diffused beyond the lesion site in TBI research.
Acknowledgements
No acknowledgement found.References
1. Hulkower, M.B., et al., A decade of DTI in traumatic brain injury: 10 years and 100 articles later. AJNR Am J Neuroradiol, 2013. 34(11): p. 2064-74.
2. Basser, P.J. and C. Pierpaoli, Microstructural and physiological features of tissues elucidated by quantitative-diffusion-tensor MRI. J Magn Reson B, 1996. 111(3): p. 209-19.
3. Song, S.K., et al., Dysmyelination revealed through MRI as increased radial (but unchanged axial) diffusion of water. Neuroimage, 2002. 17(3): p. 1429-36.
4. Bao, Q. and A.F. Chatziioannou, Estimation of the minimum detectable activity of preclinical PET imaging systems with an analytical method. Med Phys, 2010. 37(11): p. 6070-83.
Figures