4944
Investigating tissue oxygenation in acute Traumatic Brain Injury using Arterial Spin Labelling and quantitative-BOLD1Wellcome Centre for Integrative Neuroimaging, FMRIB, Nuffield Department of Clinical Neurosciences, University of Oxford, Oxford, United Kingdom, 2Department of Neurosurgery, John Radcliffe Hospital, Oxford University Hospitals NHS Foundation Trust, Oxford, United Kingdom
Synopsis
Following a traumatic brain injury, oxygen metabolism may be disrupted by changes in oxygen supply and demand. This study aims to investigate global changes in oxygen metabolism in the hours immediately following the initial insult to the brain. Pseudo-continuous ASL (PCASL) and streamlined-qBOLD (sqBOLD) are used to measure blood flow and oxygenation in the acute stages of TBI (<24 hours post-injury). When compared with an age matched control group, blood oxygenation appears to increase during injury (decreased OEF (p=0.03)) at this acute time-point.
Introduction
The pathophysiology of oxygen metabolism following traumatic brain injury (TBI) is unclear. In the ensuing period after injury, this important physiological process may become disrupted by changes in oxygen supply and demand1,2. However, the magnitude and direction of these changes are poorly understood and likely to be dependent on many factors, such as injury severity and elapsed time after injury3.
In this study, pseudo-continuous ASL (PCASL) and streamlined-qBOLD (sqBOLD) are used to investigate the characteristics of blood flow and oxygenation in the acute stages of TBI (<24 hours post-injury). PCASL4 is an established approach for non-invasively mapping cerebral blood flow (CBF). sqBOLD5 is a recently developed approach for imaging oxygen metabolism by modelling the transverse MR-signal decay in the presence of a vascular network. This method produces maps of reversible transverse relaxation rate (R2′), deoxygenated blood volume (DBV) and oxygen extraction fraction (OEF).
By applying these methods in an acute TBI patient group, this study aims to investigate global changes in oxygen metabolism in the hours immediately following the initial insult to the brain.
Methods
Recruitment
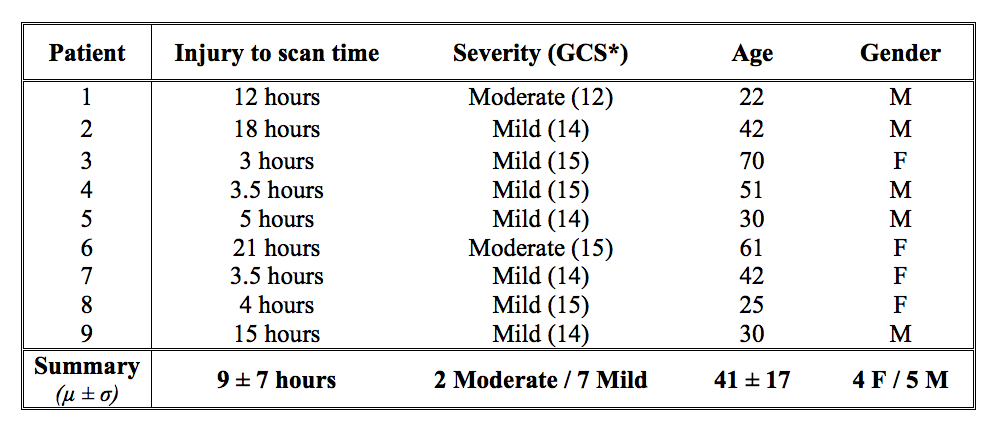
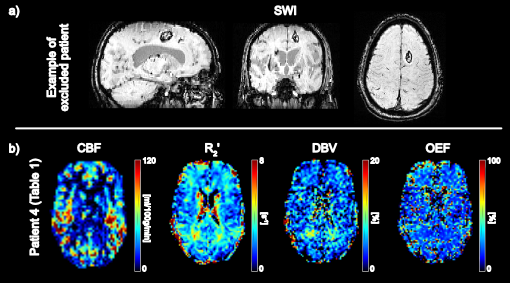
Seventeen TBI patients were prospectively recruited. MRI scanning occurred within 24 hours of injury. As the aim of this study was to investigate global changes in oxygenation, patients were excluded from further analysis if large lesions (haematoma or contusion) were evident on the susceptibility weighted images (SWI) acquired as part of the MRI protocol6 (Figure 1). The remaining nine patients were classified as suffering “Mild” or “Moderate” TBI using the Glasgow Coma Scale (GCS). Demographics for this patient group are presented in Table 1. A healthy, age matched control group (n=9) was recruited and scanned for comparison.
MRI scanning
MRI was performed in the patient and control groups using a Siemens 3T Verio scanner. Multiple post-labelling delay PCASL7 and sqBOLD (FOV=220mm2, 96x96 matrix, nine 5mm slabs, 2.5mm gap, TR/TE=3s/82ms, BW=2004Hz/px, TIFLAIR=1210ms, ASE-sampling scheme τstart:Δτ:τfinish=-16:8:64ms, scan duration 4.5mins) acquisitions were performed as part of a larger MRI protocol. This larger protocol included T1-weighted MPRAGE and SWI images that were used in this study.
Image processing and analysis
Calculation of flow and oxygenation parameter maps from PCASL and sqBOLD data has previously been detailed5,7. Cortical grey matter (CGM) masks were produced by tissue segmentation of the T1-weighted images8 and removal of deep grey matter structures using MNI cortical masks9. CGM masks were registered into the native space of the sqBOLD and PCASL parameter maps and thresholded to create binarised ROIs. Median values of R2′, DBV, OEF and CBF in global CGM were extracted for each patient/control.
Results
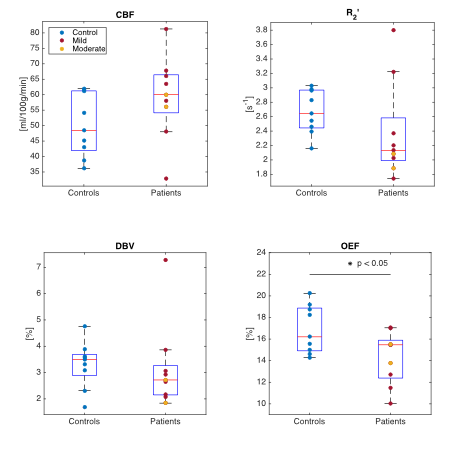
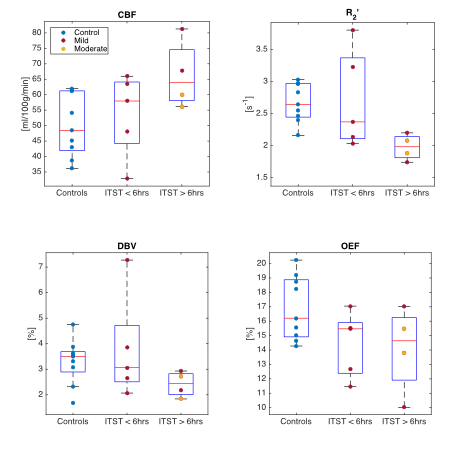
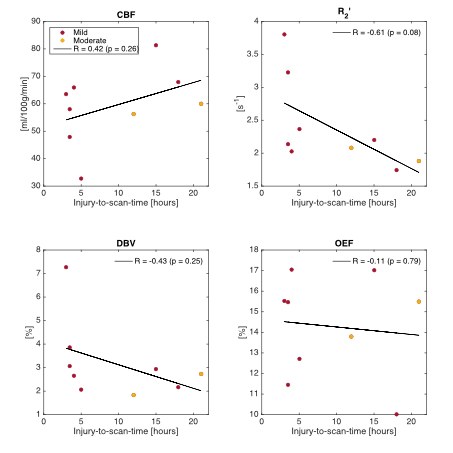
Figure 2 compares median parameter values in global CGM for the control and TBI groups. Unpaired t-tests were used to test for significant differences between the groups. Although only the decline in OEF reaches statistical significance (p<0.05), several TBI patients showed high CBF and low R2′ and DBV compared to the median of the control group. Figure 3 and 4 investigate the role of injury to scan time (ITST) on the physiological parameters. Figure 3 compares the matched control group with the TBI group categorised into two classes split by ITST; early acute (ITST<6hours; n=5) and late acute (ITST=12-21hours; n=4). Figure 4 plots the correlation between ITST and the physiological parameters with none reaching significance.Discussion
In the 24 hours after injury, a mixed group of “mild” and “moderate” TBI patients (n=9) show a decrease in OEF (p=0.03) compared to the control group. Although OEF appears reduced after injury it is unclear whether normal oxygen metabolism in tissue is maintained or disrupted. Reduced oxygen metabolism rates in tissue can cause impaired function and hypoxia or ischaemia in extreme situations. As such, tissue metabolism cannot be maintained unless the apparent decreases in OEF are accompanied by commensurate increases in CBF. In this study, the increase in TBI group median CBF compared to controls was not significant (p=0.11). However, the relatively small sample size in this study provides low power warranting further investigation in a larger cohort. Increases in both CBF and blood oxygenation have recently been reported in the acute stages of “mild” TBI2,3.Conclusion
Imaging acquired in a small group of TBI patients, within 24 hours of injury, suggest that blood oxygenation is increased (decreased OEF) within the acute stages of TBI. It is uncertain whether oxygen metabolism rates in tissue are maintained during this period. These pathophysiological changes are likely to be dependent on many factors, including ITST and injury severity. Further longitudinal investigation in a larger cohort is warranted to thoroughly characterise oxygen supply and demand in TBI.Acknowledgements
We wish to acknowledge the facilities provided by the Oxford Acute Vascular Imaging Centre and the Oxford Neuro Intensive Care Team for facilitating the scanning of patients. Supported by the NIHR Biomedical Research Centre, based at Oxford University Hospitals Trust, Oxford. The Wellcome Centre for Integrative Neuroimaging is supported by core funding from the Wellcome Trust (203139/Z/16/Z). This work was also funded by EPSRC grant EP/K025716/1 and The Royal Academy of Engineering. The views expressed are those of the author(s) and not necessarily those of the NHS, the NIHR or the Department of Health.References
1Ragan, D. K., McKinstry, R., Benzinger, T., Leonard, J. R., & Pineda, J. A. (2012). Alterations in cerebral oxygen metabolism after traumatic brain injury in children. Journal of Cerebral Blood Flow & Metabolism, 33(1), 48–52.
2Doshi, H., Wiseman, N., Liu, J., Wang, W., Welch, R. D., O’Neil, B. J., et al. (2015). Cerebral hemodynamic changes of mild traumatic brain injury at the acute stage. PLoS ONE, 10(2), e0118061.
3Chai, C., Guo, R., Zuo, C., Fan, L., Liu, S., Qian, T., et al. (2017). Decreased susceptibility of major veins in mild traumatic brain injury is correlated with post-concussive symptoms: A quantitative susceptibility mapping study. NeuroImage Clinical, 15, 625–632.
4Dai W, Garcia D, de Bazelaire C, Alsop DC. Continuous flow-driven inversion for arterial spin labeling using pulsed radio frequency and gradient fields. Magn Reson Med 2008;60:1488–1497.
5Stone, A. J., & Blockley, N. P. (2017). A streamlined acquisition for mapping baseline brain oxygenation using quantitative BOLD. NeuroImage, 147, 79–88.
6Lawrence, T. P., Pretorius, P. M., Ezra, M., Cadoux-Hudson, T., & Voets, N. L. (2017). Early detection of cerebral microbleeds following traumatic brain injury using MRI in the hyper-acute phase. Neuroscience Letters, 655, 143–150.
7Okell TW, Chappell MA, Kelly ME, Jezzard P. Cerebral blood flow quantification using vessel-encoded arterial spin labeling. J Cereb Blood Flow Metab 2013;33:1716–1724.
8Zhang, Y. Y., Brady, M., & Smith, S. (2001). Segmentation of brain MR images through a hidden Markov random field model and the expectation-maximization algorithm. Ieee Transactions on Medical Imaging, 20(1), 45–57.
9Mazziotta, J., Toga, A., Evans, A., FOX, P., Lancaster, J., Zilles, K., et al. (2001). A probabilistic atlas and reference system for the human brain: International Consortium for Brain Mapping (ICBM). Philosophical Transactions of the Royal Society of London. Series B, Biological Sciences, 356(1412), 1293–1322.
Figures