4939
Regional fractional anisotropy and processing speed in diffuse traumatic brain injury: An exploratory analysis using a linear regression panel model1Stony Brook University, Stony Brook, NY, United States, 2Department of Molecular, Cellular, and Biomedical Sciences, The City College of New York School of Medicine, New York, NY, United States, 3Stony Brook University School of Medicine, Stony Brook, NY, United States
Synopsis
Recently, Ware and colleagues1 showed that FA-derived damage assessment in WM regions can accurately classify subjects with processing speed impairment in moderate to severe diffuse TBI at 3 months post-injury. Using a subset of the same cohort who completed follow-up DTI scans at 6 and 12 months post-injury, the goals of this study were 1) to investigate if regional FA remains associated with processing speed in a dataset including all time points and 2) to conduct an exploratory analysis to identify a subset of regions that can best explain such association. Four regions were identified that explained most variance in processing speed.
Introduction
Diffuse white matter damage and its effect on neurocognitive outcome after traumatic brain injury (TBI) has been extensively studied in cross sectional studies using diffusion-MRI. It was recently reported that subject-specific assessment of diffuse White Matter (WM) microstructural damage in TBI (reduced Fractional Anisotropy (FA)) at 3 months post-injury can predict severe cognitive processing speed impairment1. Impairment classification accuracies >50% were found in 11 WM regions1 – Genu, Body and Splenium of Corpus Callosum, Left/Right - Anterior, Superior and Posterior Corona Radiata, Left/Right Superior Longitudinal Fasciculus. The goal of this study is to extend these results by including 6 and 12 months post-injury follow-up scans and then investigating which of the 11 WM regions1 remain strongly associated with Processing Speed Index (PSI) in an exploratory analysis using a linear regression panel model.Methods
Twenty two patients (age = 32 +/- 14 years, 7F) with moderate- severe TBI were scanned 3, 6 and 12 months post-injury on a 3T Siemens Trio MRI scanner. Two 30-direction DTI sequences (b=0,1000s/mm2, 2.2mm isotropic resolution, TE=84ms, TR=6500ms) and a high-resolution T1-weighted MPRAGE sequence (1mm isotropic resolution, TE=3.08ms, TR=1620ms) were acquired. All participants underwent neuropsychological testing for PSI at each time point.
FA maps derived post-eddy current correction using FSL’s Diffusion Toolbox (FDT) were normalized to MNI space using a two-step registration of DTI (b=0) images to subject’s T1-w images which were nonlinearly registered to MNI anatomical template. Mean FA values were extracted from each subject in 11 regions of Johns Hopkins University (JHU)-WM2 atlas that showed >50% accuracy in identifying patients with significant PSI impairment1. The longitudinal data set was subjected to a linear regression panel model analysis to determine if FA values in these regions were associated with PSI at corresponding time-points. To identify subsets of 11 regions whose mean FA values were more strongly associated with PSI than the whole set, data driven analyses were performed on FA values from all region combinations (11C1-11C11).
Results and Discussion
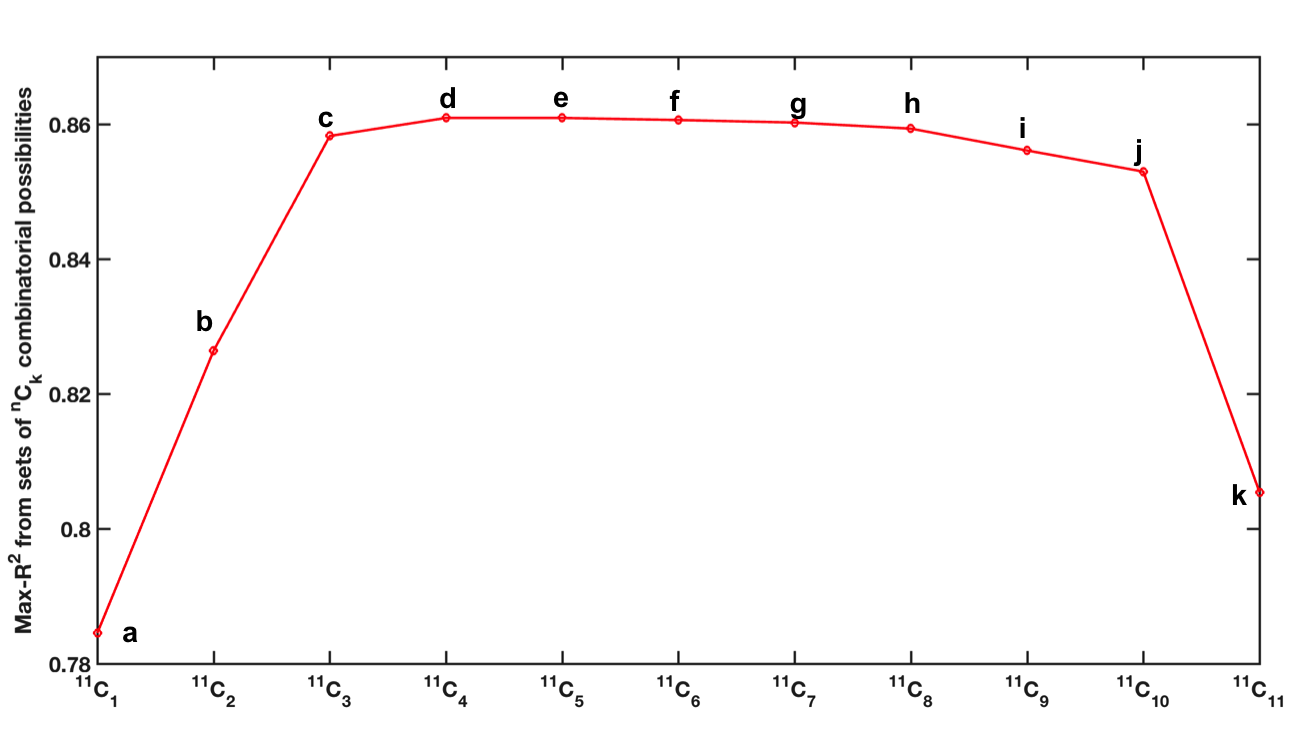
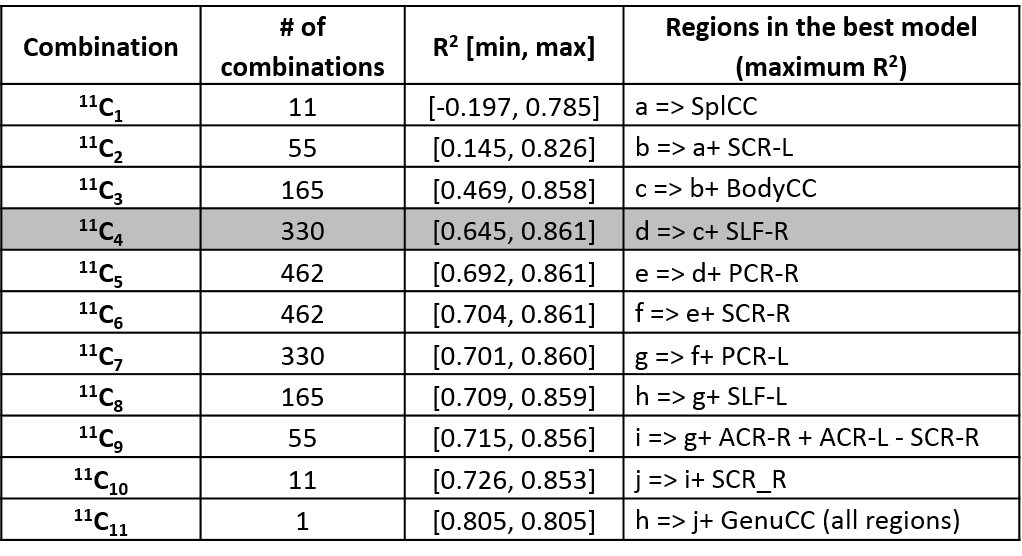
Average FA in the 11 regions and PSI across all subjects and time-points are listed in Table 1. The 11 mean FA values x 3 time-points of each subject as predictors of corresponding PSI scores yielded a regression model with coefficient of determination R2=0.79. Results from the combinatorial regression models (Figure 1) show maximum possible R2 achieved with each set of nCk (n=11,k=1,2,...,11) combinatorial possibilities (Table 2). Of all 11 regions (possibilities in 11C1), longitudinal FA measures from the splenium of corpus callosum had the best fit (R2=0.78) for correlation with PSI measures (Tables 1 and 2).
Our results indicated that FA from 4 regions (Body and Splenium of Corpus Callosum, Left Superior Corona Radiata and Right Superior Longitudinal Fasciculus) together best explained PSI scores. These regions continue to be in best-fit models even when additional regions were included in the analysis. FA from Genu of corpus callosum did not correlate with PSI scores as seen in Table 1, and its inclusion resulted in a drop in R2 (Figure 1).
Conclusion
Results from this study suggest that regions most prone to injury in moderate-severe TBI exhibit FA metrics, markers of microstructural damage that correlate with processing speed observed at various time points from the injury.Acknowledgements
No acknowledgement found.References
1. Ware, J.B., et al., Inter-Subject Variability of Axonal Injury in Diffuse Traumatic Brain Injury. J Neurotrauma, 2017. 34(14): p. 2243-2253.
2. MRI Atlas of Human White Matter. American Journal of Neuroradiology, 2006. 27(6): p. 1384-1385.
Figures