4936
Permeability of the blood-brain barrier predicts no evidence of disease activity at two years after natalizumab or fingolimod treatment in relapsing-remitting multiple sclerosis1Department of Clinical Physiology, Nuclear Medicine and PET, Rigshospitalet, Glostrup Hospital, Glostrup, Denmark, 2Clinical Neurosciences, Clinical and Experimental Sciences, Faculty of Medicine, University of Southampton, United Kingdom, Southampton, United Kingdom, 3Department of Neurology, Rigshospitalet, Glostrup Hospital, Glostrup, Denmark
Synopsis
Dynamic contrast-enhanced MRI enables measurements of the permeability of the blood-brain barrier (BBB), possibly a marker of disease activity in multiple sclerosis (MS). In order to investigate if permeability predicts early suboptimal treatment response, defined as loss of no evidence of disease activity (NEDA) status after two years, we included 35 relapsing-remitting MS patients initiating either fingolimod or natalizumab, drugs with a common effect of decreasing lymphocyte influx into the CNS. We find that permeability measured after six months of treatment was a good predictor loss of NEDA status at two years and a surrogate marker of the state of health of the blood-brain barrier.
Background
Early detection of sub-optimal treatment response in relapsing-remitting MS is important for effective treatment escalation, but currently no method exists for reliable detection of early poor treatment responders. Previously we demonstrated an association between blood-brain barrier (BBB) permeability, as measured by dynamic contrast-enhanced magnetic resonance imaging (DCE-MRI), and cerebrospinal fluid cellularity.1,2 We hypothesized that DCE-MRI predicts sub-optimal treatment response after two years of treatment with fingolimod or natalizumab, drugs with a common effect of decreasing lymphocyte influx into the CNS.Methods
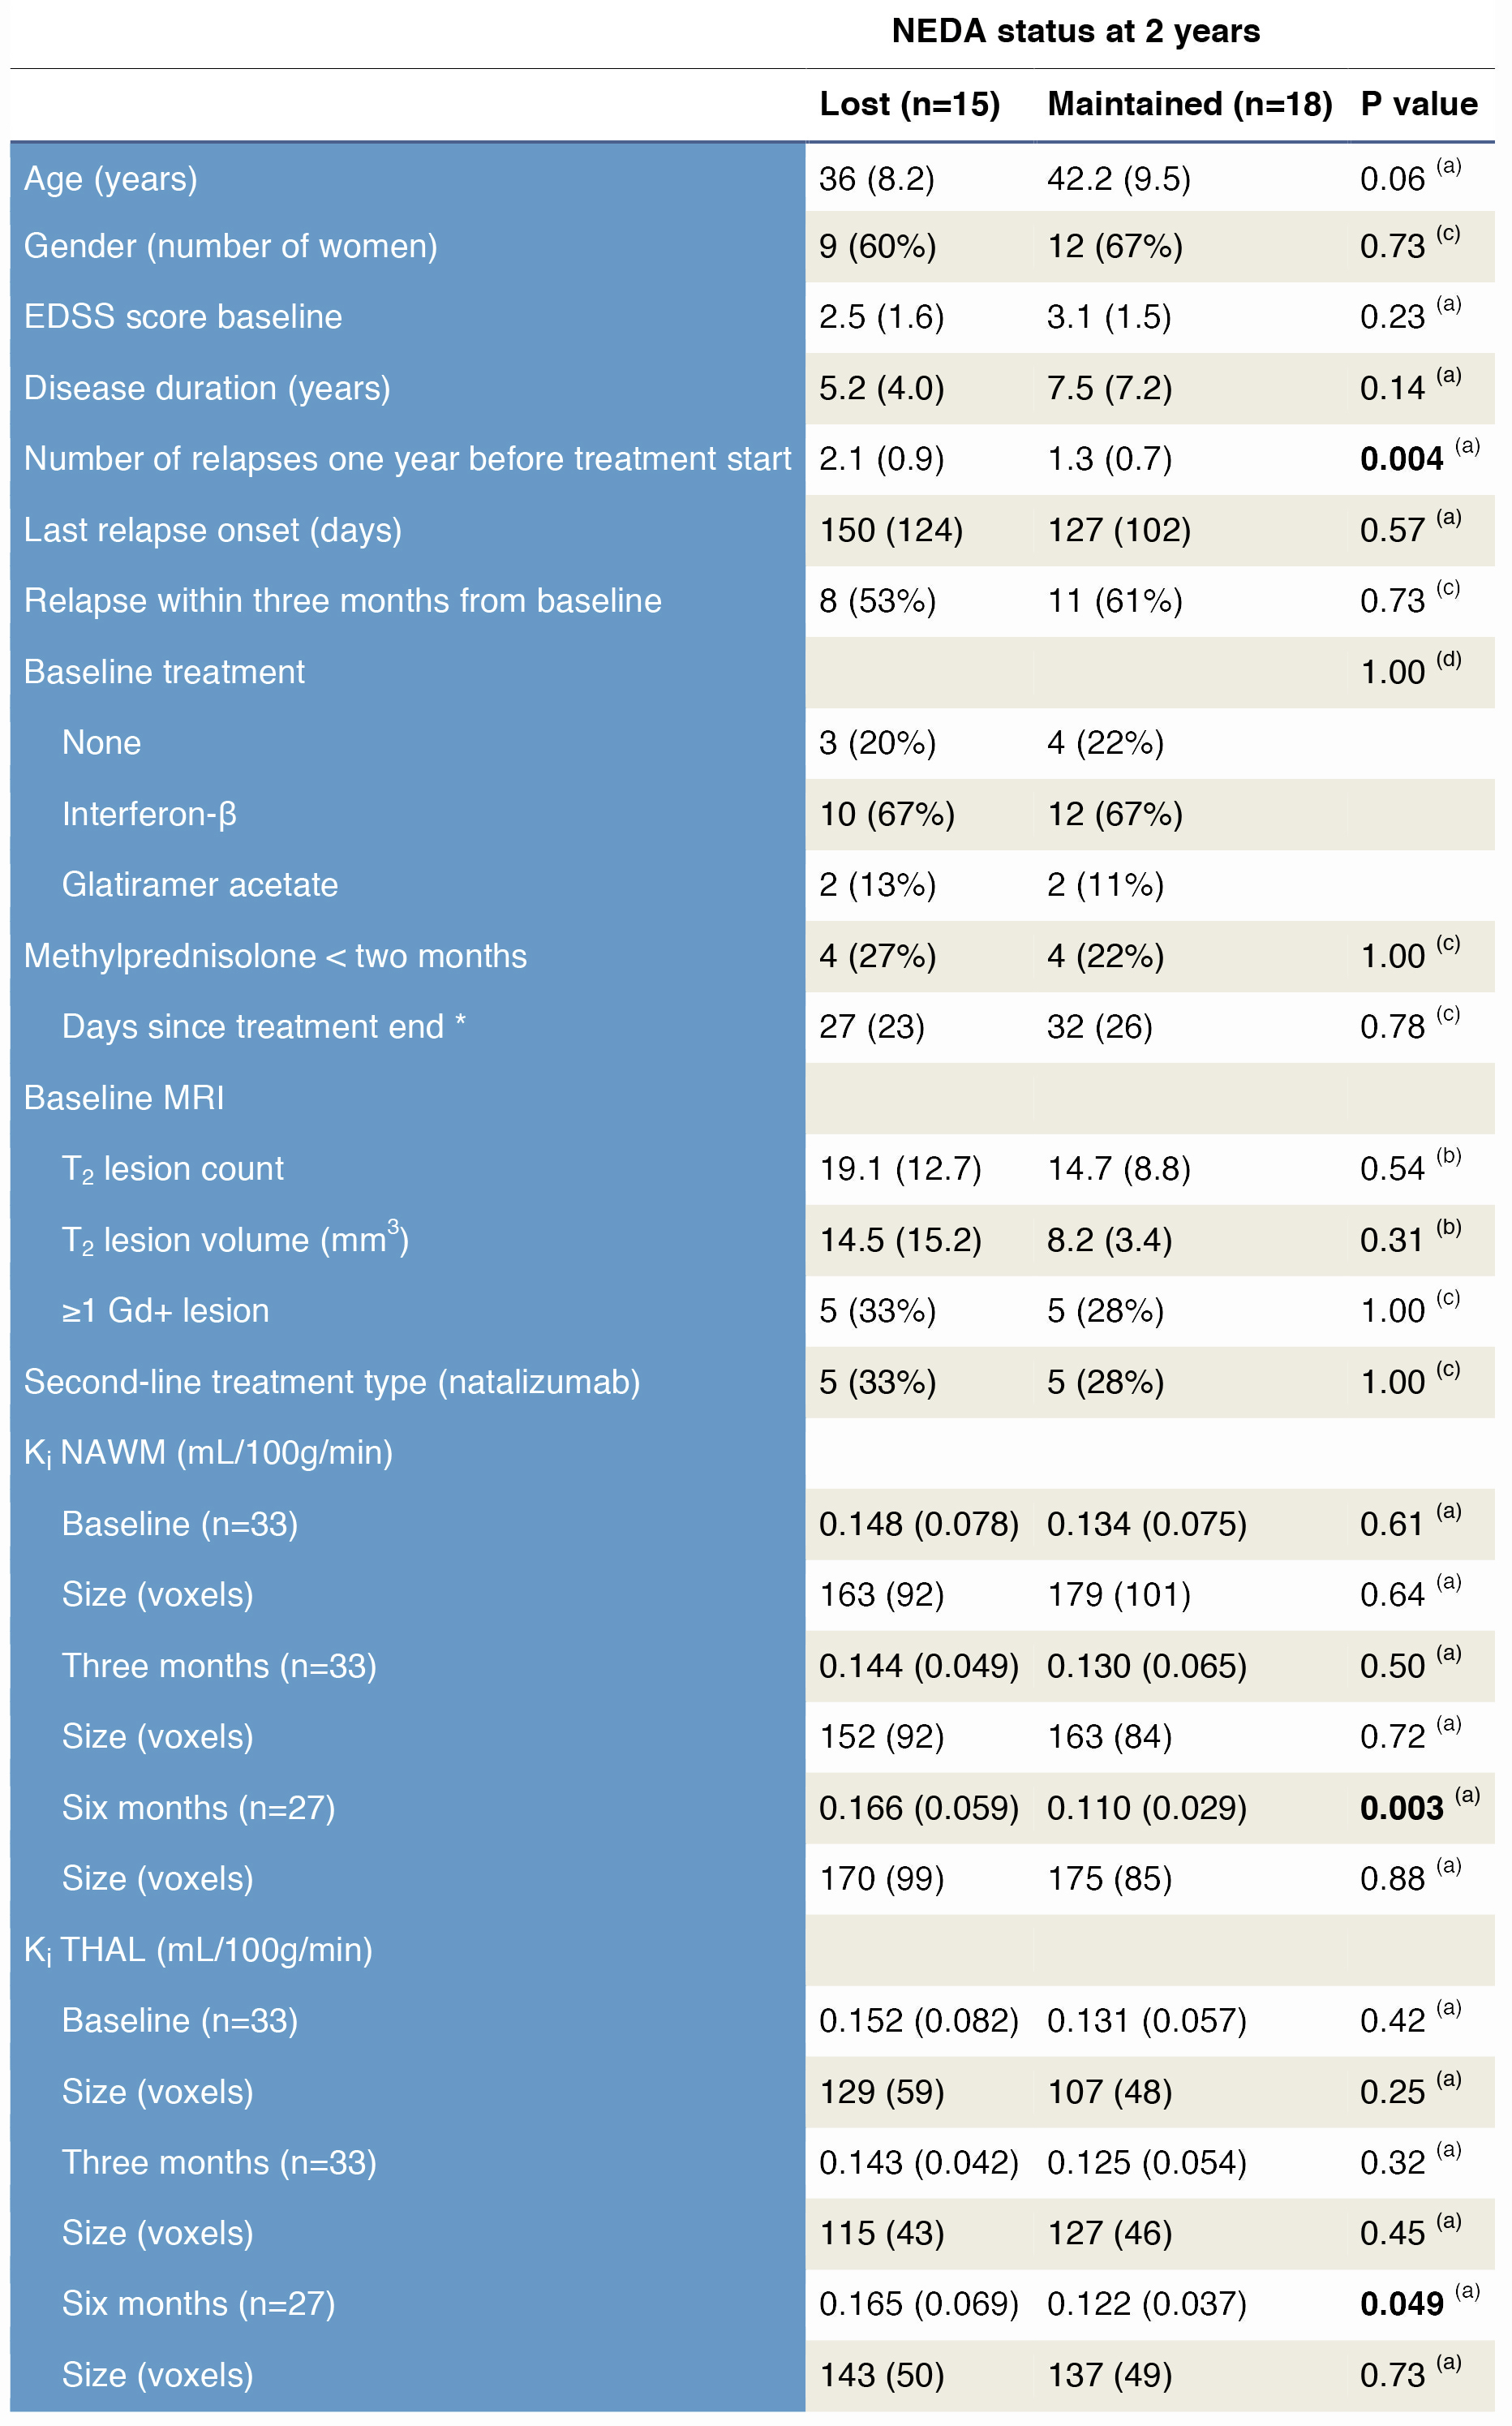
35 relapsing-remitting multiple sclerosis patients starting on fingolimod or natalizumab were scanned with DCE-MRI at 3T, prior to treatment initiation (baseline) and again three and six-months post treatment. We calculated the influx constant Ki, a measure of BBB permeability, using the Patlak model as previously described3,4. Sub-optimal treatment response was defined as loss of no evidence of disease activity (NEDA-3) status after two years of treatment. NEDA-3 is defined as absence of disease activity in three domains: 1) no new or enlarging T2 lesions on MRI, 2) no clinical disease activity in the form of relapses, and 3) no increase in disability as measured by the expanded disability status scale (EDSS). Two subjects who did not complete one year of treatment were excluded.Results
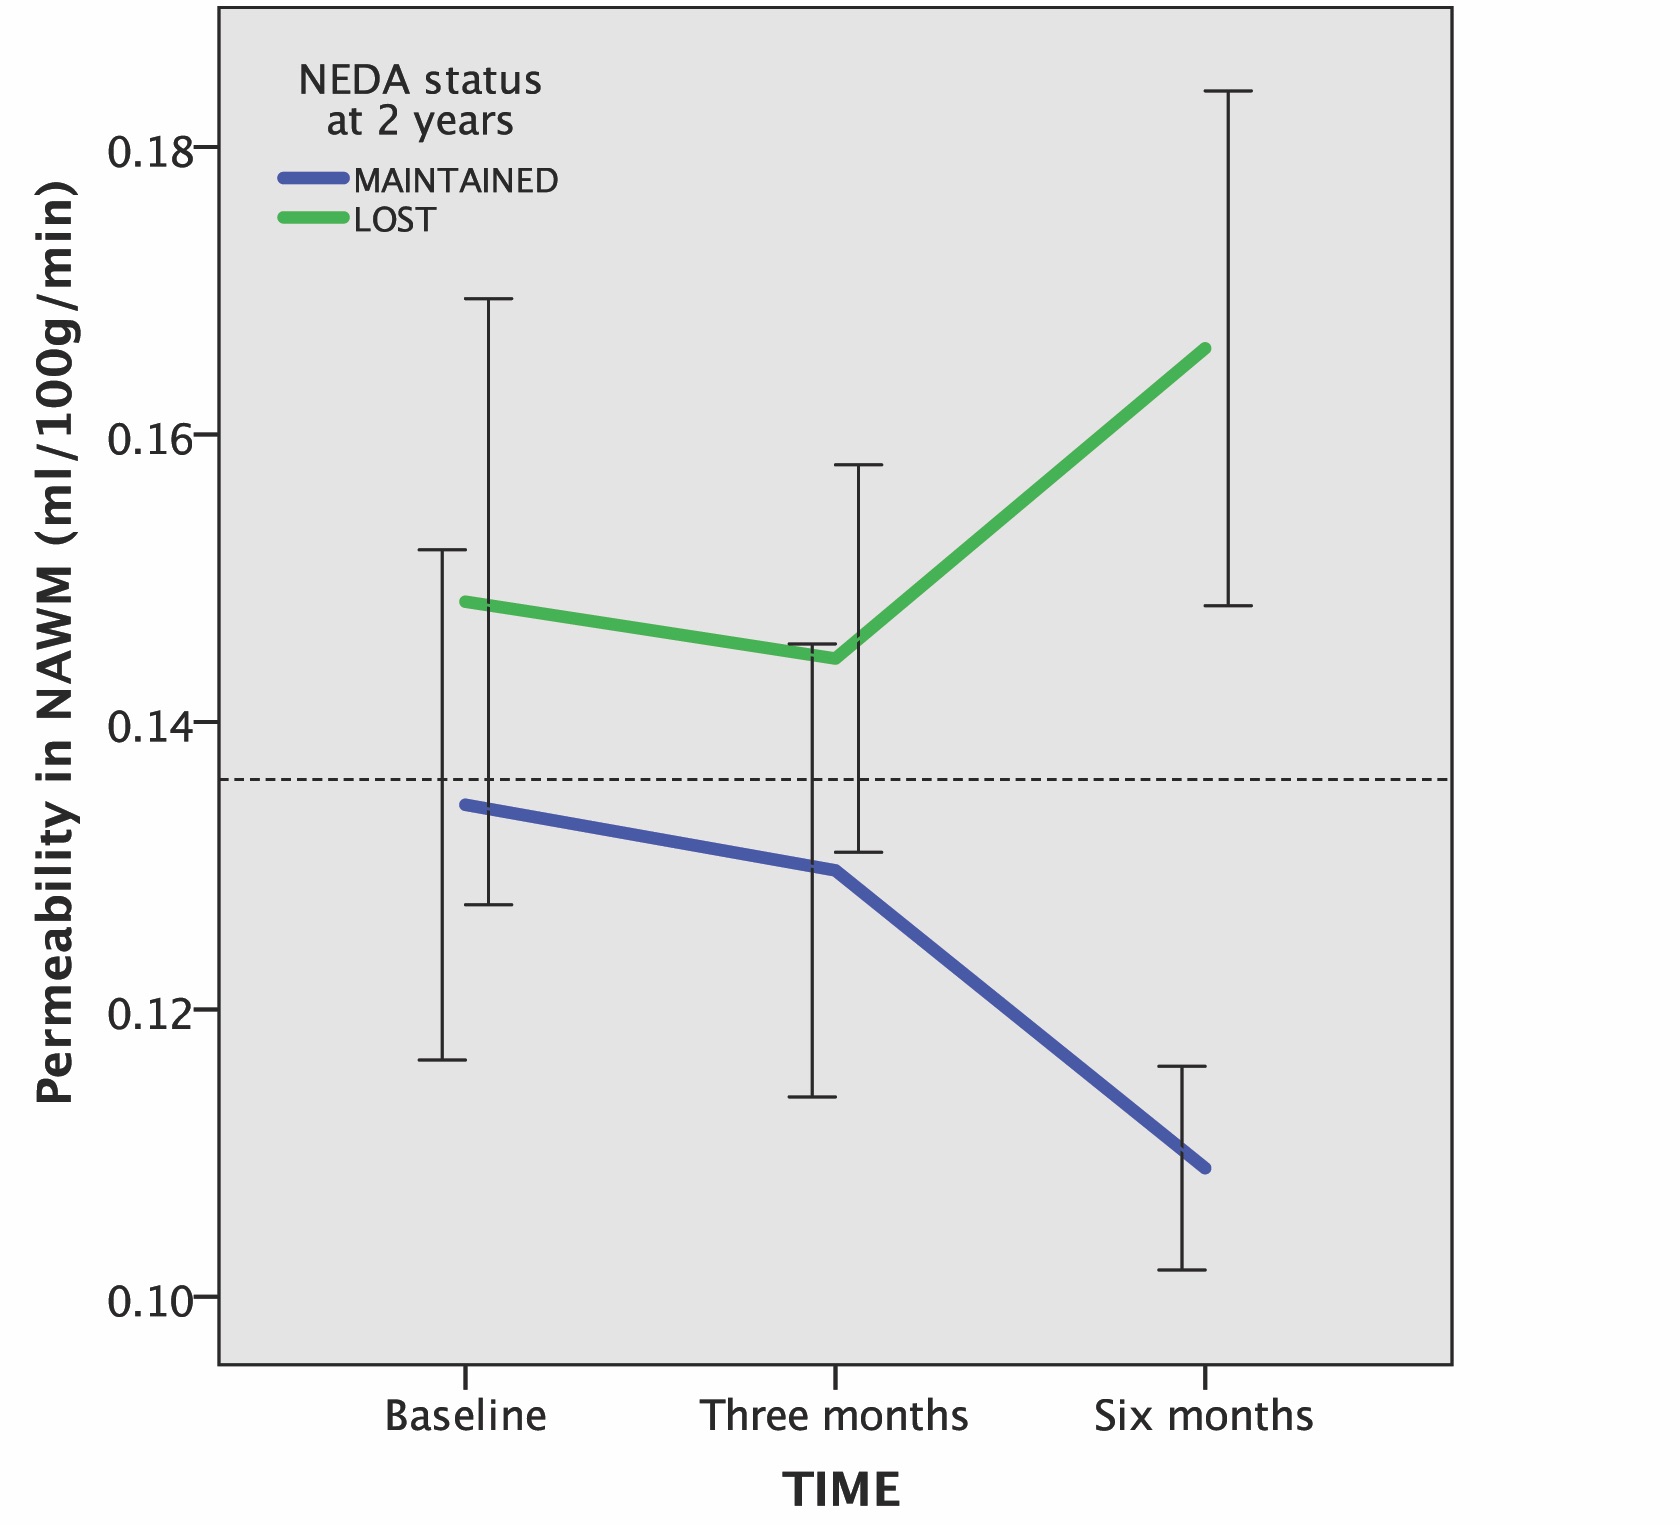
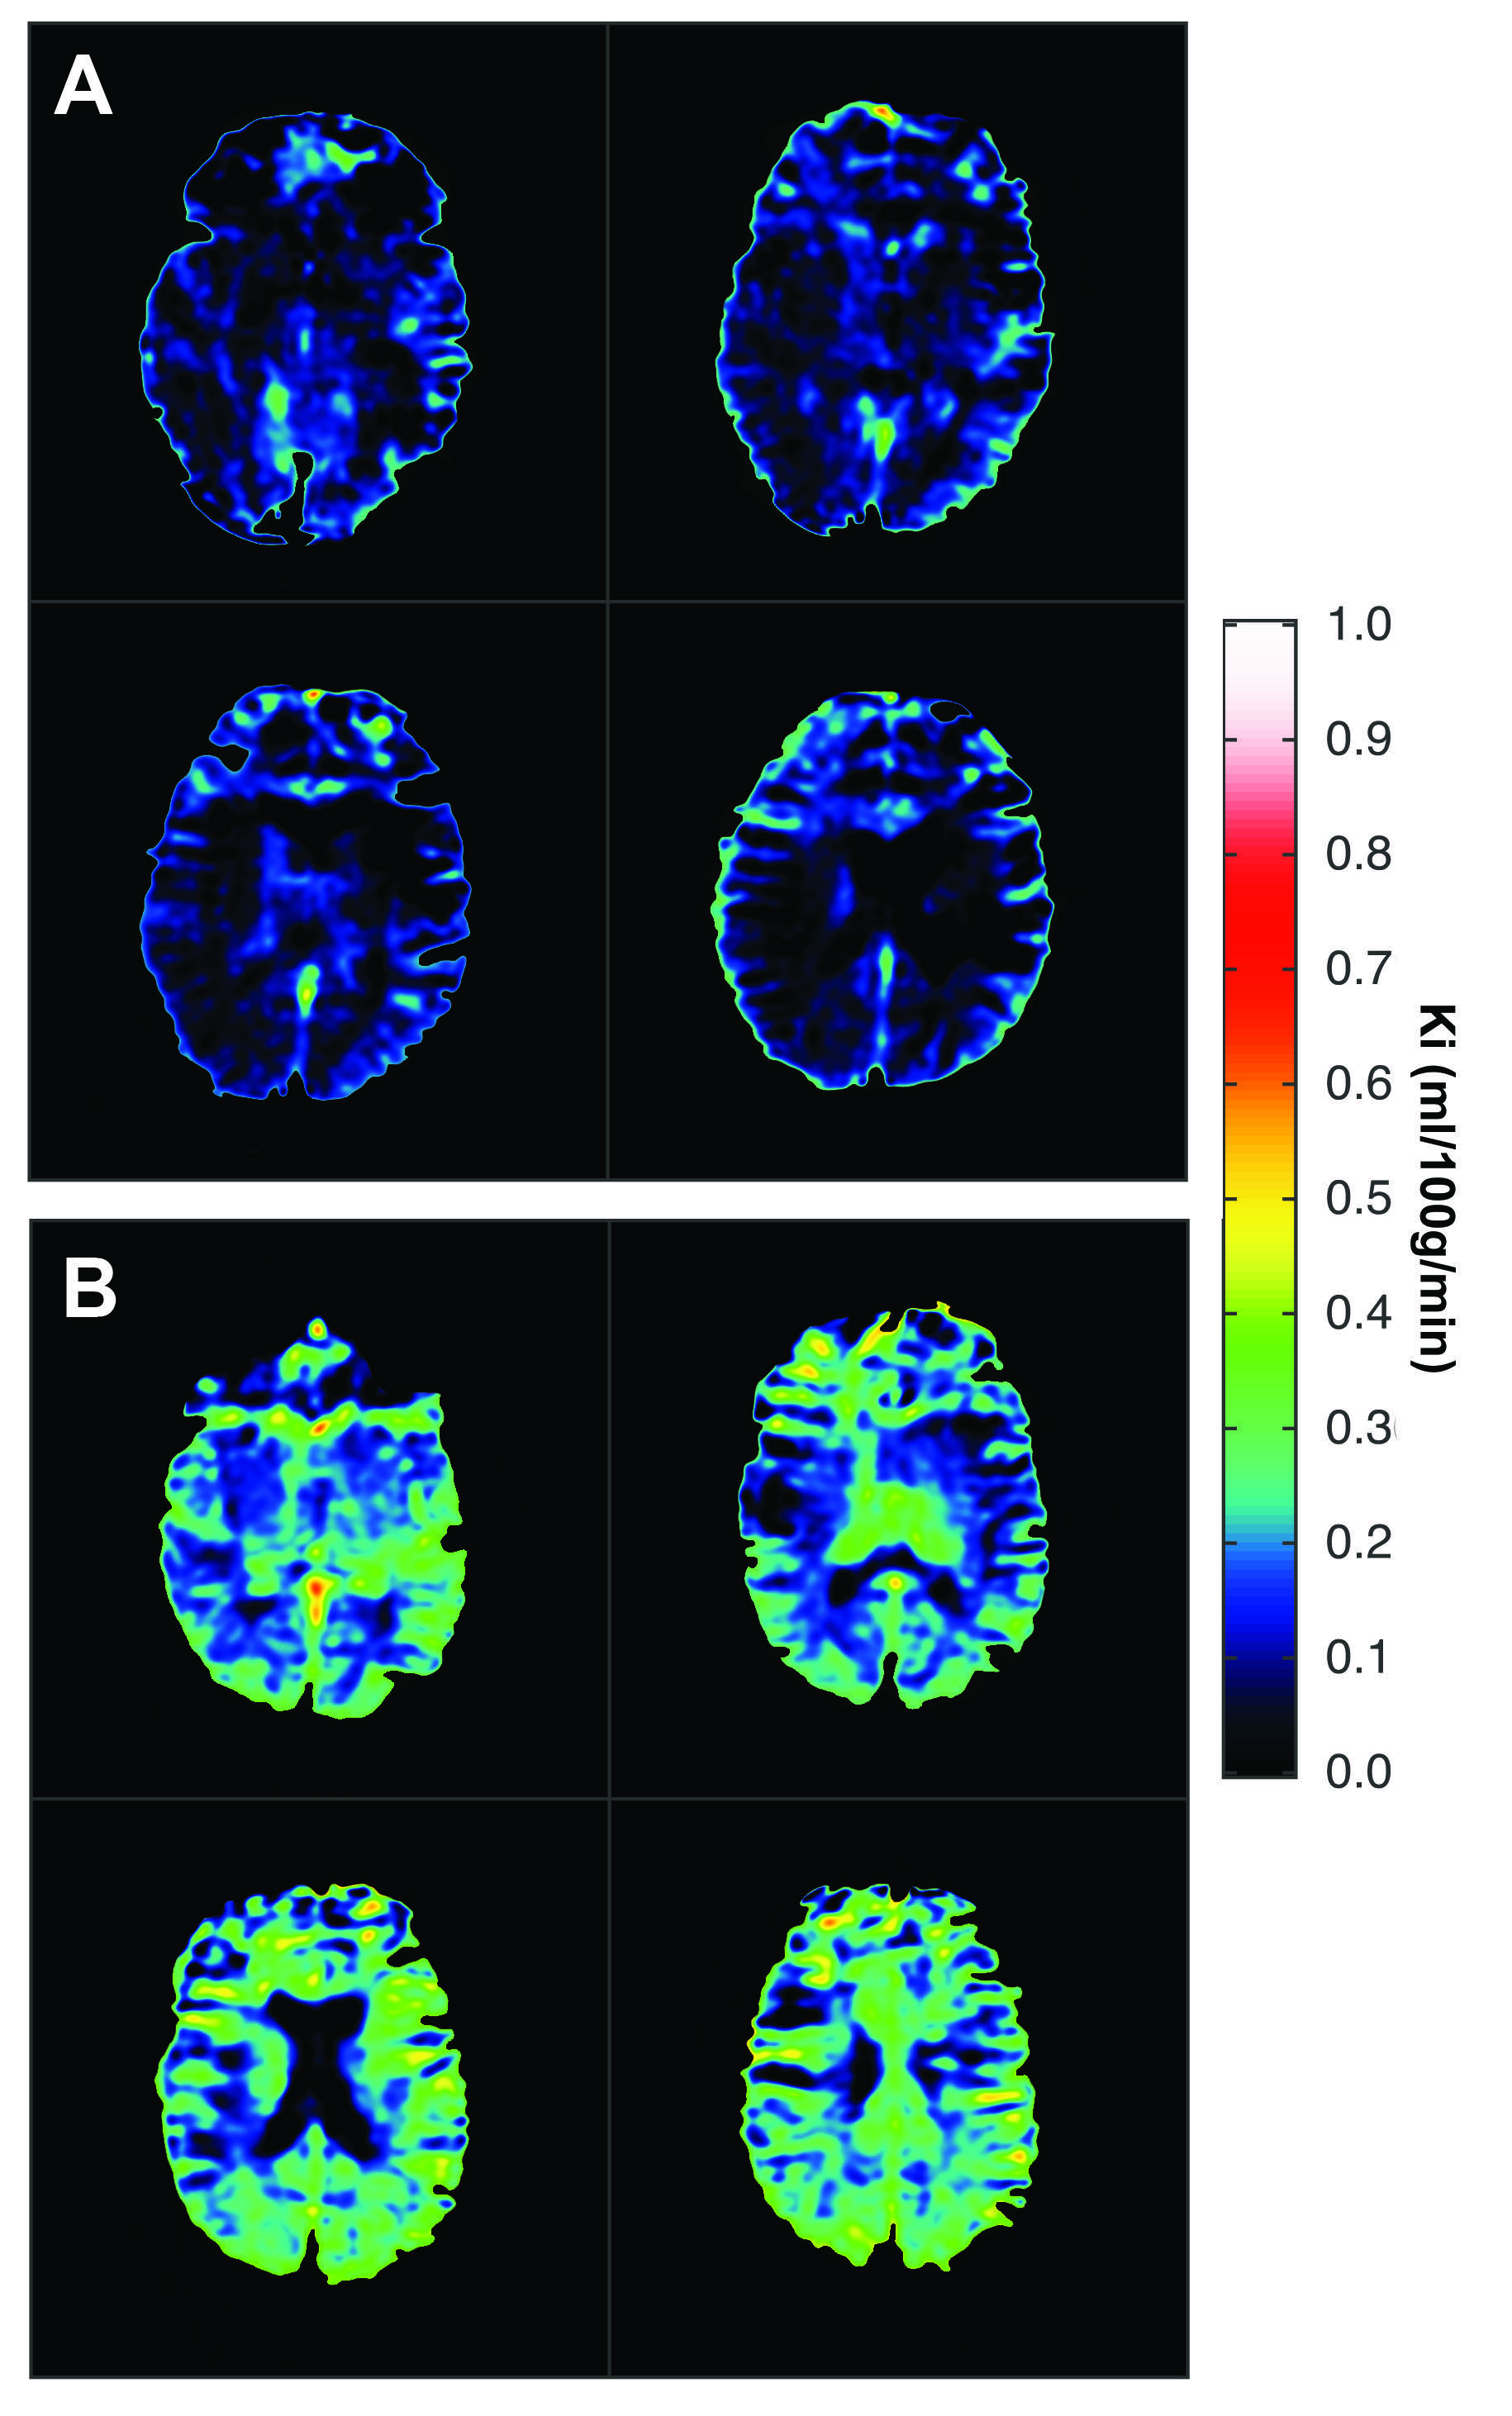
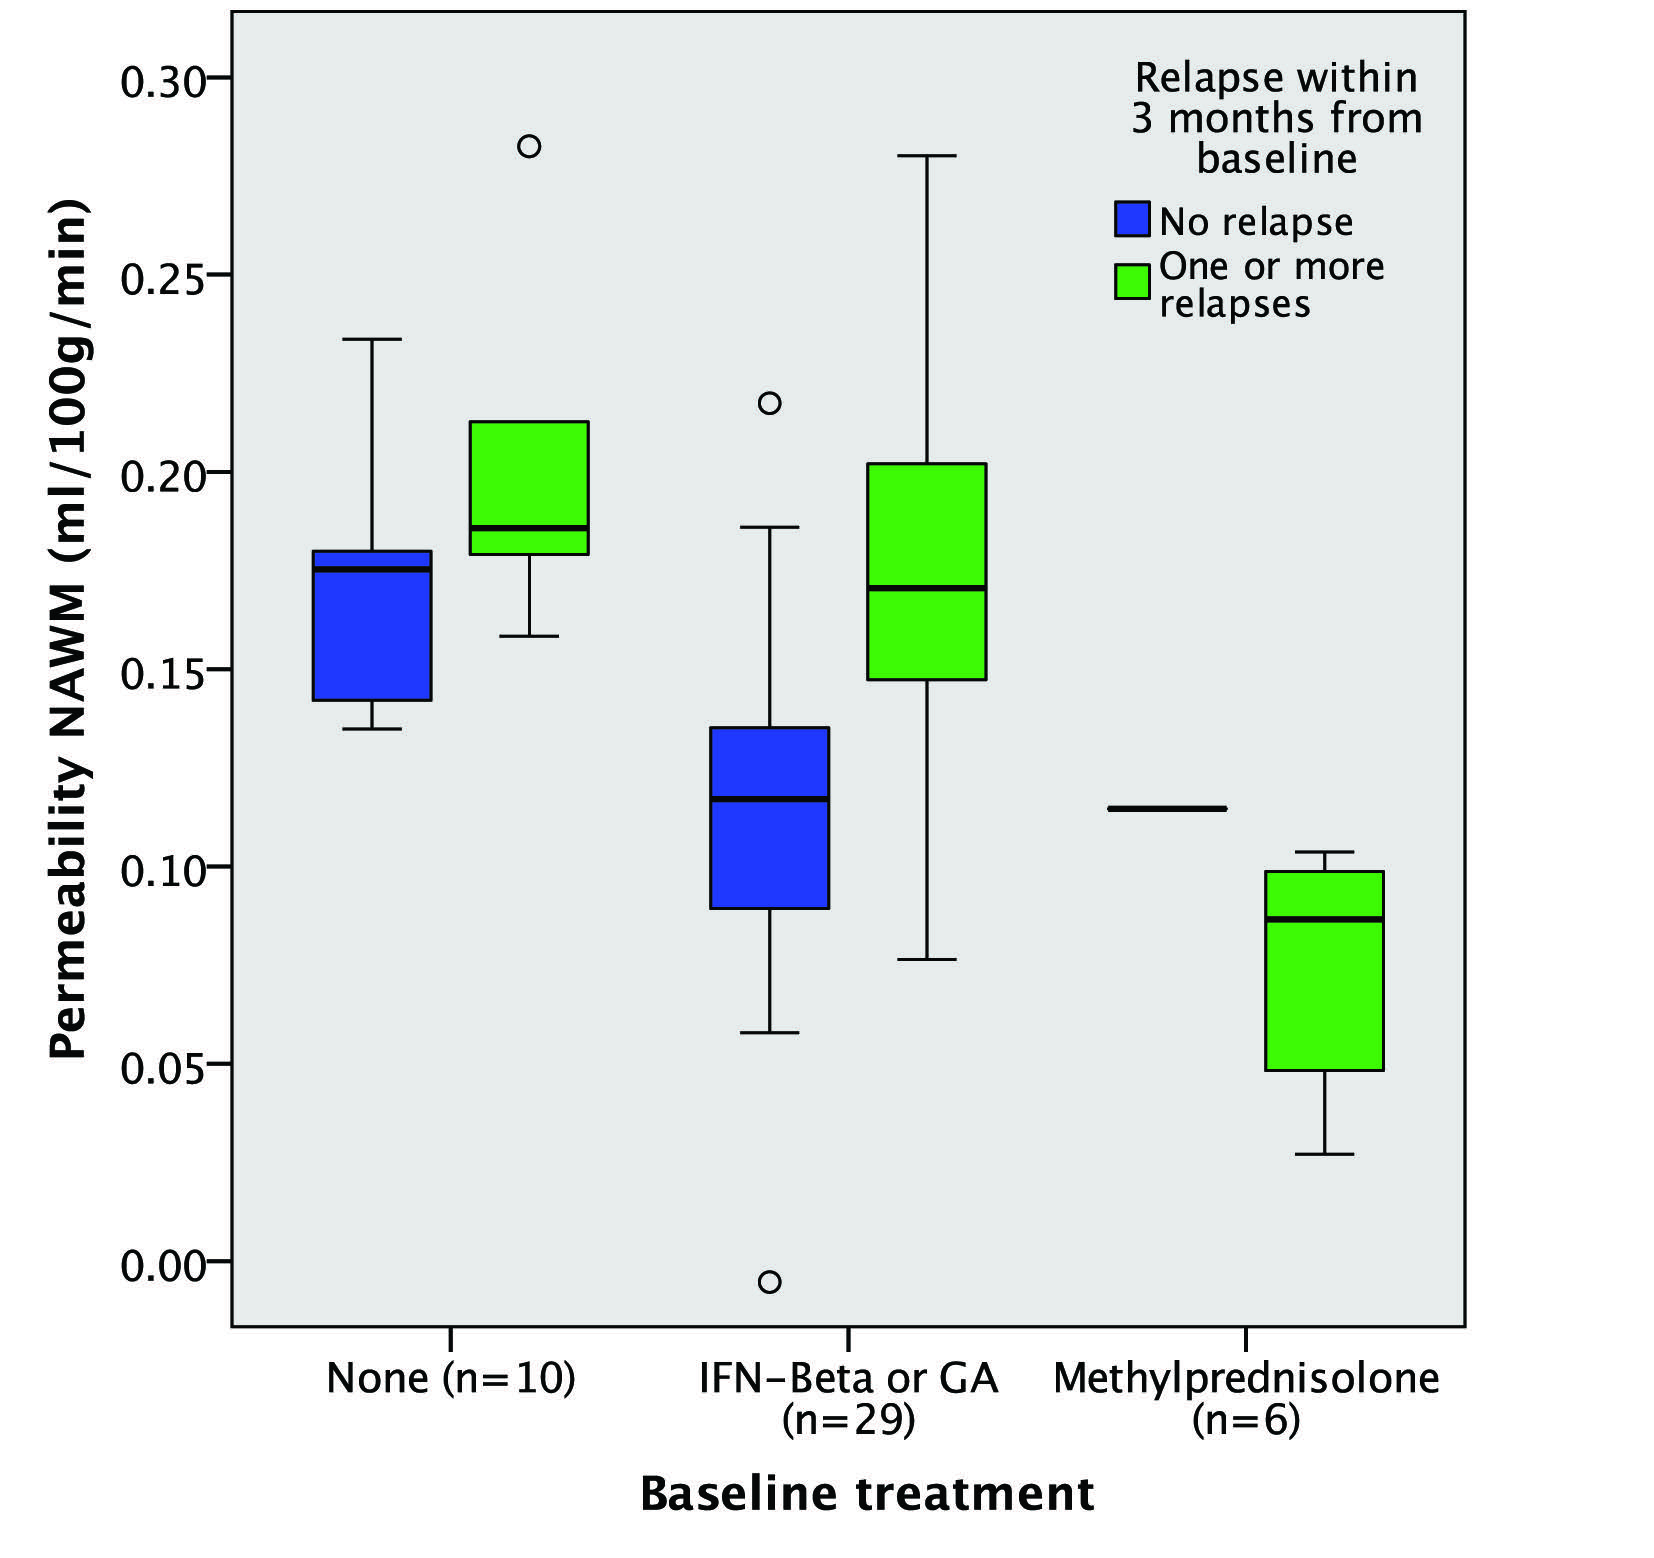
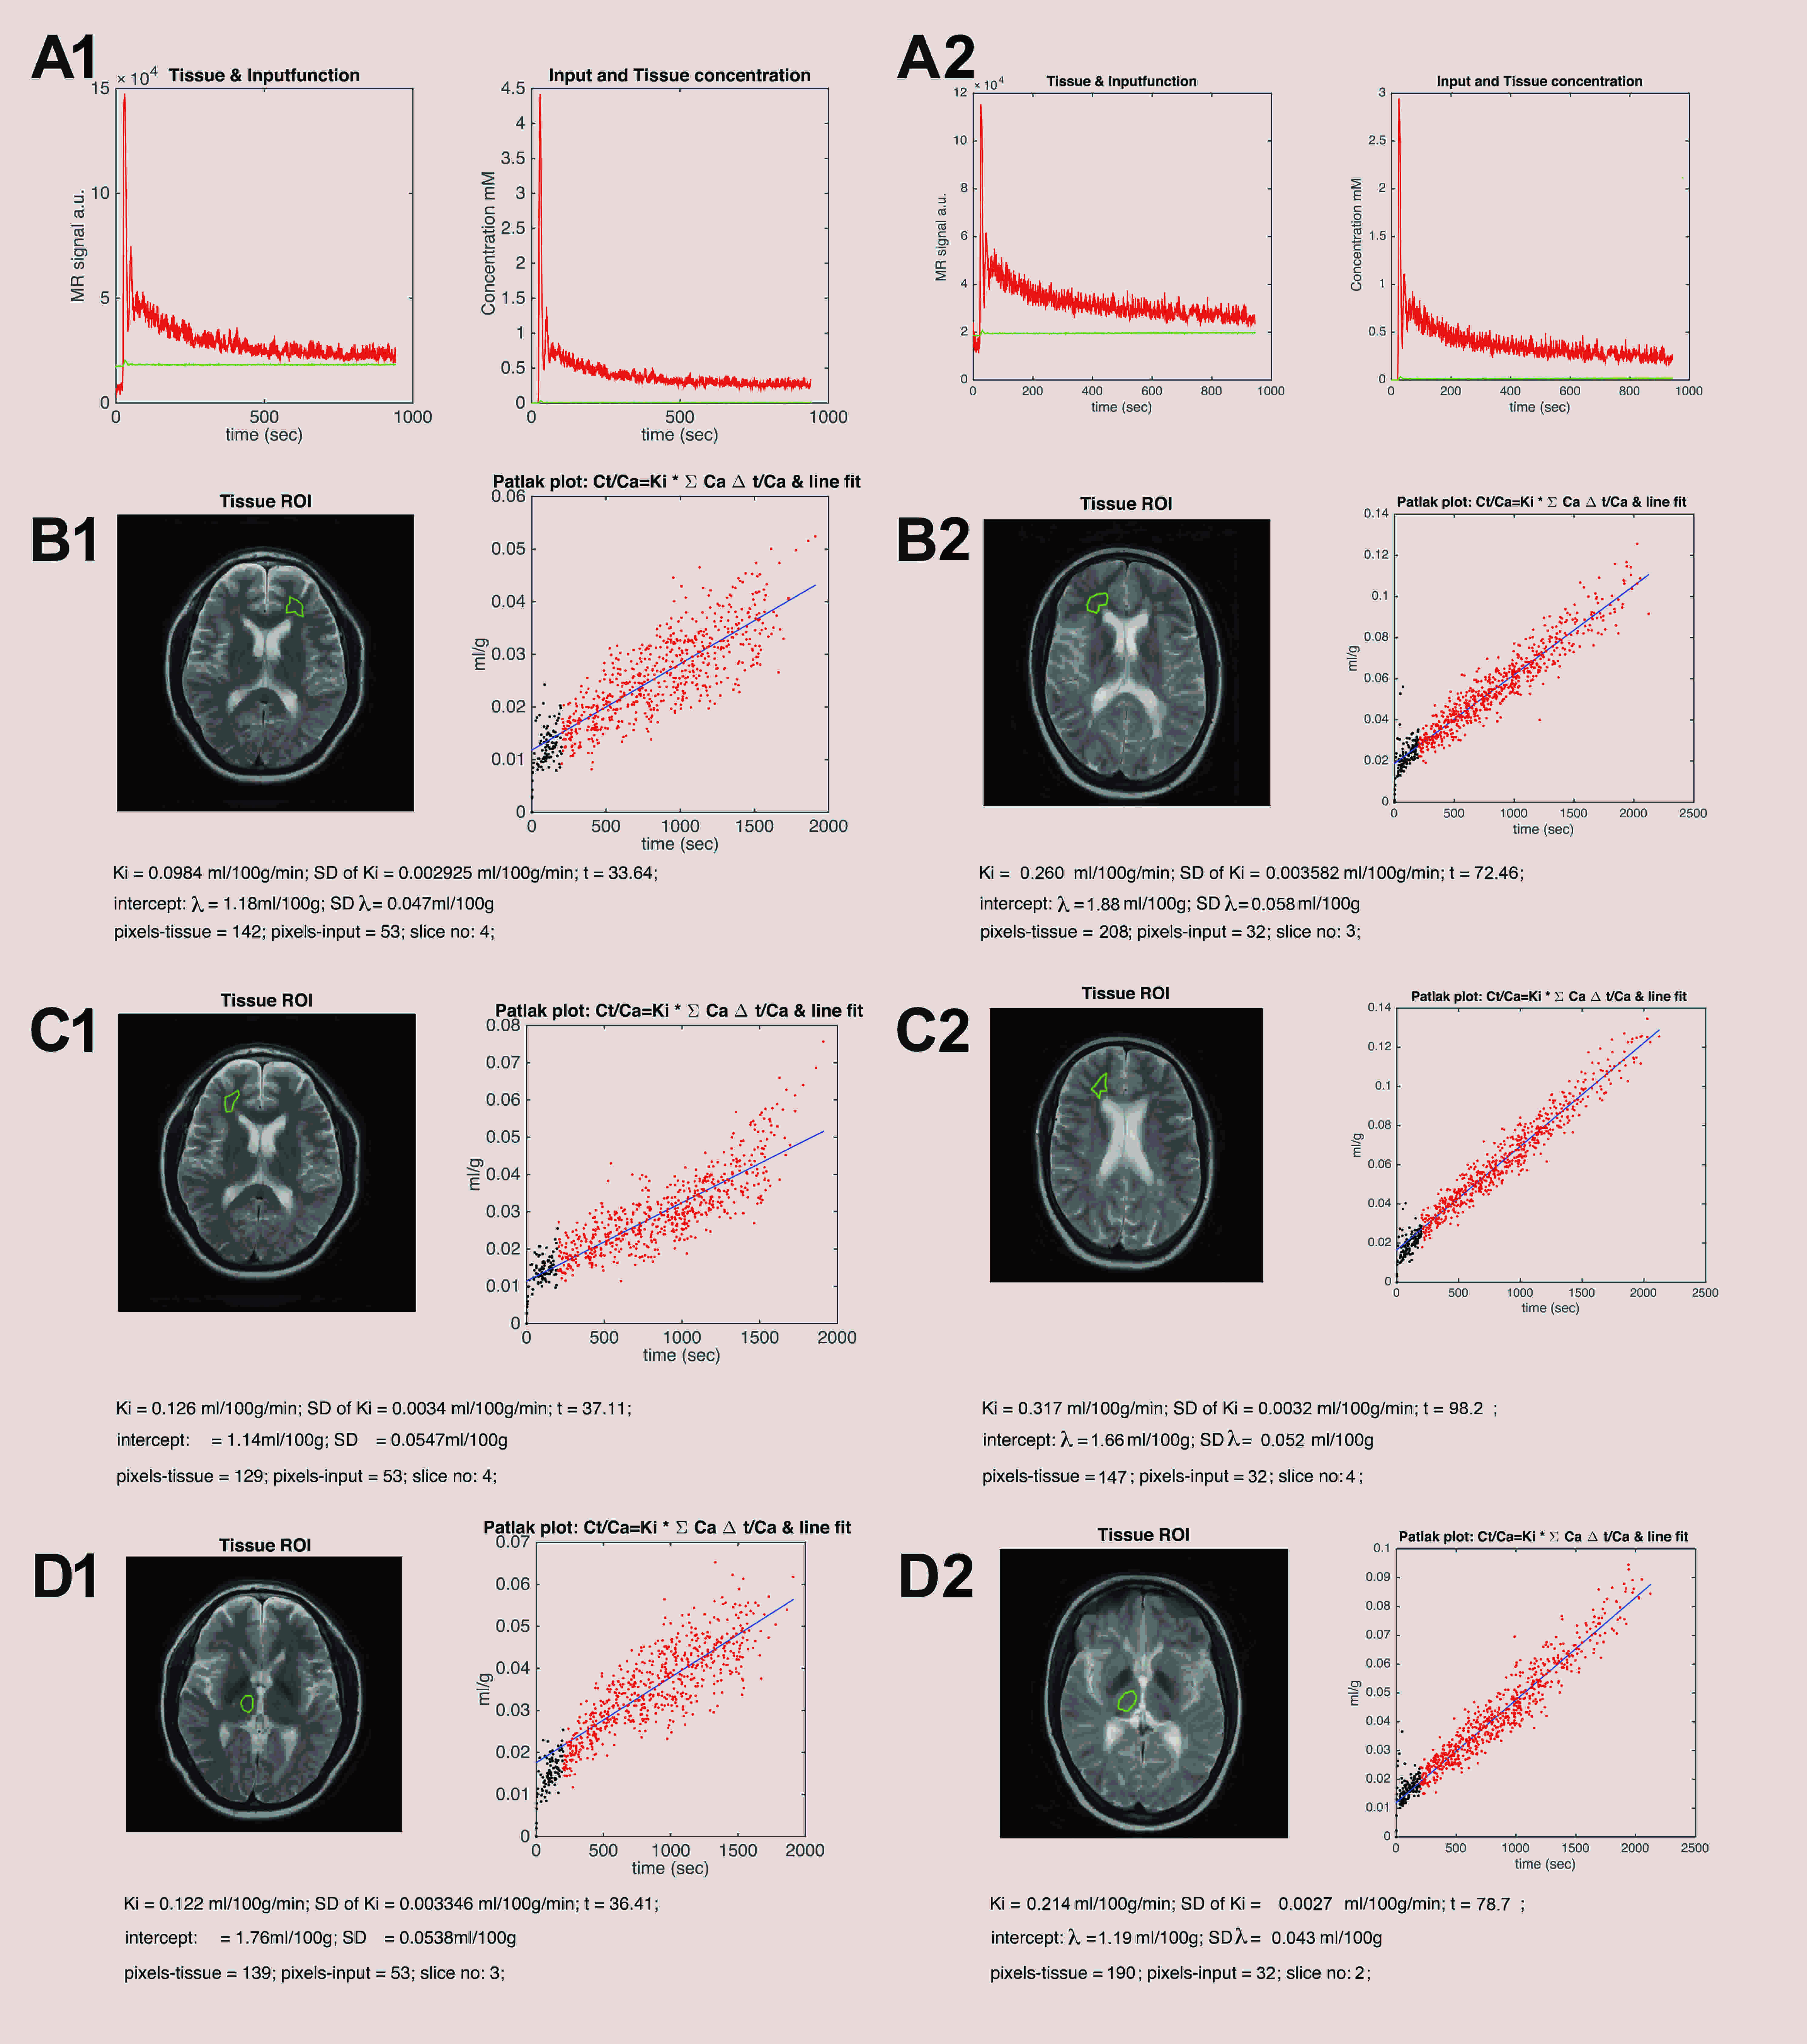
Baseline Ki in normal appearing white matter (NAWM) was significantly predicted by methylprednisolone treatment 2 months prior (β=-0.71, p=0.00008) and days since last relapse (β=-0.48, p=0.005), but not by first-line treatment (yes/no; p=0.55) or visibly contrast enhancing lesions (p=0.76) in a linear regression analysis (model R2=0.40, p=0.0002), see Table 1 and Figure 3. 12 out of 33 (36%) subjects lost NEDA status after one year of treatment and 15 out of 33 (46%) lost NEDA status after two years. Subjects who lost NEDA status at two years had a 51% higher mean Ki in normal-appearing white matter (NAWM) measured after six months of treatment, when compared to the group who maintained NEDA status (p=0.0003), while there was no difference in Ki before treatment initiation or after three months of treatment, see Figure 1. We also found no such difference for NEDA status at one year. Receiver operator characteristic (ROC) curve analysis found Ki in NAWM to be a good predictor of loss of NEDA status at two years (AUC 0.84, p=0.003). Values of NAWM Ki at six months above a cut-off of 0.136 ml/100/g/min yielded an odds ratio of 11.5 for sub-optimal treatment response at 2 years, with positive and negative predictive values of 73% and 81%, respectively. A one-way repeated measures ANOVA with Ki in NAWM as dependent variable showed a significant treatment effect (p=0.038) only when correcting for baseline methylprednisolone treatment (p=0.0003), days since last relapse (p=0.013), and NEDA status (p=0.045) at two years. Voxel-wise Ki maps are shown in Figure 2, where a widespread general increase at 6 months post-treatment in a subject with loss of NEDA status at 2 years can be appreciated. Ki in NAWM was not correlated with the presence of contrast enhancing lesions, while Ki in NAWM and thalamus was strongly intercorrelated both at baseline (Spearman CC=0.86), 3 months (CC=0.88) and 6 months (CC=0.82), arguing that higher Ki in subjects with sub-optimal treatment response in not the results of spill over of contrast agent from contrast-enhancing lesions into the NAWM. Examples of arterial input functions, tissue curves and patlak plots in two subjects are shown in Figure 4.Conclusion
Our results suggest that BBB permeability as measured by DCE-MRI reliably predicts sub-optimal treatment response. The observed delay in treatment effect on Ki indicates that DCE-MRI is a surrogate marker of the state of health of the BBB. We find a predictive threshold for disease activity, which is remarkably identical in clinically isolated syndrome, as previously demonstrated2 and established RRMS investigated in the present study.Acknowledgements
We would like to thank radiographers Bente Sonne Møller and Karina Elin Segers at Dept. of Diagnostics, Glostrup Hospital for scanning assistance and the MD consultants Alex Heick, Rikke Jensen, Houry Hassanpour, and Anna Tsakiri at the MS Clinic, Dept. of Neurology, Rigshospitalet, Glostrup for referring patients for the project. We would like to express our gratitude to the patients for participating. Lastly we would like to thank The Research Foundation of the Capital Region of Denmark, Biogen Idec and The Danish Multiple Sclerosis Society, for their financial support, which made this project possible.References
1. Cramer SP, Simonsen H, Frederiksen JL, Rostrup E, Larsson HBW: Abnormal blood-brain barrier permeability in normal appearing white matter in multiple sclerosis investigated by MRI. NeuroImage Clin 2014; 4:182–189.
2. Cramer SP, Modvig S, Simonsen HJ, Frederiksen JL, Larsson HBW: Permeability of the blood – brain barrier predicts conversion from optic neuritis to multiple sclerosis. Brain 2015:1–13.
3. Larsson HBW, Courivaud F, Rostrup E, Hansen AE. Measurement of brain perfusion, blood volume, and blood-brain barrier permeability, using dynamic contrast-enhanced T1-weighted MRI at 3 tesla. Magn. Reson. Med. 2009;62:1270–1281.
4. Cramer SP, Larsson HBW. Accurate determination of blood-brain barrier permeability using dynamic contrast-enhanced T1-weighted MRI: a simulation and in vivo study on healthy subjects and multiple sclerosis patients. [Internet]. J. Cereb. Blood Flow Metab. 2014;(14588):1–11
Figures