4934
MR susceptometry based superior sagittal sinus venous oxygen saturation: effects of carbon dioxide based cerebral vascular reserve and anesthesia in Moyamoya patientsChou-Ming Cheng1,2, Tzu-Chen Yeh3,4, Jen-Chuen Hsieh2,4, and Hsiao-Wen Chung1
1Graduate Institute of Biomedical Electronics and Bioinformatics, National Taiwan University, Taipei, Taiwan, 2Department of Medical Research, Taipei Veterans General Hospital, Taipei, Taiwan, 3Department of Radiology, Taipei Veterans General Hospital, Taipei, Taiwan, 4Institute of Brain Science, National Yang-Ming University, Taipei, Taiwan
Synopsis
Venous oxygen saturation (SvO2) is measured on Moyamoya patients with previous proposed automatic methods based on MR susceptometry from the phase information obtained with multi-echo gradient-echo imaging. According to anesthesia condition and carbon dioxide based cerebral vascular reserve (CO2-CVR) using blood oxygen level dependence (BOLD) technique, 21 Moyamoya patients are classified into four groups. Results from them suggested that global SvO2 value may indicate global pathophysiological change supported by reduced SvO2 without obviously impaired CO2-CVR and elevated SvO2 under anesthesia.
Purpose
Moyamoya disease is generally referred to as the development of collateral circulation to compensate blood supply in response to prior vascular stenosis. The cerebral metabolic changes and cerebrovascular reactivity (CVR) upon environmental challenge in Moyamoya patients, however, are largely unknown. Modern MR imaging techniques provide noninvasive means to estimate the global venous oxygen saturation (SvO2) via phase measurements in the superior sagittal sinus (SSS) 1 and CVR based on blood oxygen level dependent (BOLD) imaging under carbon dioxide stimulation (CO2-CVR) 2. Therefore in this research, a fully automatic SSS SvO2 quantification 3 is applied on 21 Moyamoya patients with and without anesthesia to investigate their anesthesia condition and the relationship between SvO2 and CO2-CVR.Materials and Methods
The MRI experiments were performed on a 3T system with an 8-channel head coil. Twenty one Moyamoya patients (5 males and 16 females, age = 30±17), among whom 4 were uncooperative and hence anesthetized with Propofol (all females, age = 9±9) were recruited. SvO2 was estimated using 3D flow compensated multi-echo gradient echo imaging (6 echoes, TR = 31.4 msec, TE = 5.4~27.5 msec, matrix= 512×512×30, voxel size = 0.45×0.45×3 mm3). The region of interest (ROI) corresponding to SSS (Fig. 1a) parallel to the main magnetic field was segmented automatically 3, whose phase value relative to bilateral parenchyma (diamond shape; Fig. 1a) was used to derive SSS SvO2 using literature formulas 1. For CO2-CVR, 1-5% CO2 was automatically delivered to the subjects during whole-brain BOLD EPI experiments (TR/TE= 2000/30 msec, voxel size =3.6×3.6×4 mm3 and NR=360) using a custom-designed system, with end-tidal CO2 (etCO2) recorded simultaneously. Independent component analysis (Informax) was applied to obtain the cerebrovascular response function as that showing correlation coefficient > 0.3 between the BOLD signal and etCO2 after standard preprocessing of the EPI data by SPM8 4, which was then utilized for mapping whole-brain CO2-CVR via one-sample t-test. The t value from both of the bilateral hemispheres (Fig. 1b) in the normalized space was averaged for CO2-CVR quantification. Impaired CO2-CVR was defined as mean t value shown on the CO2-CVR map lower than 5.0 and 5.4 (derived from mean and one standard deviation of reference CVR t map) for right and left hemispheres, respectively. These reference values (8.4±3.4 and 8.6±3.2 for right and left CVR t map, respectively) were previously obtained separately from another 61 subjects (30 males and 31 females, age= 27±3). Statistical significance was inferred with two-tailed and two sample t test.Results
Based on CO2-CVR values obtained from the BOLD experiments, the Moyamoya patients were divided into four groups. SvO2 values for patients with bilaterally impaired CO2-CVR (patients #1~#6; Fig. 1c) and unilaterally impaired CO2-CVR (patients #7~#12; Fig.1d) were 74.3±6.1% and 80.0±5.2%, respectively. On the other hand, Moyamoya patients without showing obviously impaired CO2-CVR (patients #13~#17; Fig.1e) had significantly lower (72.9±3.2%, p=0.01) SvO2, and the four patients under anesthesia (patients #18~#21; Fig.1f) showed significantly higher SvO2 (86.8±4.3%, p=0.02) than the healthy subjects (78.3±4.6%)(Figure 2).Discussion
The increased SvO2 observed from our patients with anesthesia supports the hypothesis of decreased oxygen consumption, which may arise due to suppressed brain metabolism during Propofol anesthesia. On the other hand, the decreased SvO2 found in Moyamoya patients with no obviously impaired CO2-CVR may imply possible mismatch between the oxygen supplies from the upstream stenotic vessels and the consumption of oxygen in the whole brain. Although limited number of patients included in this preliminary study precludes conclusive remarks to be made, our work may shed light in the evaluation of the cerebrovascular metabolism under various pathophysiological conditions. Future investigations on SvO2 changes in longitudinal studies are needed to improve our understanding of the relationship between CO2-CVR and global SvO2.Conclusion
MR imaging allows noninvasive assessment of global SSS SvO2 and CO2-CVR, both of which are vital toward the understanding of cerebrovascular metabolism.Acknowledgements
No acknowledgement found.References
- Wehrli et al., NMR in Biomedicine 2017; 30:e3495;
- Sam et al., BMJ Open 2015; 5:e006014
- Cheng et al., ISMRM, 2017; 4734;
- Cheng et al., ISMRM, 2014; 4782.
Figures
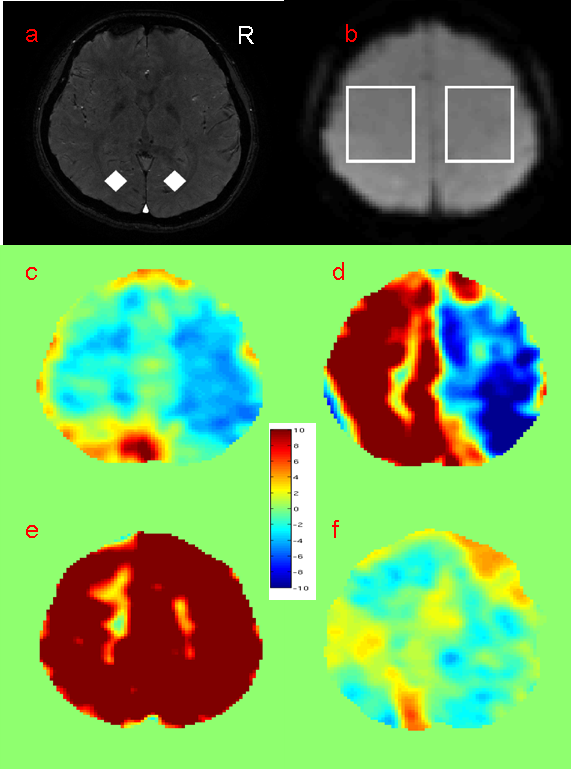
Figure
1 (a) SSS and bilateral
parenchyma ROIs for SvO2 measurement on 11th slice of partial brain
multi-echo gradient images were shown as white region and diamonds,
respectively. (b) Bilateral ROIs on 60th slice of normalized
gradient echo image shown as white squares for quantification to CVR t map of patients
with (c) bilaterally, (d) unilaterally, (e) no obviously impaired CO2-CVR and (f) anesthesia.
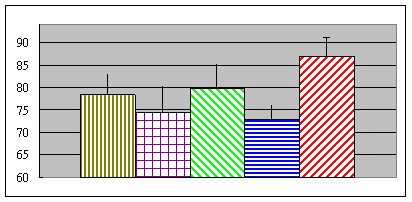
Figure
2 SvO2
of healthy subjects, patients with bilaterally, unilaterally,
no obviously impaired CO2-CVR
and anesthesia was shown in yellow,
purple, green, blue and red, respectively.