4931
Aortic flow and cerebral hemodynamics in age-related brain volume loss1Department of Radiology, Northwestern University, Chicago, IL, United States, 2Department of Computer Science, University of Illinois at Chicago, Chicago, IL, United States
Synopsis
Concurrent cardiac and neurovascular (4D flow) MR imaging were used to quantify cardiac and cerebral hemodynamics in 30 healthy adults to determine the relationship to brain volumetric measures of regions considered vulnerable in aging. Cardiac index (p=0.001); ascending aorta (p=0.003) total cerebral blood flow (p=0.001) and flow for left internal carotid (p<0.001), basilar (p=0.04), and right anterior cerebral (p=0.03) arteries were significantly lower in midlife compared to younger adults. Lower cardiac index, total cerebral blood flow and left internal carotid flow were correlated with reduced gray matter, superior frontal cortical thinning and volume loss in putamen.
Introduction
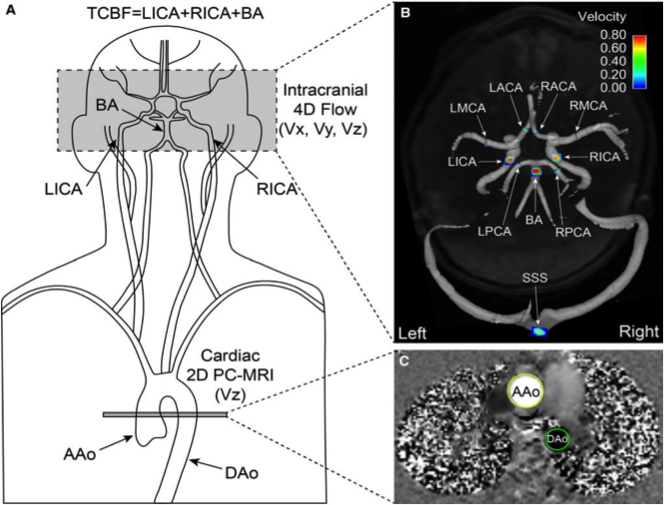
The adult brain undergoes variable loss of volume with aging. The supply of blood to the brain is dependent on cardiac output, which declines with age. [1, 2] How age-related decline in aortic blood flow to the brain, in total cerebral arterial inflow and flow distribution to individual territories relate to brain atrophy and region-specific volume loss are not well understood. This investigation used concurrent cardiac (2D time-resolved (CINE) phase contrast) and neurovascular (k-t accelerated dual-velocity encoded 4D flow) MR imaging to quantify cardiac output, ascending aortic flow, total cerebral blood flow and cerebral hemodynamics in healthy adults. Flow measurements were compared in young and midlife age groups. Relationships with brain volumetric measurements were determined, with particular focus on regions considered vulnerable in normal aging and in age-related neurological disorders. [3]Methods
The study included 30 healthy adults (mean age: 37.9±15.0; range: 19.2– 60.7; 15 males and 15 females) who were screened for vascular medical history. Exclusion criteria: BSA > 35 kg/m2, blood pressure > 160/ 90 mm Hg; history of stroke, diabetes, cancer, liver disease, kidney disease, heart or brain surgery, arrhythmia, smoking or drug abuse. The study was IRB approved and conducted in compliance with HIPAA; informed consent was obtained from all participants. Brain volumetric measures were determined using T1 weighted MPRAGE (TR: 1900 ms, TE: 2.5 ms, FOV (180–250) x (224–250) mm2, voxel size 1.0 x 1.0 x 1.0 mm3, flip angle= 9°). Standardized quality assurance and automated pipelines based on the well-validated Freesurfer analysis tools (http://surfer.nmr.mgh.harvard.edu/) were used for brain volumetric measurements, normalized for head size. 4D flow MRI was performed with 3D volumetric coverage of major cerebral vessels (Figure 1) and 3-directional velocity encoding; parameters: TR: 5.2 - 5.6 ms, TE: 2.8 - 3.2 ms, flip angle: 15° , velocity sensitivity 80 cm/s, FOV (140– 160) x (180– 220) mm2 , temporal resolution: 41.6 – 44.8 ms, voxel size (1.1 – 1.2) x (1.1 – 1.2) x (1.2 – 1.4) mm3. Data acquisition was synchronized with prospective ECG gating. During the same session, 2D Cine PC-MRI was acquired with through-plane velocity encoding (Vz) at level of proximal ascending and descending aorta (Figure 1) (free breathing, 2-4 averages, venc 150 cm/s. 4D flow data were corrected for background noise, phase offset errors and velocity aliasing using custom Matlab tools (MathWorks) and imported into commercial software (EnSight; CEI) for individual vascular flow quantification. Figure 1 presents further information for aortic and cerebral flow quantification, which have also been detailed elsewhere [4, 5]. Cardiac index was calculated using the standard equation. [6]Results
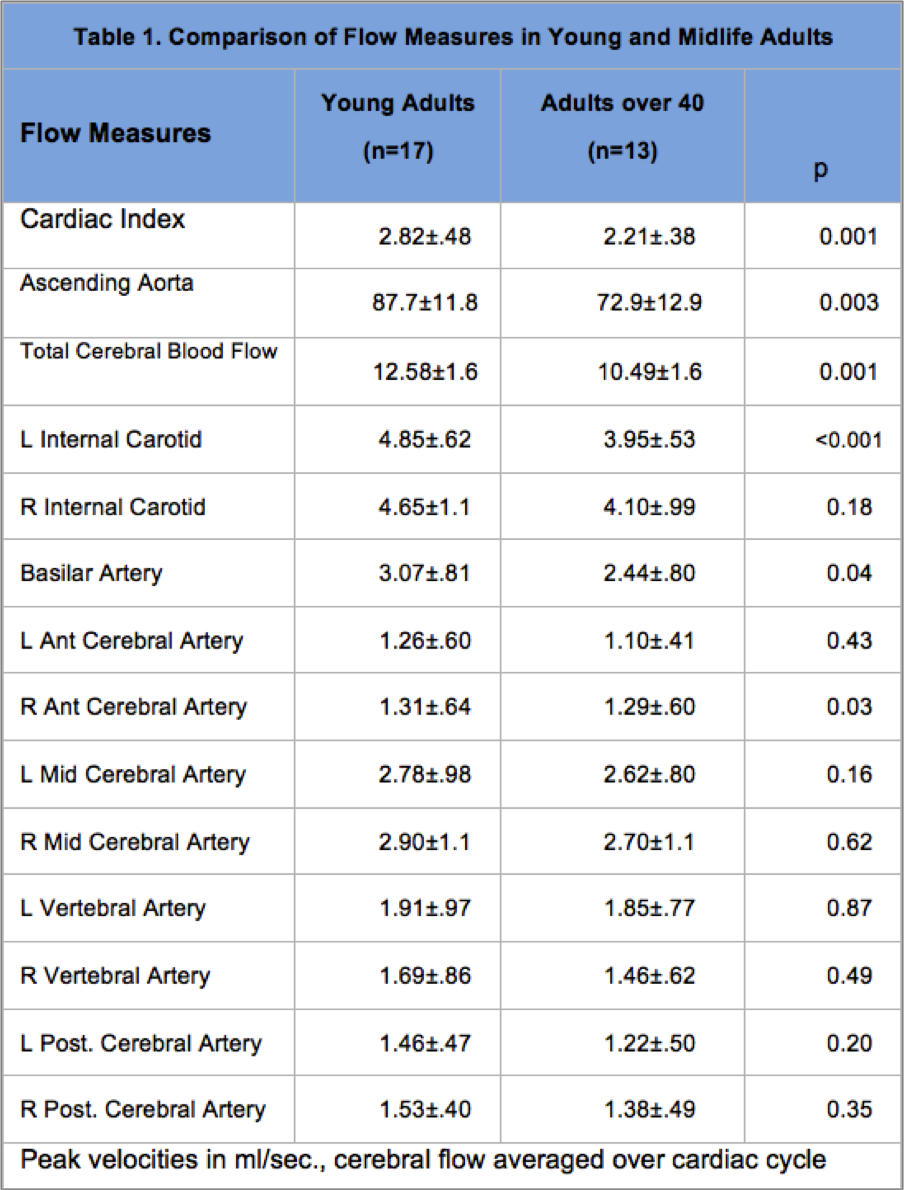
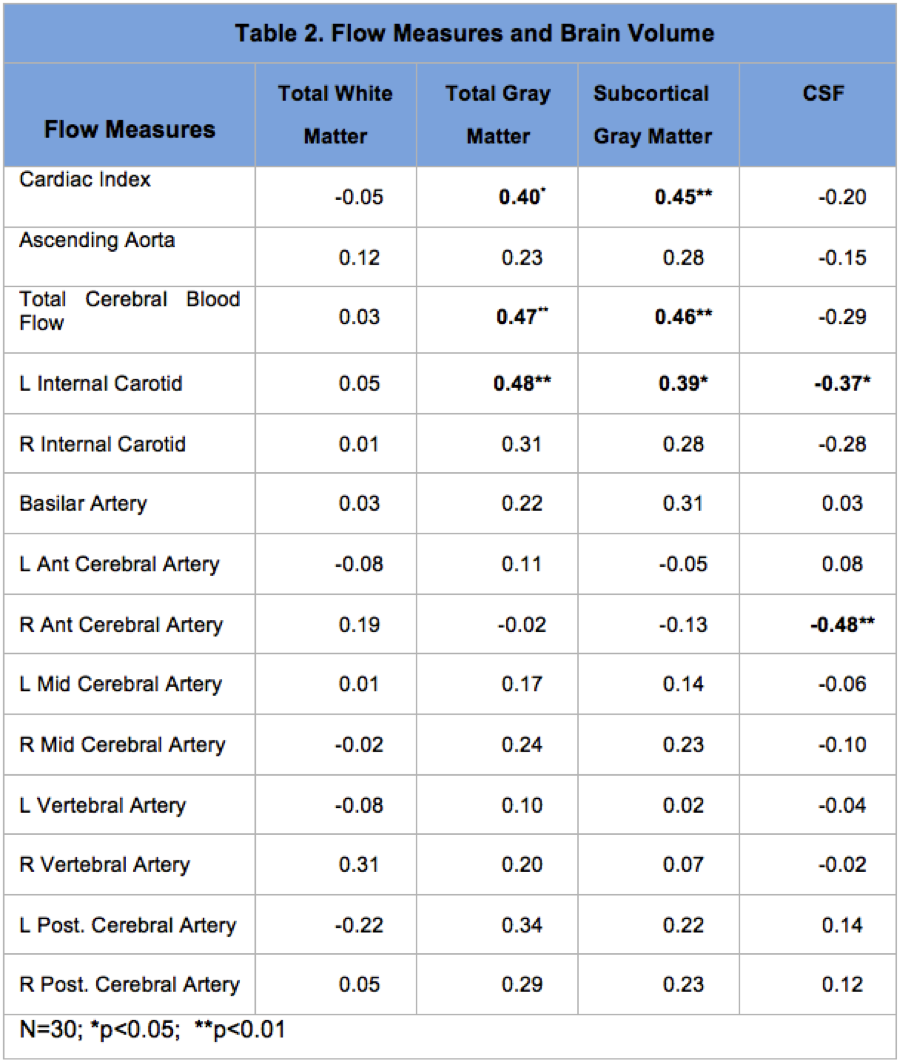
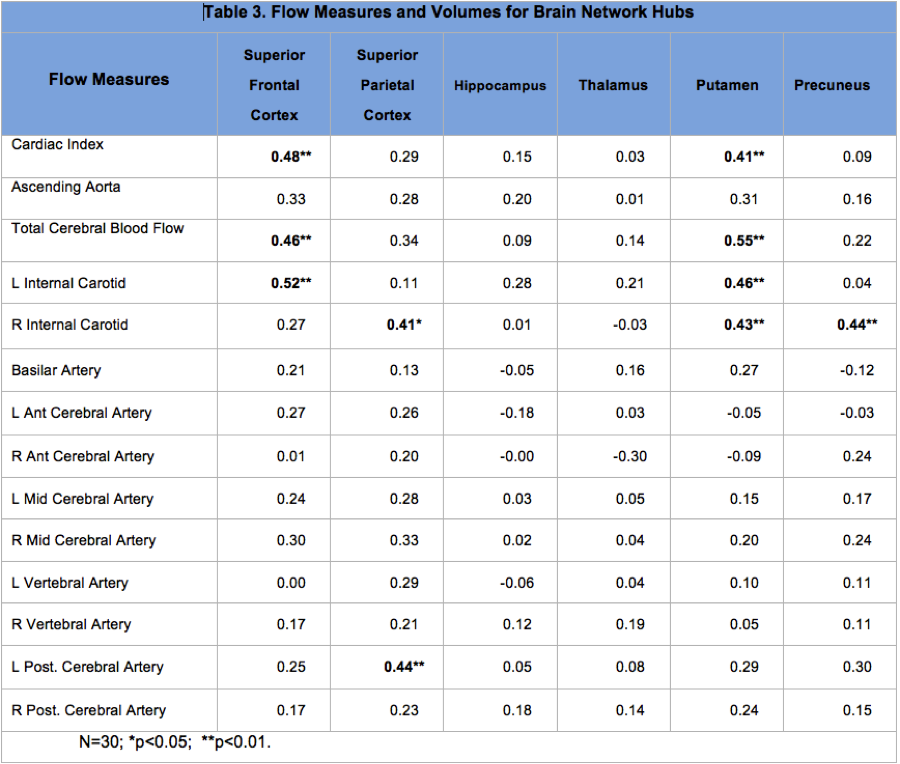
Flow measures were compared in young (19-40 years: mean: 26.1±5.6) and midlife (>40 years; mean: 53.4±6.7) adult groups using t-tests. Cardiac index (p=0.001); ascending aorta (p=0.003) total cerebral blood flow (p=0.001) and flow measures for left internal carotid (p<0.001), basilar (p=0.04), and right anterior cerebral (p=0.03) arteries were significantly lower in the midlife group (Table 1). Pearson correlations with brain volume measures are shown for major tissue classes (Table 2) and for network hubs (Table 3).Discussion
Flow measures were significantly lower for cardiac index, ascending aorta and total cerebral blood in midlife adults. Cerebral flow distribution also differed in this group for left internal carotid, basilar and right anterior cerebral arteries (Table 1). Lower cardiac index, total cerebral blood flow and left internal carotid flow were correlated with reduced gray matter volume (total and subcortical) (Table 2). Further, a consistent pattern of relationship was identified between these flow measures and superior frontal cortical thinning and volume loss in putamen (Table 3). These regions have been identified as brain network hubs [3, 7-10]. Connectome analysis of brain network organization indicates a “rich club” of highly-interconnected hubs, including bilateral superior frontal cortex, superior parietal cortex, hippocampus, thalamus, putamen and precuneus. [7-10] Altered distribution of cerebral flow may have more pronounced effects on network hubs. Network metrics suggest higher biological cost of hubs, consistent with higher metabolic and blood flow demand, and potentially increased vulnerability suggesting that injury may be disproportionately concentrated in hubs in dementia and other neurological disorders [7-10]. Moreover, intact cognition may be critically dependent on hub coactivation [11, 12] and injury to these regions may have more deleterious consequences for cognitive deterioration in aging [3, 13, 14].Conclusion
Taken together, the findings support a role of age-related hemodynamic alterations in brain volume loss and demonstrate the potential utility of 4D MR flow imaging for investigating pathophysiologic mechanisms and for identifying early biomarkers of cognitive decline in brain aging.Acknowledgements
No acknowledgement found.References
1. Brandfonbrener, M., M. Landowne, and N.W. Shock, Changes in cardiac output with age. Circulation, 1955. 12(4): p. 557-66.
2. Carlsson, M., et al., Cardiac output and cardiac index measured with cardiovascular magnetic resonance in healthy subjects, elite athletes and patients with congestive heart failure. J Cardiovasc Magn Reson, 2012. 14: p. 51.
3. van den Heuvel, M.P. and O. Sporns, Network hubs in the human brain. Trends Cogn Sci, 2013. 17(12): p. 683-96.
4. Wu, C., et al., Age-Related Changes of Normal Cerebral and Cardiac Blood Flow in Children and Adults Aged 7 Months to 61 Years. J Am Heart Assoc, 2016. 5(1).
5. Markl, M., et al., 4D flow MRI. J Magn Reson Imaging, 2012. 36(5): p. 1015-36.
6. Mosteller, R.D., Simplified calculation of body-surface area. N Engl J Med, 1987. 317(17): p. 1098.
7. Guimera, R. and L.A. Amaral, Cartography of complex networks: modules and universal roles. J Stat Mech, 2005. 2005(P02001): p. nihpa35573.
8. Guimera, R. and L.A. Nunes Amaral, Functional cartography of complex metabolic networks. Nature, 2005. 433(7028): p. 895-900.
9. Zamora-Lopez, G., C. Zhou, and J. Kurths, Cortical hubs form a module for multisensory integration on top of the hierarchy of cortical networks. Front Neuroinform, 2010. 4: p. 1.
10. van den Heuvel, M.P. and O. Sporns, Rich-club organization of the human connectome. J Neurosci, 2011. 31(44): p. 15775-86.
11. van den Heuvel, M.P., et al., High-cost, high-capacity backbone for global brain communication. Proc Natl Acad Sci U S A, 2012. 109(28): p. 11372-7.
12. Crossley, N.A., et al., Cognitive relevance of the community structure of the human brain functional coactivation network. Proc Natl Acad Sci U S A, 2013. 110(28): p. 11583-8.
13. Senden, M., et al., Rich club organization supports a diverse set of functional network configurations. Neuroimage, 2014. 96: p. 174-82.
14. Crossley, N.A., et al., The hubs of the human connectome are generally implicated in the anatomy of brain disorders. Brain, 2014. 137(Pt 8): p. 2382-95.
Figures