4930
Cerebral Blood Flow, Intracranial Volumes and Cognitive Status in Type-2 Diabetes Mellitus1Academic Units of Radiology & Diabetes, University of Sheffield, Sheffield, United Kingdom, 2Diabetes, Sheffield Teaching Hospitals, Sheffield, United Kingdom
Synopsis
This study quantitates regional brain volumes and arterial cerebral perfusion characteristics (ASL) in patients with Type-2 Diabetes Mellitus (T2DM) who have Mild Cognitive Impairment, in patients with T2DM who have normal cognitive status and in non-diabetic healthy volunteers. Mean group differences were identified in both grey matter volume and cerebral blood flow in regions that include the medial temporal lobes. These findings may further our understanding of the mechanisms that lead to an increased risk of the development of cognitive impairment associated with diabetes.
Introduction
Type-2 Diabetes Mellitus (T2DM) is a worldwide pandemic. In addition to various multiple organ co-morbidities, it has been reported that T2DM increases the risk of the development of neurodegenerative mild cognitive impairment (MCI)1. Brain structural/anatomical changes have been associated with MCI but Cerebral Blood Flow (CBF) changes have not been fully explored in this context. This study investigates abnormalities in regional CBF via MR perfusion and brain volumes via tissue classification in order to examine how arterial blood distribution and parenchymal atrophy may relate to clinical markers of cognitive function in patients with T2DM who have MCI.Methods
Seventy-six age and gender matched subjects [n=30 with T2DM who had normal cognition (T2DM); n=17 with T2DM who had MCI (T2DM/MCI) and n=29 healthy volunteers without diabetes (HV)] were recruited. All subjects underwent detailed history, clinical and questionnaire assessments. Cognitive status was assessed using the established Addenbrooke’s Cognitive Examination [ACE-R]2. All subjects underwent MR examination at 3T (Ingenia 3.0T, Philips Healthcare, Best, The Netherlands). The MR protocol comprised both brain and cardiac quantitative imaging. Brain imaging (32 channel receive-only RF head coil) included pseudo Continuous Arterial Spin Labelling3 (pCASL) [73 dynamics; 2D GE-EPI; TR=4000ms; TE=15ms; post-label delay=1525ms; 17 axial slices; slice thickness 7mm, pixel recon size=3x3mm2] and whole-head, 3-dimensional, T1-weighted Magnetisation Prepared-Rapid Acquisition Gradient Echo (MPRAGE) [TR=8.2ms; TE=3.8ms; TI=1000ms; voxel size 1x1x1 mm3] acquisitions. The ASL data was modelled to yield quantitative arterial CBF maps (NordicICE, NordicNeuroLab, Bergen, Norway) and quantitative CBF extracted via Region of Interest (ROI) analysis. Volumetric anatomical data were analysed using FSL (www.fmrib.ox.ac.uk/fsl) via SienaX / VBM.Results
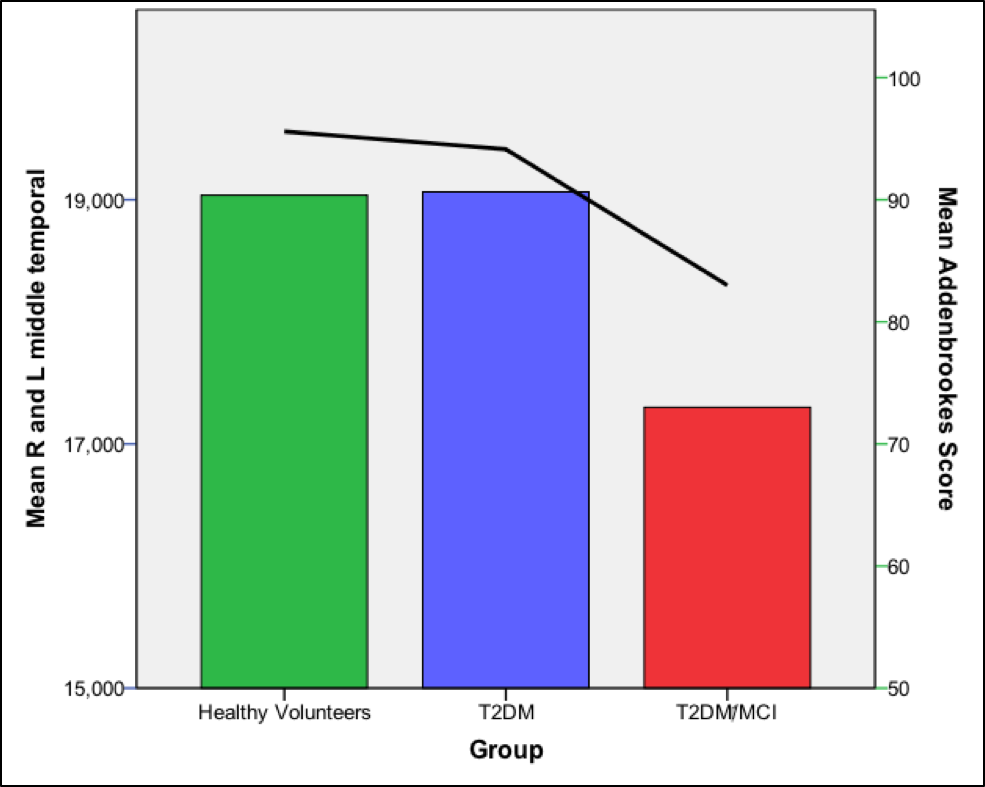
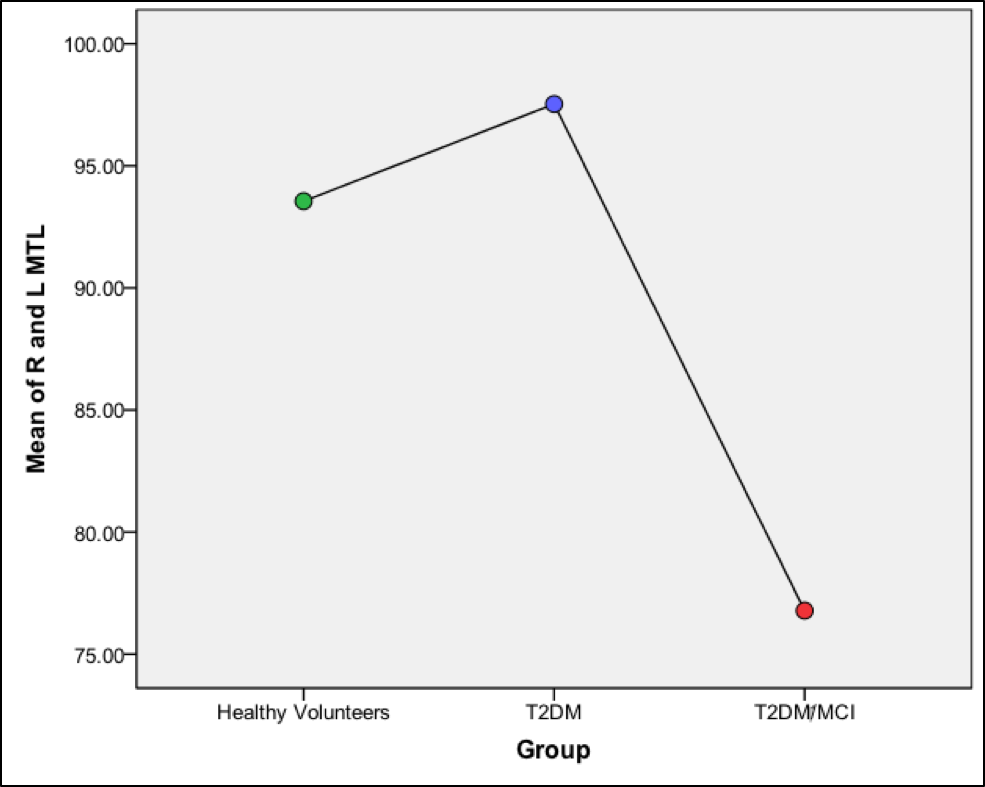
As expected, group mean T2DM/MCI ACE-R score (mean+SD; 83±4) was significantly lower compared to other groups (HV=96±2, T2DM=94±3; ANOVA, p<0.001) [Figure 1]. There was significantly lower mean CBF in T2DM/MCI compared to T2DM and HV groups in the medial temporal lobes (CBF 76.8 ml/100g/min (ANOVA p<0.05) [Figure 2]), insula, (CBF 67.5 ml/100g/min ANOVA p<0.005) frontal lobes (CBF 71.8 ml/100g/min ANOVA p<0.005) and the thalamus (CBF 75.9 ml/100g/min, ANOVA, p< = 0.05). Pearson’s correlation revealed a significant correlation with the ACE-R score in three areas of the CBF measurements (medial temporal lobes, p<0.05, thalamus, p<0.05, and the insula, p<0.05). The T2DM/MCI group had significantly lower regional grey matter volumes compared to HV in the left and right hippocampi (X=59, Y=54, Z=34 [p<0.0005], X=31, Y=57, Z=25 [p<0.05] respectively) [Figure 1], left putamen (X=56, Y=67, X=34, p<0.05), left caudate (X=51, Y=71, X=38, p<0.05) and left amygdala (X=57, Y=61, Z=33, p<0.05). There were no brain regions that were significantly lower in group mean volume when comparing the HV group to those of the T2DM/MCI group or between the T2DM and T2DM/MCI groups.Discussion and Conclusions
This study demonstrates significantly lower regional mean CBF and grey matter volume in subjects who have T2DM and Mild Cognitive Impairment. Since these data are cross-sectional with appropriate disease and healthy control groups, it is reasonable to assume the presence of a localised atrophic processes in the MCI group. Longitudinal studies are needed to ascertain the nature and rate of potential development of an atrophic process. In addition to this, relative changes in arterial perfusion may provide clues as to the mechanistic nature of the processes that correlate with cognitive functional decline. This concurrent multi-submodal information may be crucial to our understanding of the pathological mechanisms behind the increased risk of cognitive impairment associated with diabetes.Acknowledgements
This work was supported by The Garfield Weston Foundation, The Wellcome Trust and the NIHR-Sheffield Biomedical Research Centre (Neuroscience).References
1. Biessels, G. J., Staekenborg, S., Brunner, E., Brayne, C. & Scheltens, P. 2006. Risk of dementia in diabetes mellitus: a systematic review. Lancet Neurology 2005, 5, 64-74.
2. Mioshi, E., Dawson, K., Mitchell, J., Arnold, R., Hodges, J.R. The Addenbrooke’s Cognitive Examination Revised (ACE-R): a brief cognitive test battery for dementia screening. Int J Geriatr Psychiatry 2006; 21: 1078–1085.
3. Alsop DC, Detre JA, Golay X, Günther M, Hendrikse J, Hernandez-Garcia L, Lu H, MacIntosh BJ, Parkes LM, Smits M, van Osch MJ, Wang DJ, Wong EC, Zaharchuk G. Recommended implementation of arterial spin-labeled perfusion MRI for clinical applications: A consensus of the ISMRM perfusion study group and the European consortium for ASL in dementia. Magn Reson Med. 2015; 73(1):102-16.
Figures