4929
Age-related shift of cerebral venous outflow pathway detected by BOLD signal-based blood flow tracking1Department of Psychiatry, Kyoto University Graduate School of Medicine, Kyoto, Japan, 2Human Brain Research Center, Kyoto University Graduate School of Medicine, Kyoto, Japan, 3Center for the Promotion of Interdisciplinary Education and Research, Kyoto University, Kyoto, Japan
Synopsis
A novel blood tracking technique based on BOLD MRI signal was applied to two age groups of healthy subjects (n=81) to investigate age-related alterations in cerebral circulation. By mapping the phase of low-frequency component and between-subject regression analysis on this “BOLD lag map”, linear extension of venous drainage times with age was found in the deep venous system draining the periventricular region. Interestingly, age-related shortening of washout time was observed in the superficial system involving the major sinuses. This dissociation of deep and superficial venous systems may reflect focal inefficiency in the deep system as part of normal aging processes.
Introduction
Many studies have demonstrated decreasing regional cerebral blood flow (CBF) in the course of aging 1,2, but little is known about the change in venous drainage pattern that can directly affect the CBF 3. In the present study, by mapping the phase of a low-frequency oscillation of systemic origin (sLFO) in the blood oxygenation level-dependent (BOLD) signal time-series 4, we sought to investigate such age-related alterations of brain perfusion. This technique has been proposed as a clinically useful biomarker 5–8 and confirmed to reflect blood flow with high sensitivity to the venous part of the circulation 9–11.Methods
Eighty-one healthy volunteers divided into young (n=49; median age, 22 years) and elderly (n=32; median age, 67 years) groups underwent resting-state BOLD EPI using a 3T whole-body MRI system equipped with a 32-channel array coil. The acquisition parameters were: field of view = 212 mm; matrix = 64 × 64; 40 slices; slice thickness = 3.2 mm with a 25% gap; repetition time = 2500 ms; echo time = 30 ms; and flip angle = 80°. A 10-min scan (242 volumes) was acquired.
Off-resonance geometric distortions were corrected using FUGUE/FSL5 with B0 filed maps. After inter-scan slice timing correction, head motion was compensated for in two steps: data scrubbing 12 followed by 3D realignment. Images were spatially normalized and resliced to a 4-mm isotropic voxel. Temporal band-pass filtering at 0.008–0.07 Hz was applied before lag mapping to ensure that the phase was uniquely determined within the cross-correlation range of 14 s.
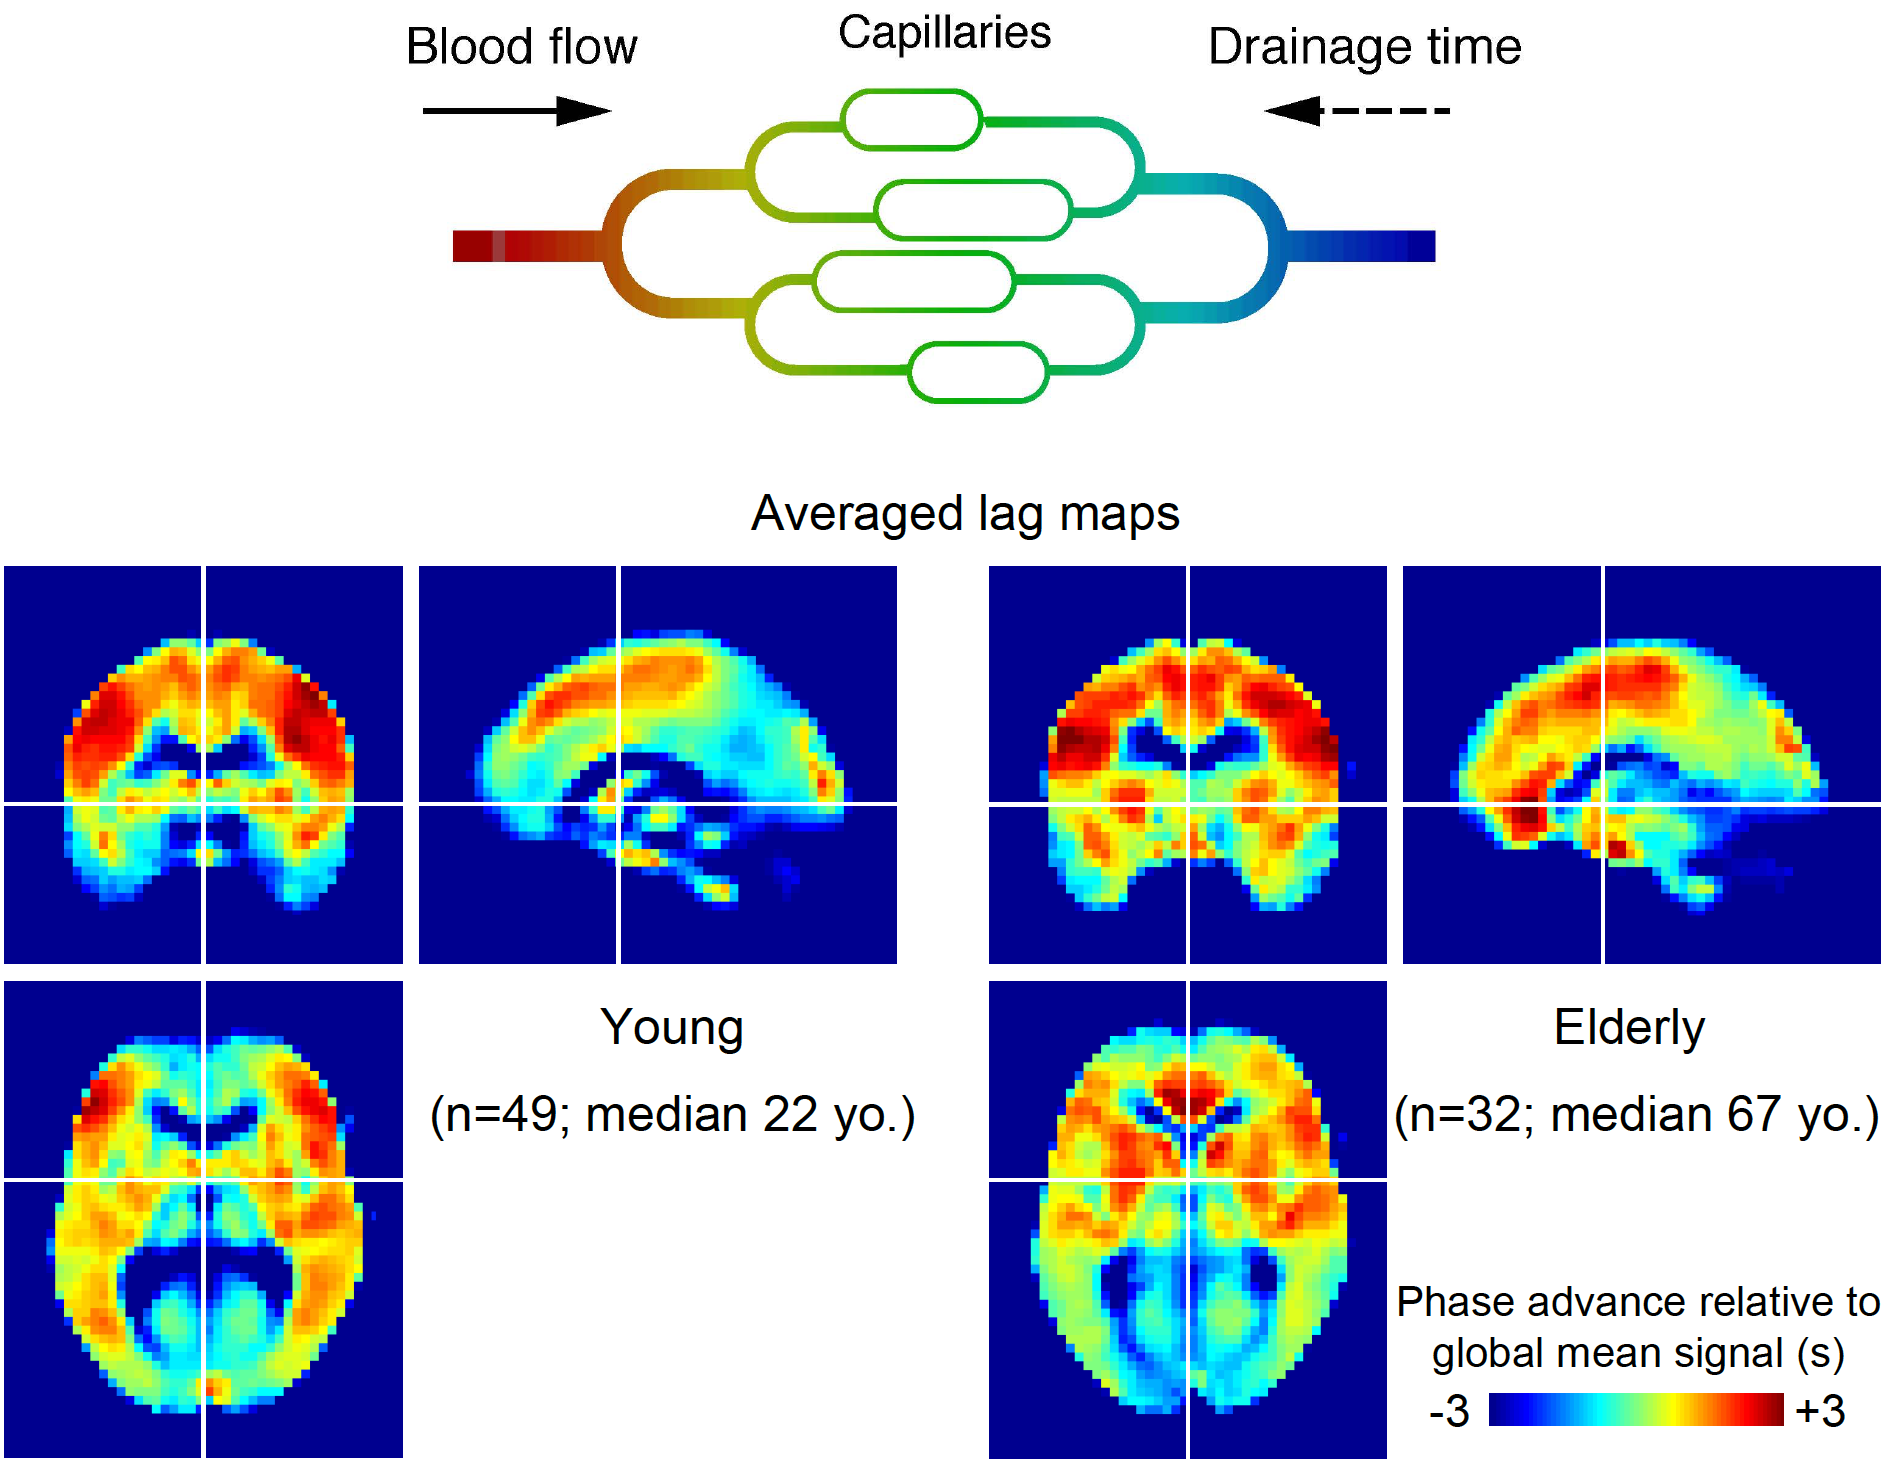
Following a previously reported methodology 5-8,11,13, simple seed-based lag mapping with the global mean signal reference was used. See Figure 1 for schematic of the analysis model and averaged lag maps. The lag map assumed discrete values between −7 s and +7 s at an interval of 0.5 s, in which positive values were assigned to the upstream (i.e., arterial side of the circulation) voxels 13. The resulting map hence represents relative drainage time in each voxel.
To evaluate alterations in the lag map with age, a voxel-by-voxel regression analysis was performed. All lag maps from the 81 control subjects were entered into one model with two factors of interest: age and sex. A height threshold of p<0.001 was set, uncorrected for the multiple comparisons, but discarding the small clusters which approximately corresponded to a cluster-level threshold of p<0.05, corrected for multiple comparisons.
Results
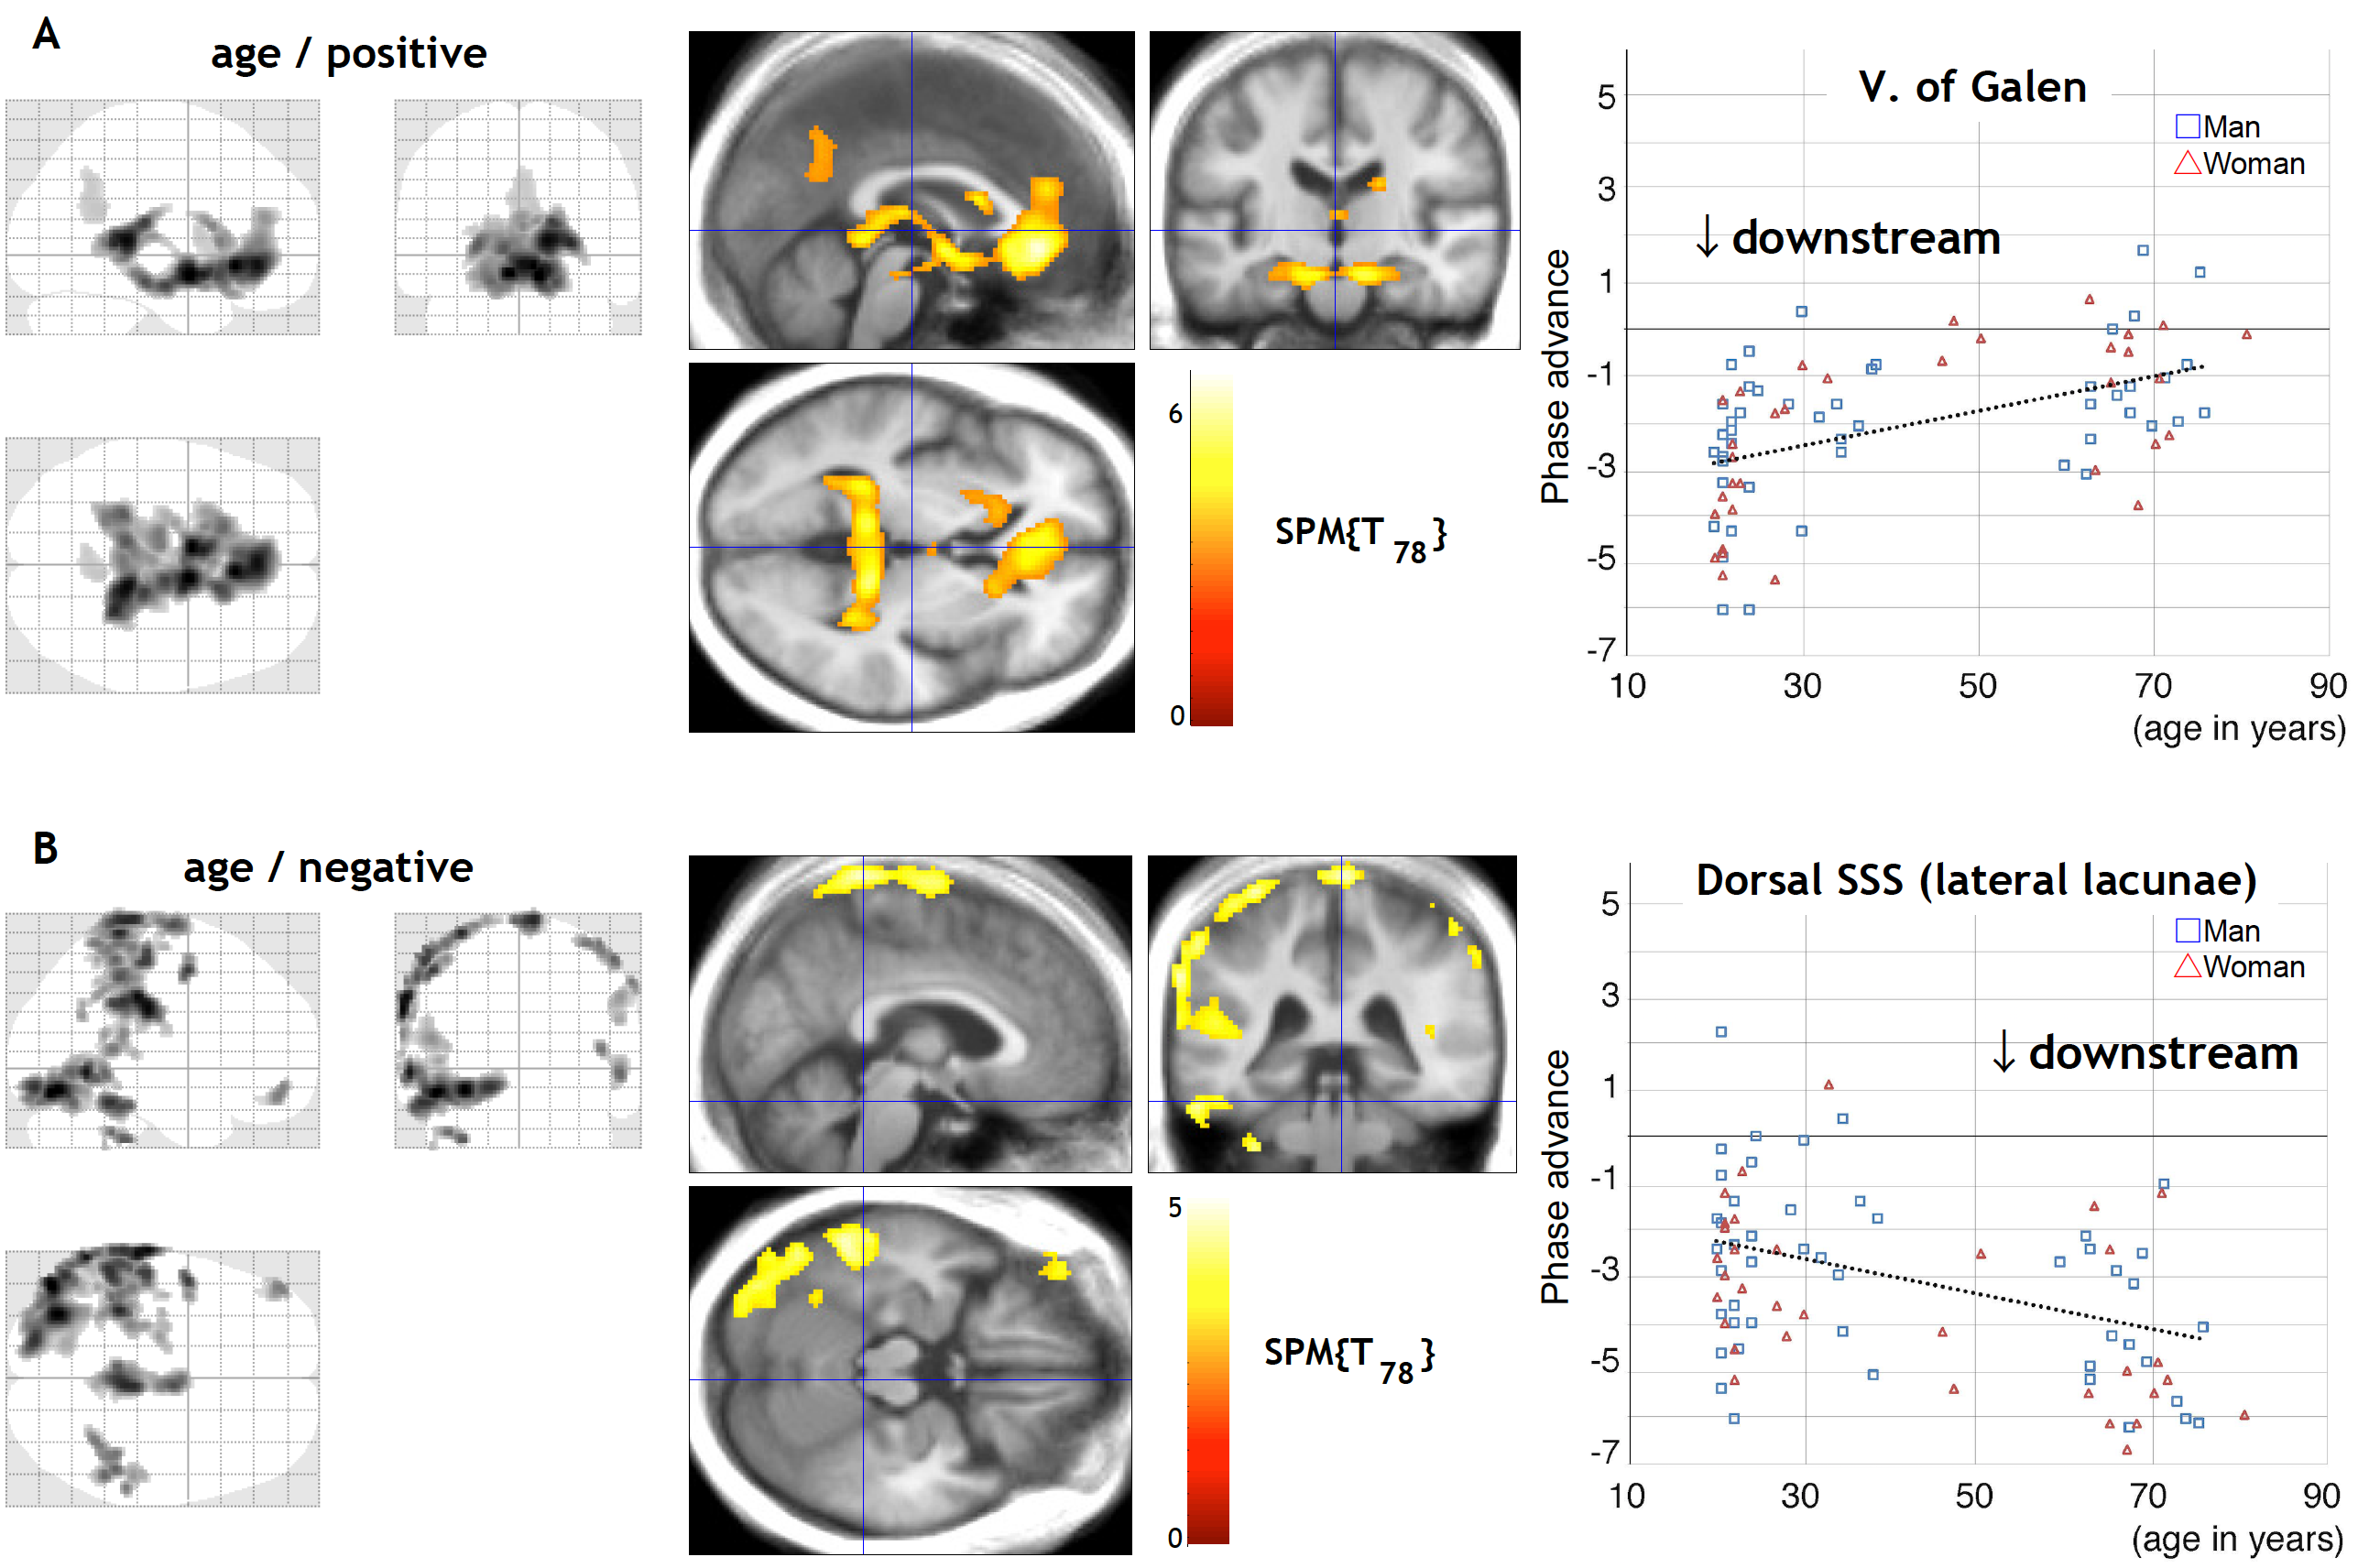
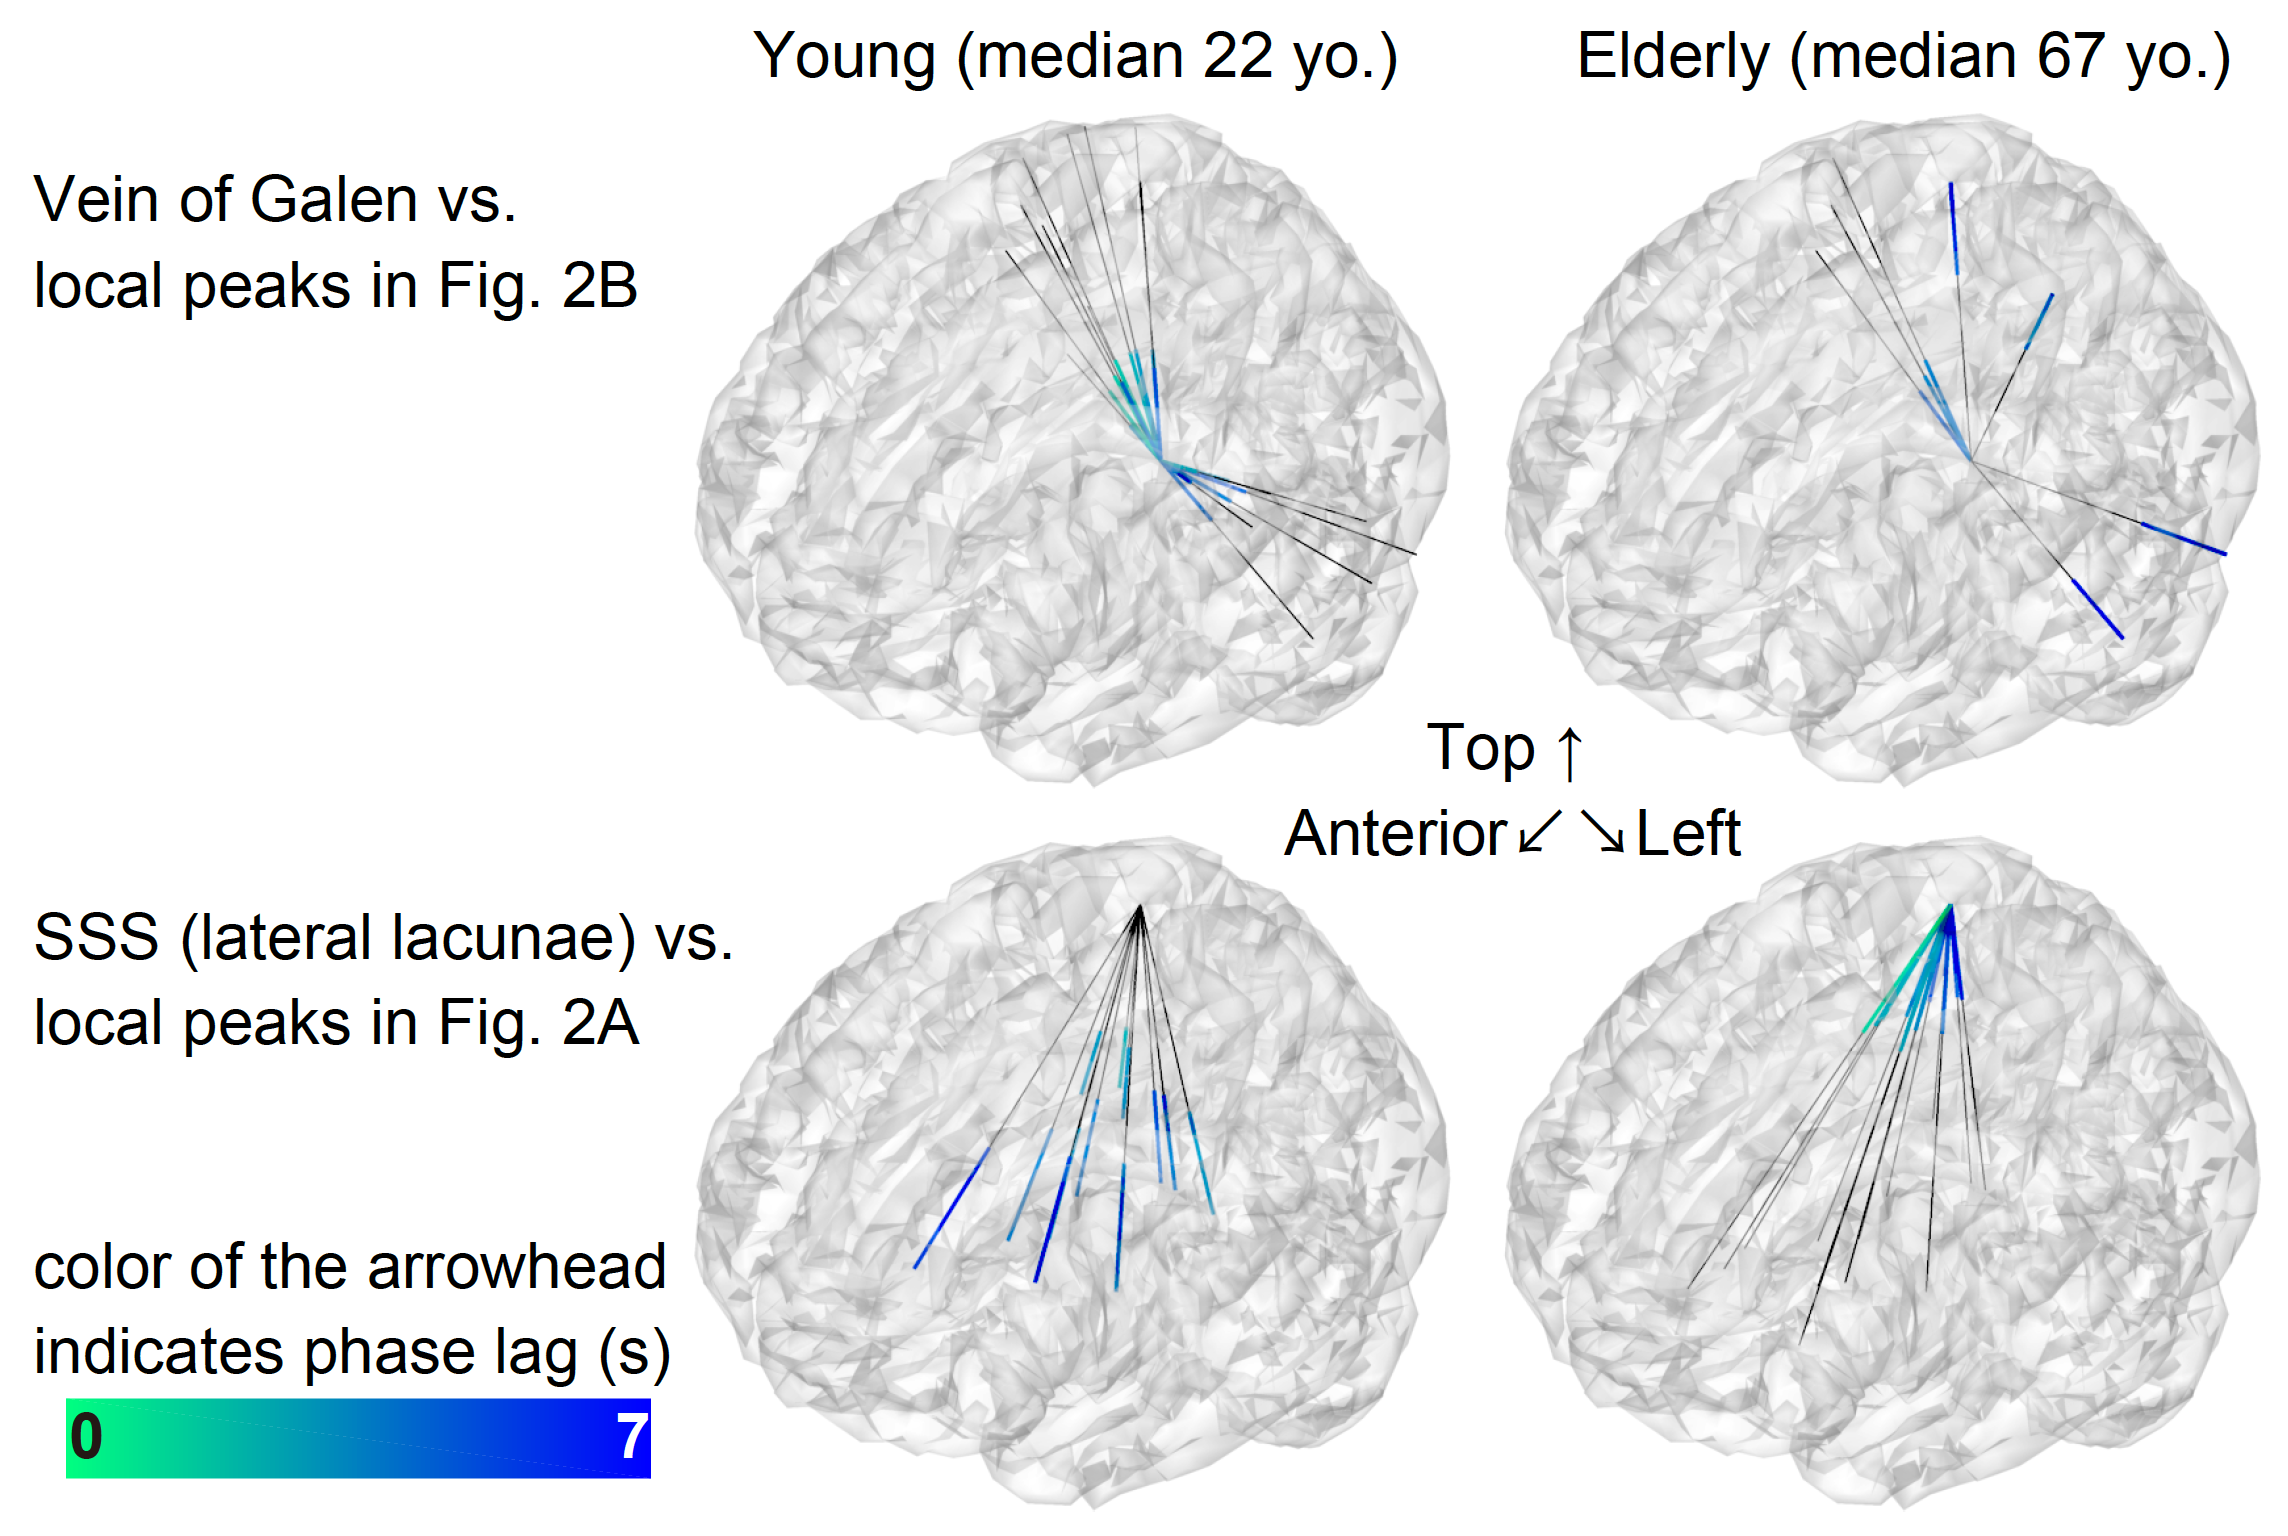
As shown in Figure 2, the regions with extended drainage times according to age were symmetrically distributed along the deep venous system, including the vein of Galen. In contrast, clusters with shortened drainage time with aging were distributed along the superficial venous system, peaking at the uppermost part of the superior sagittal sinus (SSS). The lag map phase in each of these regions was extracted for comparison (Right panel). The local statistical peak in the vein of Galen exhibited an upstream shift by approximately 2 s, while the opposite pattern was observed in the SSS peak. The within-subject phase difference, which should reflect the hierarchical relationship between these two peaks, was not detected in the younger group (P=0.52 [two-tailed paired t test]), but was significant in the elderly group by 3.2 s (P <10-7). The phase difference analysis was further performed on every pair of regions representing the two systems (Fig. 3).Discussion
Prolonged drainage time is found selectively in the deep venous system. This effect of aging cannot be accounted for by cerebral atrophy because simple dilation of the ventricles should result in extension of the periventricular regions, which contradicts the present observation. Erosion of the clusters into the ventricles may be due to magnetic field inhomogeneity in the perivascular CSF space, causing T2* signal cancellation 14. This finding would, therefore, reflect a change in the cerebral venous systems during the normal course of aging.Conclusion
The present results suggest that in the elderly, the superficial system moves downstream to serve as the venous outlet because the deep system is not as efficient as it was in the earlier stages of life. Moreover, the superficial clusters in Fig. 2B coincide with the location of the anastomotic veins of Trolard connecting the transverse sinus and the SSS, suggesting involvement of distant collateral pathways. There are lines of evidence regarding age-related stenosis or occlusion of the periventricular vasculature that may be relatable 15,16. Furthermore, the deep cluster in our result coincides with the regional CBF decrease with aging reported previously 1,2. The venous insufficiency or congestion in this region might have causal relationship with a variety of age-associated physiological and pathological phenomena.Acknowledgements
No acknowledgement found.References
1 Martin AJ, Friston KJ, Colebatch JG, Frackowiak RSJ. Decreases in Regional Cerebral Blood Flow with Normal Aging. J Cereb Blood Flow Metab 1991; 11: 684–689.
2 Chen JJ, Rosas HD, Salat DH. Age-associated reductions in cerebral blood flow are independent from regional atrophy. Neuroimage 2011; 55: 468–478.
3 Andeweg J. The anatomy of collateral venous flow from the brain and its value in aetiological interpretation of intracranial pathology. Neuroradiology 1996; 38: 621–628.
4 Aso T, Urayama S, Fukuyama H. Temporal variation of cerebrovascular transit time measured by BOLD-based time lag mapping. In: Proceedings of the 25rd Annual Meeting of ISMRM. Honolulu, 2017.
5 Amemiya S, Kunimatsu A, Saito N, Ohtomo K. Cerebral Hemodynamic Impairment: Assessment with Resting-State Functional MR Imaging. Radiology 2013; 270: 1–8.
6 Christen T, Jahanian H, Ni WW, Qiu D, Moseley ME, Zaharchuk G. Noncontrast mapping of arterial delay and functional connectivity using resting-state functional MRI: A study in Moyamoya patients. J Magn Reson Imaging 2015; 41: 424–430.
7 Ni L, Li J, Li W, Zhou F, Wang F, Schwarz CG et al. The value of resting-state functional MRI in subacute ischemic stroke: comparison with dynamic susceptibility contrast-enhanced perfusion MRI. Sci Rep 2017; 7: 41586.
8 Lv Y, Margulies DS, Cameron Craddock R, Long X, Winter B, Gierhake D et al. Identifying the perfusion deficit in acute stroke with resting-state functional magnetic resonance imaging. Ann Neurol 2013; 73: 136–140.
9 Tong Y, Frederick B deB. Concurrent fNIRS and fMRI processing allows independent visualization of the propagation of pressure waves and bulk blood flow in the cerebral vasculature. Neuroimage 2012; 61: 1419–27.
10 Tong Y, Frederick B deB. Tracking cerebral blood flow in BOLD fMRI using recursively generated regressors. Hum Brain Mapp 2014; 35: 5471–85.
11 Tong Y, Lindsey KP, Hocke LM, Vitaliano G, Mintzopoulos D, Frederick B deB. Perfusion information extracted from resting state functional magnetic resonance imaging. J Cereb Blood Flow Metab 2017; 37: 564–576.
12 Power JD, Barnes K a., Snyder AZ, Schlaggar BL, Petersen SE. Spurious but systematic correlations in functional connectivity MRI networks arise from subject motion. Neuroimage 2012; 59: 2142–54.
13 Aso T, Jiang G, Urayama S, Fukuyama H. A Resilient, Non-neuronal Source of the Spatiotemporal Lag Structure Detected by BOLD Signal-Based Blood Flow Tracking. Front Neurosci 2017; 11: 256.
14 Cheng Y-CN, Haacke EM. Predicting BOLD signal changes as a function of blood volume fraction and resolution. NMR Biomed 2001; 14: 468–477.
15 Farkas E, de Vos RAI, Donka G, Jansen Steur EN, Mihály A, Luiten PGM. Age-related microvascular degeneration in the human cerebral periventricular white matter. Acta Neuropathol 2006; 111: 150–157.
16 Moody DM, Brown WR, Challa VR, Anderson RL. Periventricular venous collagenosis: association with leukoaraiosis. Radiology 1995; 194: 469–476.
Figures