4928
Impact of focused ultrasound on cerebral blood flow1Grenoble Institut des Neurosciences, INSERM U 1216, Grenoble, France, 2Université Grenoble Alpes, Grenoble, France, 3CNRS UPR4301-CBM, Orleans, France
Synopsis
One major application of FUS is the opening of the blood brain barrier (BBB) to target the brain cells with drugs such as in glioma. While the impact of FUS on brain disease is under intense evaluation, its impact of normal brain physiology has received less attention. In this study, we evaluate the impact of BBB opening using FUS on cerebral blood flow (CBF), assessed by pseudo-continuous arterial spin labeling (ASL). Following 0.6MPa FUS at 1.2Mhz, a small change in ADC was observed, suggesting a small vasogenic edema. In addition, there was a 50%CBF reduction in a large vascular territory.
Introduction
There is a growing interest for focused ultrasound (FUS) in brain studies. One major application of FUS is the opening of the blood brain barrier (BBB) to target the brain cells with drugs such as in glioma (1). While the impact of FUS on brain disease is under intense evaluation, its impact of normal brain physiology has received less attention. In this study, we evaluate the impact of BBB opening using FUS on cerebral blood flow (CBF), assessed by pseudo-continuous arterial spin labeling (ASL).Material and methods
Animals (Sprague-Dawley male rats, 350±25 g) were anesthetized with isoflurane (1.5%) in air. The tail vein was equipped with a catheter. Two groups of animals were considered. In Group 1, rats underwent FUS and were imaged by MRI 30min later: anatomy, diffusion, CBF, injection of Gd to visualize the BBB opening. In Group 2, rats underwent FUS and were imaged by MRI: anatomy, diffusion and CBF were measure 30min, 1h30min, 3h and 24h after FUS.
FUS. Ultrasound was produced by a single element focused transducer @ 1.2MHz and 75mm focal length. Sonication was applied for 60 sec in burst mode with the pulse width of 50ms and the duty cycle of 5%. The negative peak pressure was set to 0.6MPa. FUS targeted the striatum and were applied either to the right or to the left hemisphere.
Anionic microbubbles made of DSPC:DSPE-PEG2000 were used for blood brain barrier opening. They were produced by 45 sec of mechanical shaking in presence of C4F10 gas and were around 2µm in diameter. 100 µL of the microbubbles solution were injected via the tail vein 15 seconds before FUS.
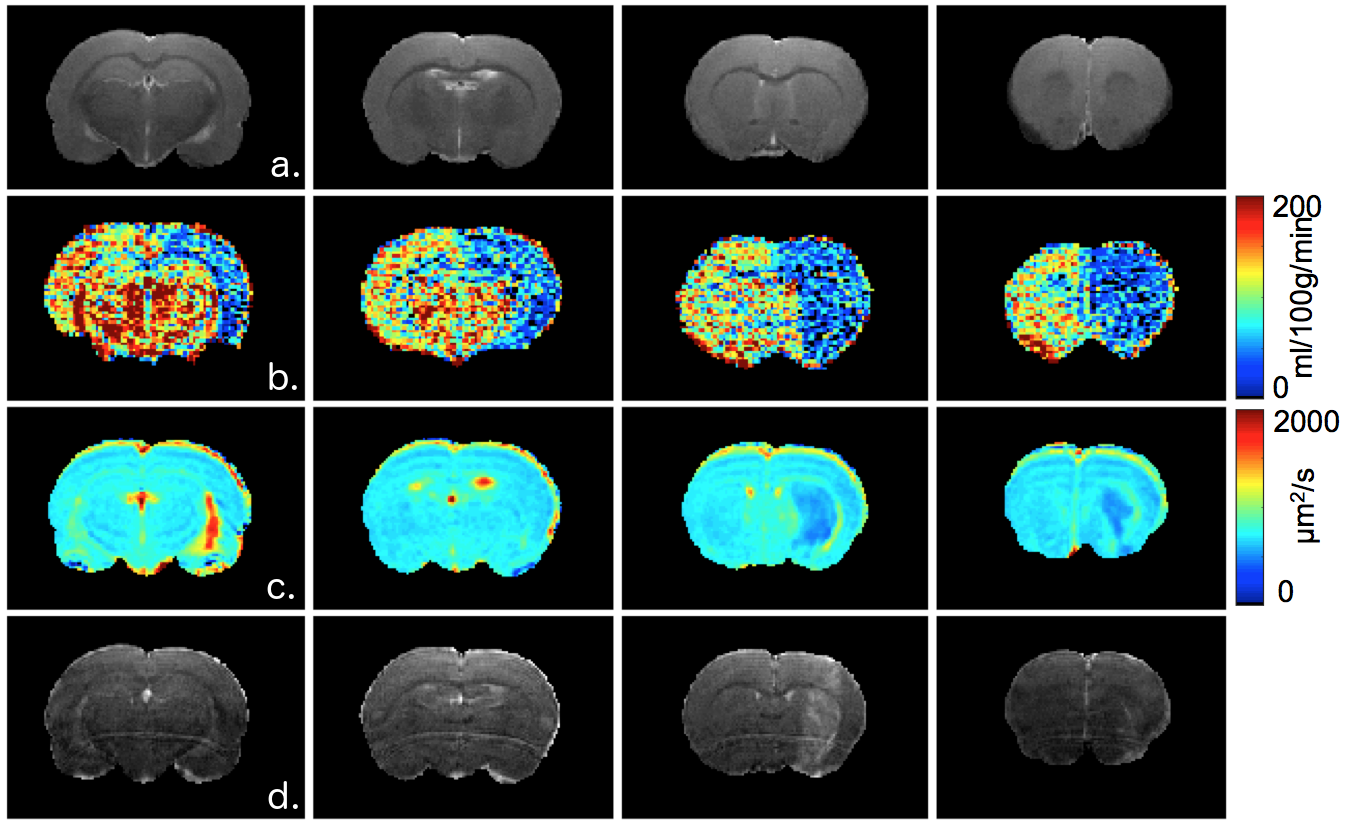
MRI was performed at 7T (Bruker) under Paravision 6.0.1 and using a volume transmit/surface receive coil. The following sequences were used: T2-weighted for anatomy (TR/TE = 2500/33 ms, pixel size = 117 x 117 x 1000 µm3, 23 slices), diffusion tensor imaging (EPI: TR/TE = 2300/21 ms, pixel size = 234 x 234 x 1000 µm3, 23 slices; b~0 and 1000 s.mm² in 30 directions), pseudo-continuous ASL (EPI: TR/TE = 4000/21 ms, pixel size = 234 x 234 x 1000 µm3, 8 slices; labeling duration=3s, post-labeling delay=300ms) after optimization of the inter-pulse phases (2) and measurement of the inversion efficiency, T1w-imaging to assess BBB opening after injection of Gd (100µmol/kg) (TR/TE = 800/6 ms, 117 x 117 x 1000 µm3, 23 slices).
Results
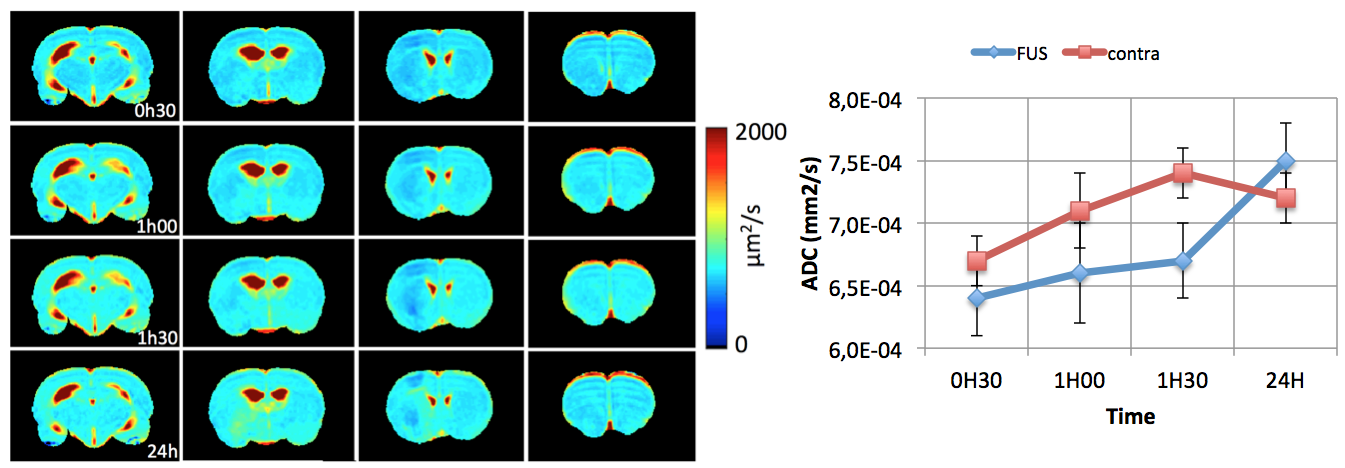
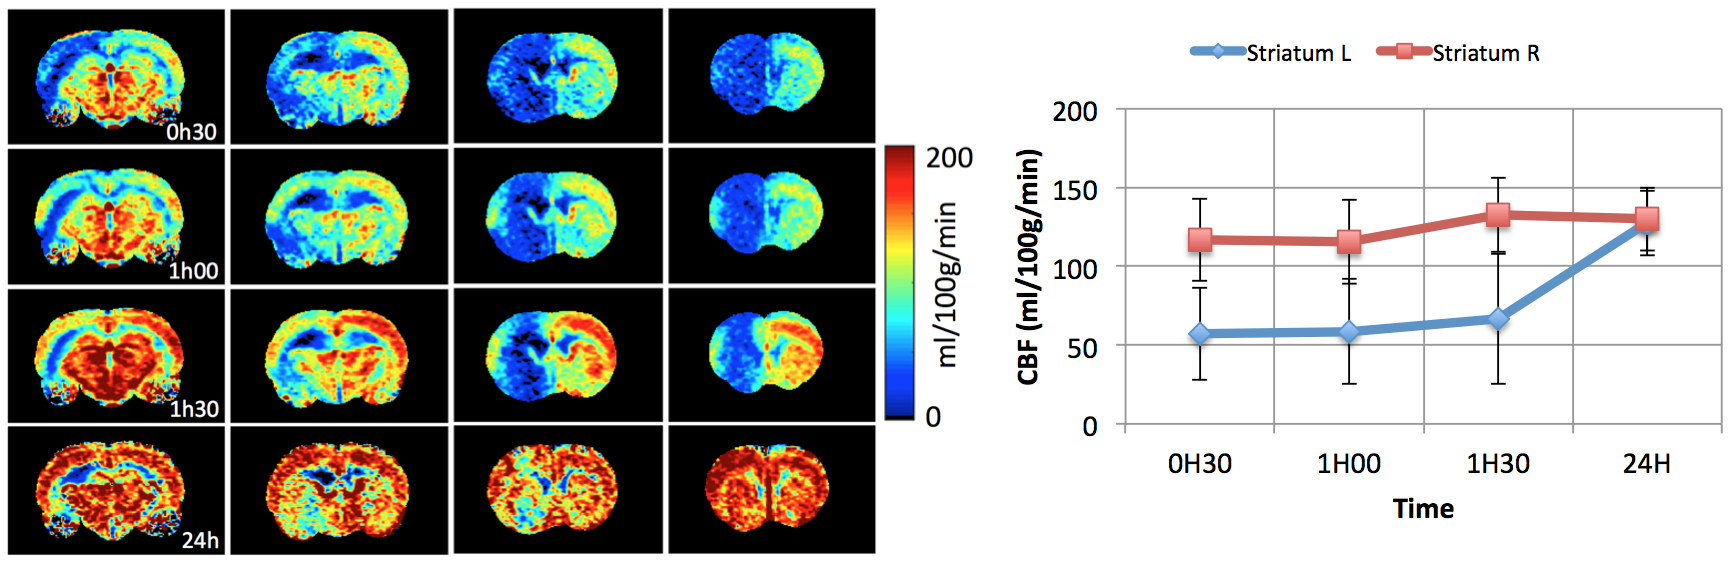
Our FUS protocol led to focal opening of the BBB, as indicated by the enhanced T1w-signal following Gd injection and no bleeding was observed (Figure 1d). A small reduction in ADC was observed as soon as 30 min after FUS (640±30 vs 670±20µm²/s) (Figure 2). This reduction lasted for at least 1h30 min and was no more visible 24h after. The extension of the area with reduced ADC was smaller than that of the BBB opening. Regarding CBF (Figure 3), there was a marked reduction as soon as 30 min after FUS (52±15 vs 110±19 ml/100g/min), which also lasted for at least 1h30 min and was no more visible 24h after FUS. The extension of the area with reduced CBF was much larger than that of the BBB opening and could correspond to the vascular territory of the middle cerebral artery.Discussion
Following FUS, a small change in ADC was observed, suggesting a small vasogenic edema. In addition, there was a 50% CBF reduction in a large vascular territory. Given the vascular anatomy of the rat, this reduction in CBF might arise from the vasoconstriction of a large artery such as the middle cerebral artery.Acknowledgements
No acknowledgement found.References
1. Timbie KF, Mead BP, Price RJ. Drug and gene delivery across the blood-brain barrier with focused ultrasound. J Control Release. 2015, 219:61-75.
2. Hirschler L, Debacker CS, Voiron J, Köhler S, Warnking JM, Barbier EL. Interpulse phase corrections for unbalanced pseudo-continuous arterial spin labeling at high magnetic field. MRM, 2017, early view.
Figures