4927
Exercise selectively increases cerebral blood flow in the postcentral gyrus in patients with Huntington’s disease1School of Physics and Astronomy, Cardiff University Brain Research Imaging Centre (CUBRIC), Cardiff University, Cardiff, United Kingdom, 2Department of Neurodegenerative Disease, University College London, London, United Kingdom, 3School of Psychology, Cardiff University Brain Research Imaging Centre (CUBRIC), Cardiff University, Cardiff, United Kingdom
Synopsis
The therapeutic potential of exercise - a potent trigger for both neurogenesis and vascular plasticity - is currently a hot research topic in neurodegenerative diseases. Here we tested whether a single 20-minute bout of aerobic exercise was sufficient to induce changes in cerebral blood flow (CBF) in people with Huntington’s disease (HD). We find a transient and selective increase in CBF in the postcentral gyrus in HD participants following exercise, a region with reduced intrinsic functional connectivity in HD patients, with no change in healthy controls. The CBF change was unrelated to clinical and genetic markers of disease.
Introduction
In the healthy brain, mounting evidence suggests exercise is a potent trigger for both neurogenesis and vascular plasticity. Exercise-induced functional improvements have been reported in a range of neurodegenerative diseases1–3. However, the biological pathways and temporal dynamics are not well understood. In healthy populations, evidence exists that a single session of exercise can induce transient changes in cerebral blood flow (CBF)4. Given that cerebrovascular abnormalities have been reported in Huntington’s disease(HD)5, we tested, using arterial spin labelling (ASL) fMRI, whether a single bout of aerobic exercise induces changes in CBF in HD patients and whether this response differs from controls.Methods
19 participants with genetically-confirmed HD (12 males, 45.9 ± 9.4 years old) and 15 matched healthy controls (9 males, 42.3 ± 9.1 years old) had an MRI scan on a 3T GE HDx system. HD participants were asymptomatic or in the early stages of manifest disease.
Baseline CBF (ml/100g/min) was measured using a PICORE Pulsed ASL (PASL) sequence6 with a gradient-echo spiral readout at eight inversion times (TI1-8 = 400, 500, 600, 700, 1100, 1400, 1700, 2000ms, TE = 2.7 ms, 15 slices [7 mm thick + 1.5 mm gap], slice delay = 52 ms, FOV = 198 mm, 3.1 mm2 in-plane resolution, QUIPSS II7 cutoff at TI>700 ms). Participants then completed 20-minutes of moderate intensity aerobic exercise (50-70% heart rate intensity8) on a cycle ergometer. Immediately after, participants had a repeat MRI scan with the multi-TI PASL sequence repeated twice at approximately 15- and 35-minutes post-exercise. A structural FSPGR (1mm3 resolution) sequence was acquired in both scan sessions for registration. Cardiorespiratory measures (heart rate, blood pressure, respiration, expired gases) were recorded. Following motion correction, perfusion quantification was performed on a voxel-by-voxel basis using a two-compartment model9 and employing partial volume correction10 (BASIL, FSL11). Median grey matter values were calculated and regional changes in CBF were assessed in the hippocampus, middle frontal gyrus, postcentral gyrus, precentral gyrus and thalamus, using masks from the Harvard-Oxford probabilistic atlas. A repeated-measures ANOVA assessed the effect of exercise and gene status (HD vs. controls) on CBF. Age, and the change in the partial pressure of end-tidal CO2 (PETCO2) from baseline were included as covariates.
In HD participants, a Pearson’s correlation examined the relationship between CBF and both genetic disease markers (the length of the genetic HD mutation [CAG repeat length]) and clinical markers (UHDRS total motor score and disease severity score12 [Age X {CAG length-35.5}]).
Results
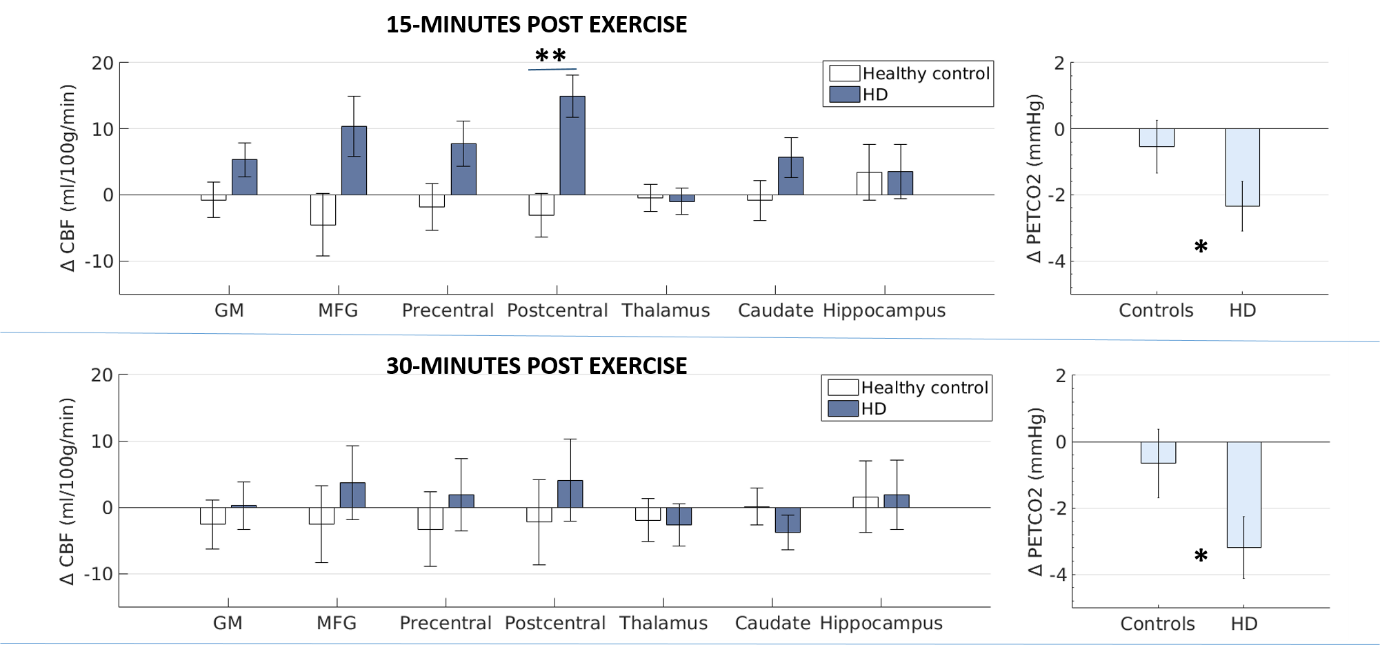
At baseline, CBF in HD participants did not differ from controls in any of the ROIs. Similarly, in HD participants, baseline CBF was not correlated with genetic mutation length or symptom severity. Following exercise, both control and HD participants were hypocapnic. However, the change in PETCO2 from baseline was 8.7x greater in HD participants 15-minutes post exercise (p=0.043, Fig.1). A significant interaction between gene status (HD vs. controls) and exercise (pre vs. post) was observed for CBF in the postcentral gyrus (p=0.023); whereas CBF did not significantly change from baseline for control participants, CBF was significantly higher after exercise in HD participants in the postcentral gyrus (Fig.1) 15-minutes after exercise cessation. There was no main effect of PETCO2 change on CBF change and the CBF difference was no longer significant 30-minutes after exercise cessation (Fig.1, bottom panel). There were no main effects of exercise or gene status in any of the other ROIs. In HD participants, the clinical and genetic markers did not predict the change in postcentral gyrus CBF or PETCO2 (p>0.05). During the intervention, there was no difference between controls (55.3 ± .15%) and HD participants (55.2 ± 0.24%) in the target heart rate achieved (p>0.05), however a smaller increase in blood lactate levels from resting was observed in HD participants (Δ = 1.23 ± 0.23 mmoL, control Δ =2.16 ± 0.16 mmoL, p=0.002). There was no difference between control and HD participants in postcentral gyri volume or mask size.Conclusion
A single session of exercise had a transient and selective effect on CBF in the postcentral gyrus in patients with Huntington’s disease, a region implicated in thalamocortical circuitry, in which reduced intrinsic functional connectivity has been shown in HD13. Elevated CBF may yield therapeutic benefit, however further work is required to determine the underlying cause of the CBF change. Along with the lactate differences, a different peripheral vascular response to exercise in HD patients has previously been observed, therefore the increased CBF in HD patients may result from systemic, vascular, metabolic and/or neural factors associated with the exercise response in this disease.Acknowledgements
We wish to acknowledge Prof. Anne Rosser and Prof. Monica Busse for providing clinical oversight, and the Cardiff Huntington's Disease Research and Management Clinic. The Waterloo Foundation and the Wellcome Trust [WT200804] funded this work.
References
1. Mehrholz, J. et al. Treadmill training for patients with Parkinson Disease. An abridged version of a Cochrane Review. Eur. J. Phys. Rehabil. Med. 52, 704–713 (2016).
2. Snook, E. M. & Motl, R. W. Effect of Exercise Training on Walking Mobility in Multiple Sclerosis: A Meta-Analysis. Neurorehabil. Neural Repair 23, 108–116 (2009).
3. Hoffmann, K. et al. Moderate-to-High Intensity Physical Exercise in Patients with Alzheimer’s Disease: A Randomized Controlled Trial. J. Alzheimer’s Dis. 50, 443–453 (2015).
4. MacIntosh, B. J. et al. Impact of a single bout of aerobic exercise on regional brain perfusion and activation responses in healthy young adults. PLoS One 9, e85163 (2014).
5. Lin, C.-Y. et al. Neurovascular abnormalities in humans and mice with Huntington’s disease. Exp. Neurol. 250, 20–30 (2013).
6. Wong, E. C., Buxton, R. B. & Frank, L. R. Implementation of quantitative perfusion imaging techniques for functional brain mapping using pulsed arterial spin labeling. NMR Biomed. 10, 237–49
7. Wong, E. C., Buxton, R. B. & Frank, L. R. Quantitative imaging of perfusion using a single subtraction (QUIPSS and QUIPSS II). Magn. Reson. Med. 39, 702–708 (1998).
8. Karvonen, J. & Vuorimaa, T. Heart rate and exercise intensity during sports activities. Practical application. Sports Med. 5, 303–11 (1988).
9. Chappell, M. A. et al. Separation of macrovascular signal in multi-inversion time arterial spin labelling MRI. Magn. Reson. Med. 63, 1357–1365 (2010).
10. Chappell, M. A. et al. Partial volume correction of multiple inversion time arterial spin labeling MRI data. Magn. Reson. Med. 65, 1173–83 (2011).
11. Groves, A. R., Chappell, M. A. & Woolrich, M. W. Combined spatial and non-spatial prior for inference on MRI time-series. Neuroimage 45, 795–809 (2009).
12. Penney, J. B., Vonsattel, J. P., MacDonald, M. E., Gusella, J. F. & Myers, R. H. CAG repeat number governs the development rate of pathology in Huntington’s disease. Ann Neurol 41, 689–692 (1997).
13. Dumas, E. M. et al. Reduced functional brain connectivity prior to and after disease onset in Huntington’s disease. NeuroImage Clin. 2, 377–384 (2013).
Figures