4924
High Resolution UTE-MRAs for Longitudinal Visualization of Revascularization and Blood-Brain Barrier Disruption on a Rat Transient Middle Cerebral Artery Occlusion Model1Department of Biomedical Engineering, Ulsan National Institute of Science and Technology, Ulsan, Republic of Korea
Synopsis
Longitudinal study of revascularization and BBB disruption after ischemic stroke provides prognostic and therapeutic information. In this work, high resolution UTE-MRAs with superparamagnetic iron oxide nanoparticles (SPION) were performed on a rat tMCAO model to visualize revascularization and BBB disruption longitudinally. UTE-MRAs before and after SPION injection clearly visualized arterial vessels and all vessels, respectively. Thickened and twisted vessels at the rat brain surface of ipsilateral hemisphere were highly resolved (59 μm3 isotropic).
Introduction
Obstruction of blood supply to the brain causes ischemic stroke, and insufficient blood flow results in brain vascular remodeling1. Longitudinal information of revascularization and blood-brain barrier (BBB) disruption after ischemic stroke is of particular importance for the prognosis and therapeutic measures1-3. Recently introduced works showed feasibility of ultrashort echo time (UTE)-MRA after injection of superparamagnetic iron oxide nanoparticle (SPION) in rats4,5. In this work, using rat transient middle cerebral artery occlusion (tMCAO) model which is widely used as an ischemic model, high resolution UTE-MRAs (59 μm3 isotropic) were performed to visualize revascularization and BBB disruption longitudinally. Also, certain vessels are segmented, and their thicknesses are monitored as reperfusion time increases.Methods
Three normal male Wistar rats (body weight 250~310g) were used for UTE-MRAs. Two Wistar rats were used for UTE-MRAs before and after injection of SPION. One Wistar rat (body weight 310 g) underwent one hour of MCAO. Then, UTE-MRAs after 3 days and 8 days reperfusion were acquired. Using 7 T MR scanner (Bruker, Ettlingen, Germany), UTE-MRAs were acquired. Imaging parameters for UTE sequence were as follows: TR/TE = 22/0.0256 ms; flip angle (FA) = 40°; field of view (FOV) = 30×30×30 mm3; matrix size = 512×512×512; resolution = 59×59×59 μm3. SPION was injected at a dose of 360 μmol Fe/kg. UTE-MRAs were denoised using block-matching and 3D (BM3D) filter6. Thickness of segmented vessels were calculated using ImageJ software by fitting maximal spheres to every point in the vessel7.Results
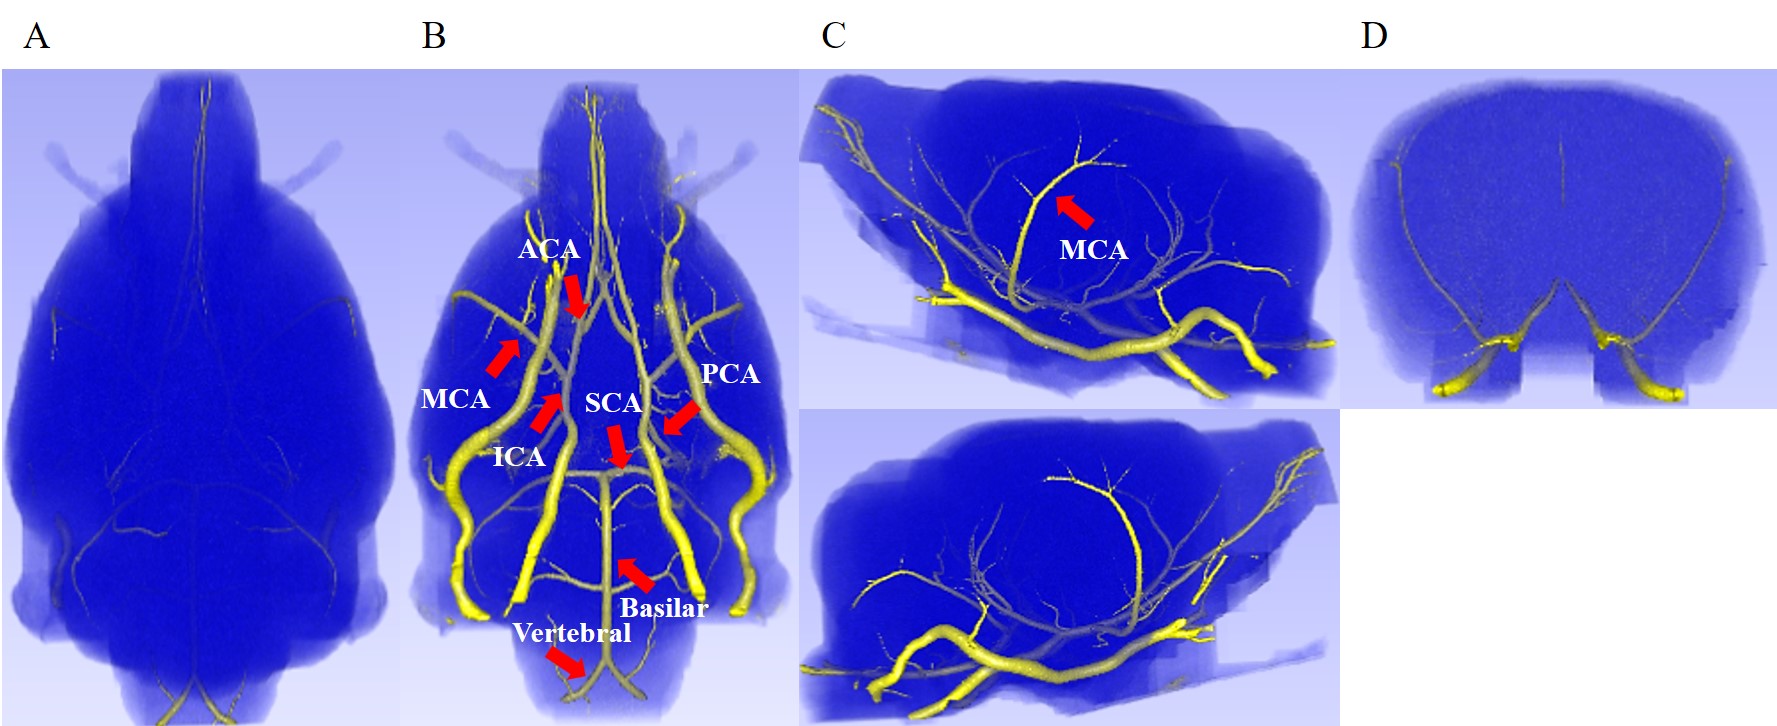
Normal rat brain UTE-MRA before injection of SPION is shown in Figure 1. In dorsal view A, no cerebral veins are visible. But, ventral view B shows main arteries which are represented with red arrows. Lateral views C shows MCA as marked with red arrow. In anterior-to-posterior view C, no intracortical penetrating vessels are shown. UTE-MRA before injection of SPION shows arterial vessels.
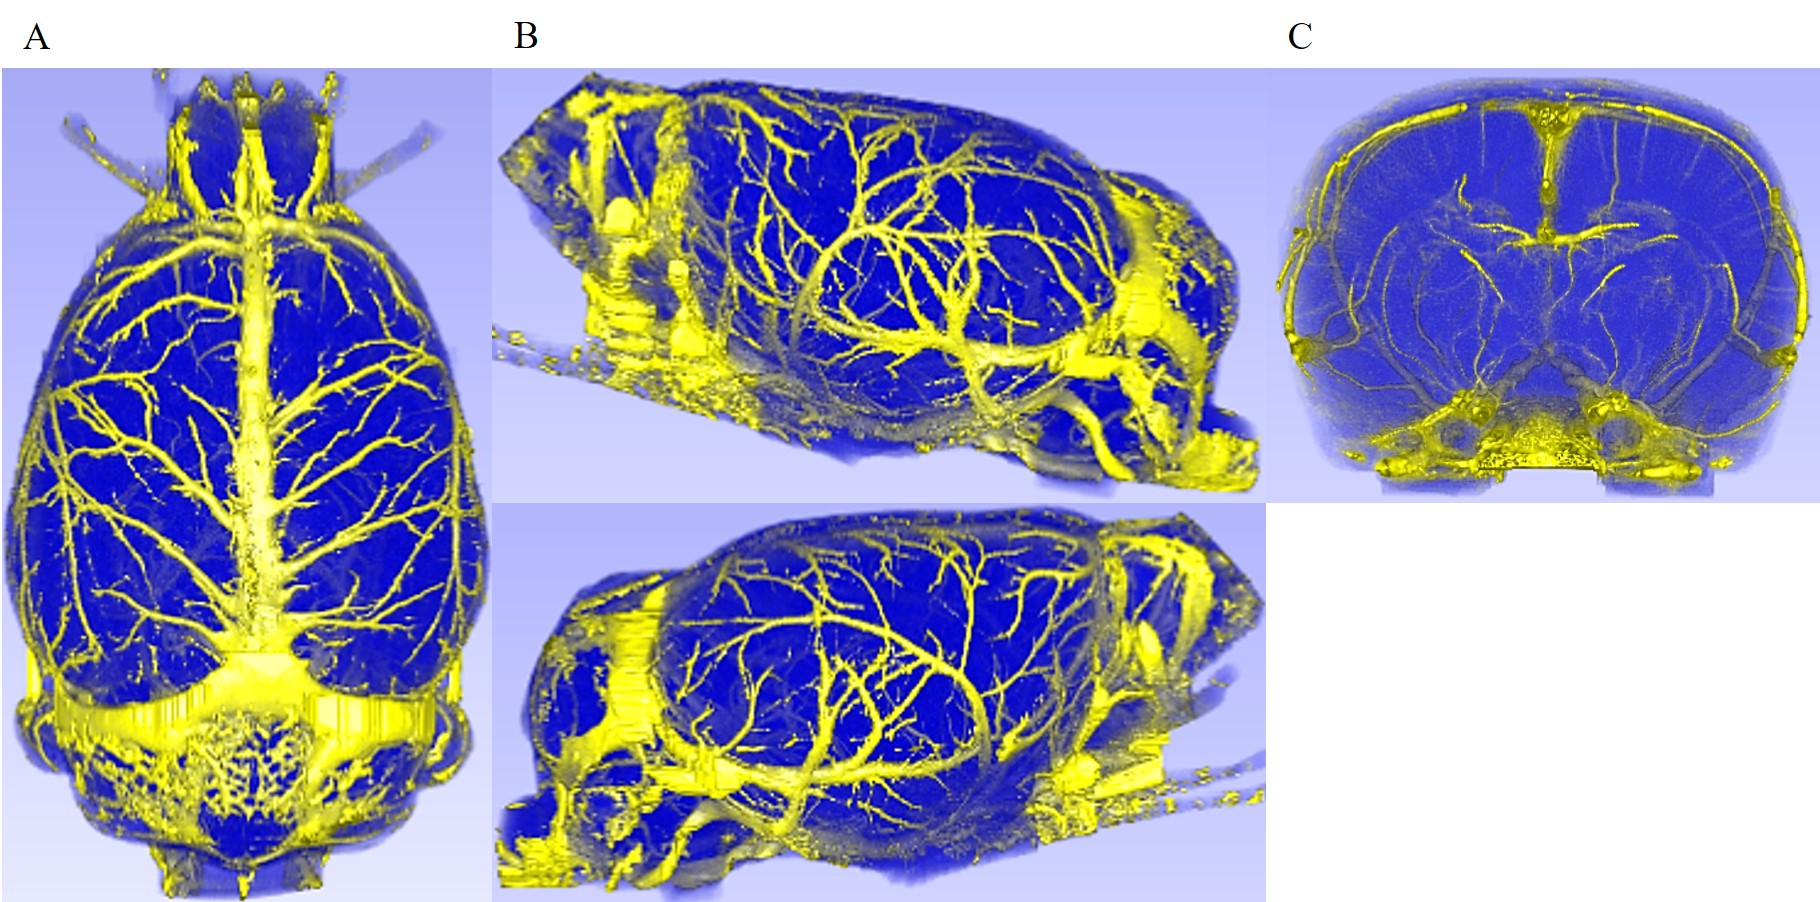
Figure 2 shows normal rat brain UTE-MRA after injection of SPION. In dorsal view A and lateral views B, many veins are visible. Also, anterior-to-posterior view C shows intracortical penetrating and other vessels. UTE-MRA after injection of SPION shows not only arteries but also veins.
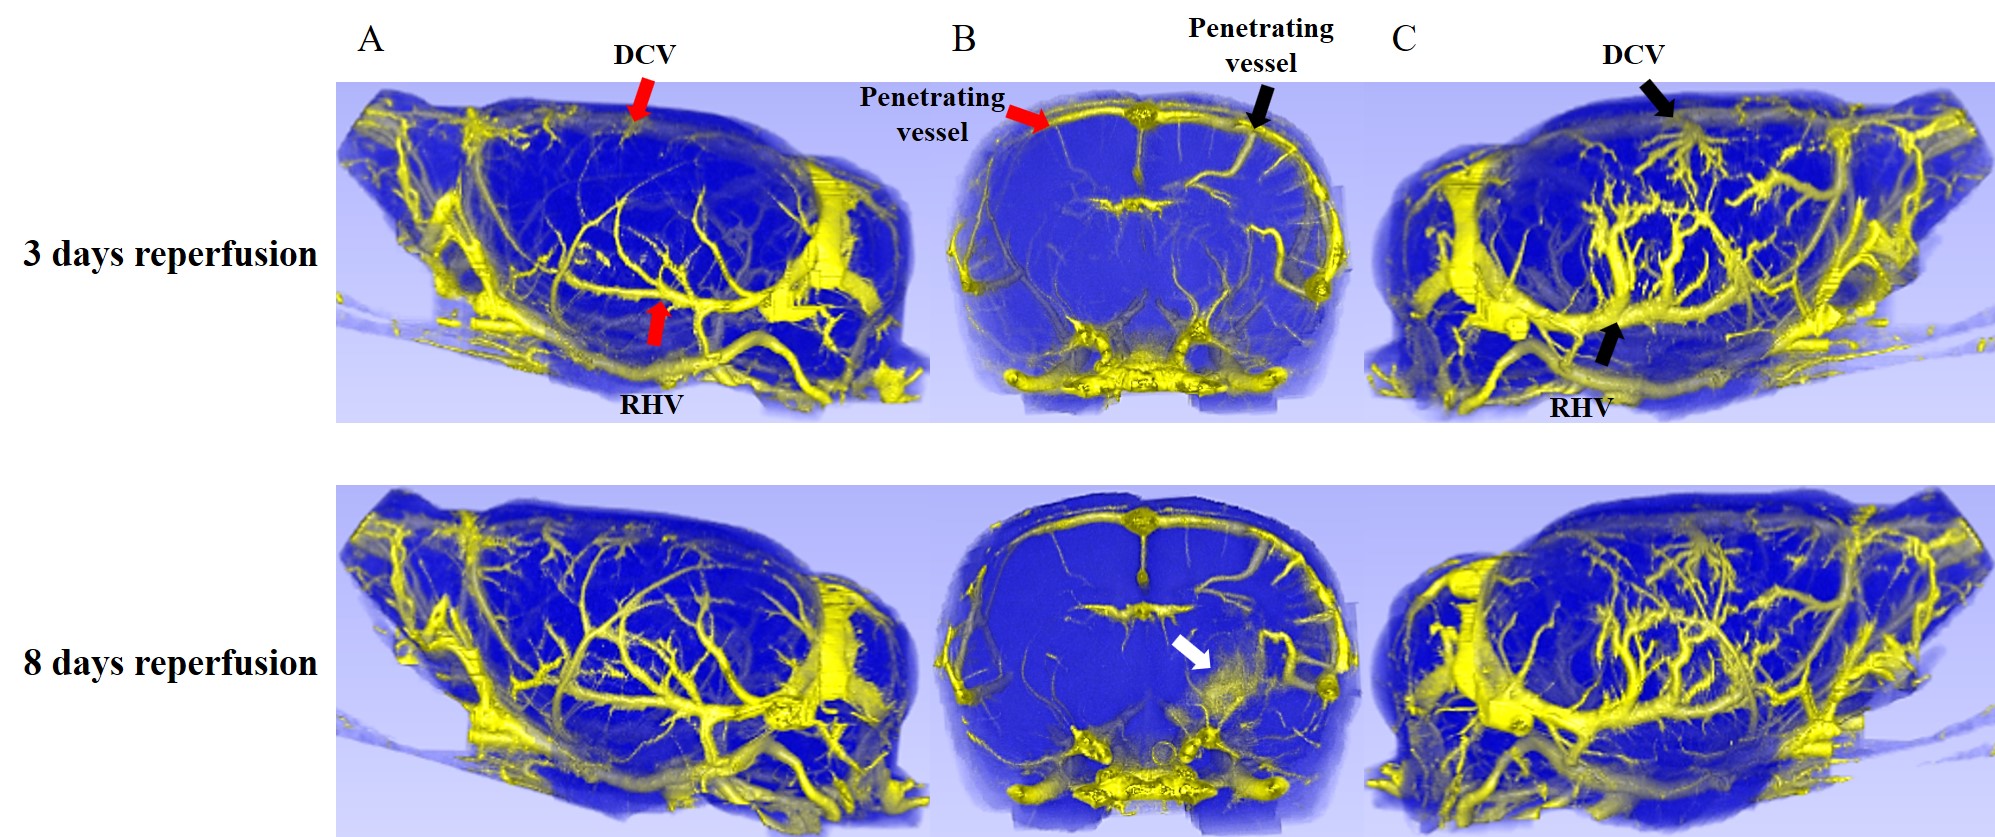
Two rat brain UTE-MRAs of 3 and 8 days after tMCAO reperfusion are shown in Figure 3. When the veins in lateral views of ipsilateral hemisphere C were compared to those of contralateral hemisphere A, thickened and twisted veins are apparent. In anterior-to-posterior views B, ipsilateral hemisphere shows more intracortical penetrating vessels than those of contralateral hemisphere. Black and red arrows indicate ipsilateral and contralateral hemisphere vessels, respectively. White arrow indicates SPION leakage region which is caused by BBB disruption. UTE-MRA after 8 days reperfusion shows SPION leakage, whereas UTE-MRA after 3 days reperfusion shows no visible SPION leakage.
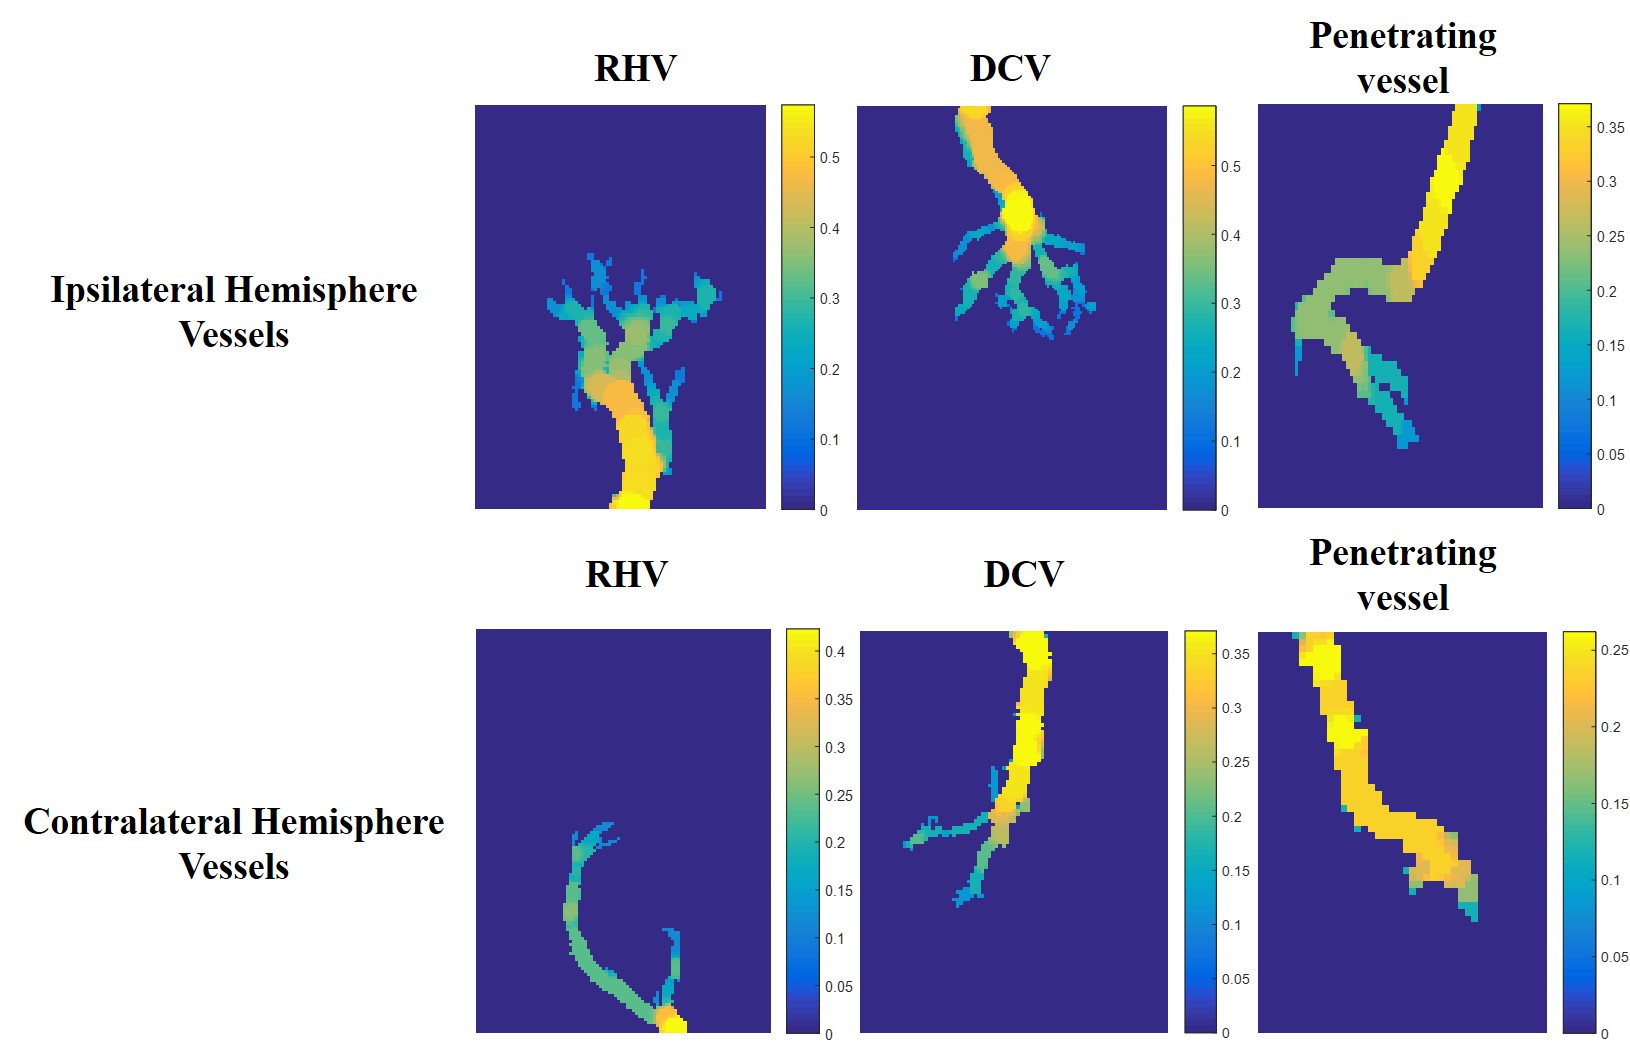
Some of the vessels indicated with black and red arrows in Figure 3 are manually segmented, and vessel thickness maps are calculated. Figure 4 shows thickness maps of segmented vessels in UTE-MRA after 3 days reperfusion. Same vessels in UTE-MRA after 8 days reperfusion and normal model (Figure 2) which are indicated with black and red arrows in Figure 3 are also segmented and thickness maps are calculated (data not shown).
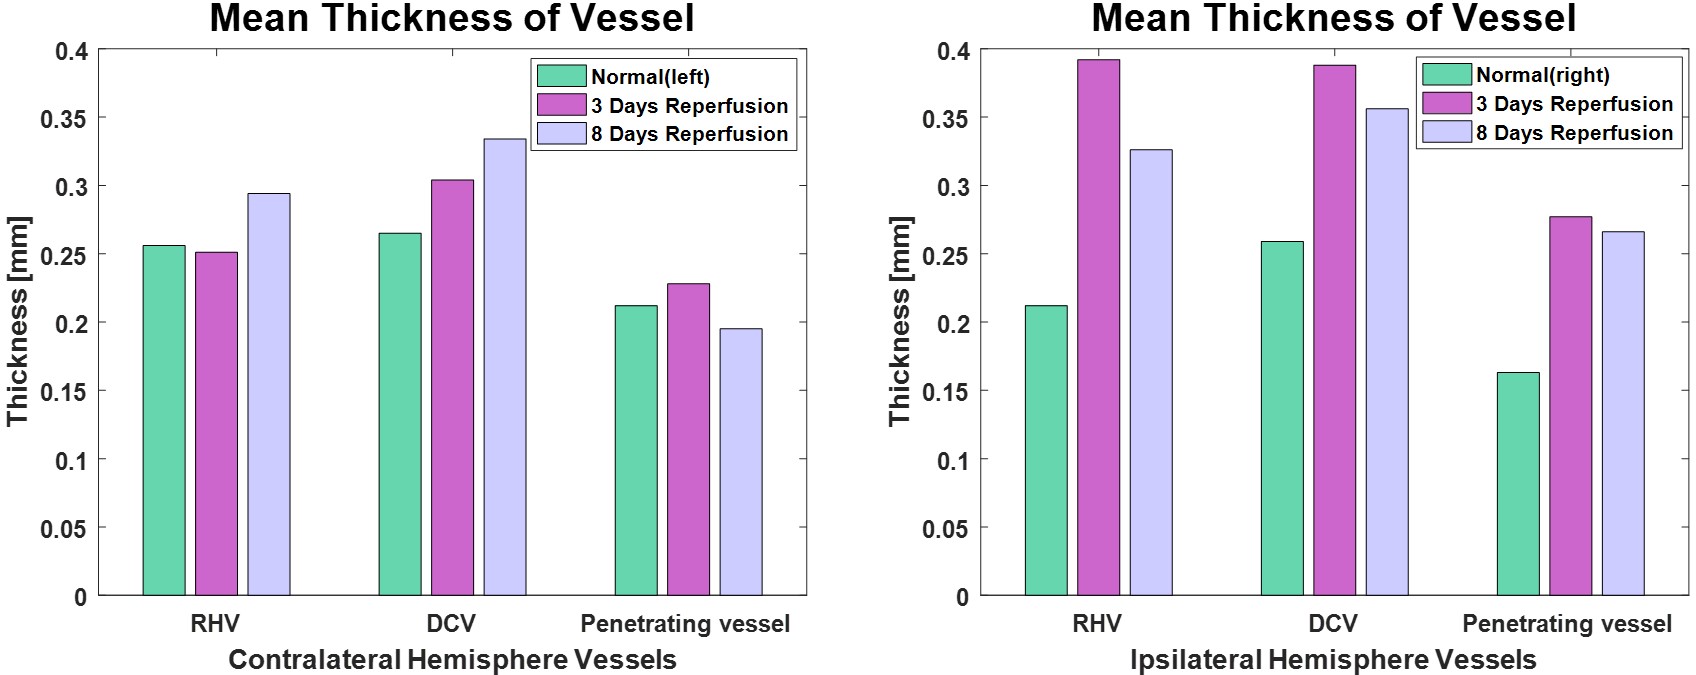
Base on the obtained thickness maps, mean thicknesses of vessels are represented with bar graphs as shown in Figure 5. The comparisons UTE-MRAs between normal and tMCAO models shows increased vessel thicknesses in ipsilateral hemisphere of tMCAO model. When the mean thicknesses of vessels in UTE-MRA after 3 days reperfusion are compared with those of 8 days reperfusion, all vessels in ipsilateral hemisphere are getting thinner. But, vessels in contralateral hemisphere are getting thicker except penetrating vessel.
Discussion
In this work, highly resolved UTE-MRAs were performed on normal and tMCAO rat models. All UTE-MRAs showed highly-resolved vessel structures in the brain surface region, which are difficult to obtain with conventional ΔR2 or ΔR2* based micro-MRAs. By taking two UTE-MRAs sequentially before and after SPION injection, arteries and veins can be separated. Thicker and twisted vessels are clearly shown in UTE-MRAs of ipsilateral hemisphere than those of contralateral hemisphere. As reperfusion time goes from 3 days to 8 days, thicknesses of vessels in brain surface region of ipsilateral hemisphere are getting thinner, while those of contralateral hemisphere are getting thicker.Acknowledgements
No acknowledgement found.References
1. Boehm‐Sturm, Philipp, et al. "Vascular changes after stroke in the rat: a longitudinal study using optimized magnetic resonance imaging." Contrast media & molecular imaging 8.5 (2013): 383-392.
2. Lin, Chien-Yuan, et al. "Dynamic changes in vascular permeability, cerebral blood volume, vascular density, and size after transient focal cerebral ischemia in rats: evaluation with contrast-enhanced magnetic resonance imaging." Journal of
3. Shen, Qiang, et al. "Spatiotemporal characteristics of postischemic hyperperfusion with respect to changes in T1, T2, diffusion, angiography, and blood–brain barrier permeability." Journal of Cerebral Blood Flow & Metabolism 31.10 (2011): 2076-2085.
4. Jung, Hoesu, et al. "Dual MRI T 1 and T 2 (⁎) contrast with size-controlled iron oxide nanoparticles." Nanomedicine: Nanotechnology, Biology and Medicine 10.8 (2014): 1679-1689.
5. Jung, H. S., et al. "UTE–ΔR2–ΔR2* combined MR whole‐brain angiogram using dual‐contrast superparamagnetic iron oxide nanoparticles." NMR in Biomedicine 29.6 (2016): 690-701.
6. Dabov, Kostadin, et al. "Image denoising with block-matching and 3 D filtering." Proceedings of SPIE. Vol. 6064. No. 30. 2006.
7. Hildebrand,
Tor, and Peter Rüegsegger. "A new method for the model‐independent assessment of thickness in three‐dimensional images." Journal of
microscopy 185.1 (1997): 67-75.
Figures