4923
Imaging Blood Brain Barrier Disruption in Multiple Sclerosis using GlucoCEST MRI1Russell H. Morgan Department of Radiology and Radiological Science, Johns Hopkins University, Baltimore, MD, United States, 2F. M. Kirby Research Center for Functional Brain Imaging, Kennedy Krieger Research Institute, Baltimore, MD, United States, 3Department of Neurology, Johns Hopkins University, Baltimore, MD, United States, 4Department of Medical Radiation Physics, Lund University, Lund, Sweden
Synopsis
It has been demonstrated that glucose can be used as a contrast agent for chemical exchange saturation transfer (glucoCEST) and enhanced relaxation (T2 or T1ρ). In the present work we show the possibility of detecting blood brain barrier (BBB) disruption in multiple sclerosis (MS) using glucoCEST MRI at 7T and 3T. At both field strengths, glucoCEST enhancement was observed in some MS lesions that were not enhanced by Gd T1w images. Our results show that glucose may be more permeable than Gd to minor BBB disruptions, suggesting that glucose transport may also be more sensitive to MS disease activities.
Target audience
Those interested in imaging neuroinflammatory diseases involving blood-brain barrier (BBB) disruption using chemical exchange based contrast agents for CEST, T2 or T1ρ imaging.Purpose
Disease activity in multiple sclerosis (MS) is linked to the formation of new and enlarging lesions, involving a complicated cascade of inflammatory events that eventually leads to BBB disruption. The increased BBB permeability allows large gadolinium molecules to leak in. Therefore, a focal area of contrast enhancement on the post contrast T1w images typically indicates new MS lesions. D-Glucose has shown potential as a biodegradable contrast agent for CEST MRI (glucoCEST)(1-4), T1ρ-based (5,6) or T2-based relaxation (7,8) approaches. CEST MRI of glucose derivatives has also been suggested (9,10). Time resolved dynamic images help gain information regarding the uptake of glucose and therefore reflects cerebral perfusion related properties. It was previously demonstrated that dynamic glucose enhanced (DGE) MRI holds potential to image BBB disruption in tumors in human (11,12,13). Here we present the possibility of detecting BBB disruption in MS using glucoCEST MRI.Method
Three consented MS patients participated in the study. One MS patient was scanned on a 7T and two patients were scanned on a 3T Philips MRI scanner. A brief hyperglycemic state was established by injecting a standard 50mL 50% hospital grade D-glucose ampule over a period of 1-3min. CEST MRI images were collected continuously before, during and after glucose injection. Approximately 30-40min after glucose injection, standard Gd contrast agent (proHance) was injected at 0.1mM/kg body weight for post-Gd T1 MPRAGE.
At 7T, CEST saturation was achieved using a train of 32 sinc-gauss RF pulses. Each pulse was 50ms in length with peak B1 power of 1.96μT. Due to the amplifier duty cycle limitations, sequential RF pulses were separated by a delay of 35ms. A 3D single shot turbo gradient echo sequence was used for the imaging readout. A volume of 224×224×150mm3 was imaged with an in-plane resolution of 2×2mm2 and slice thickness of 3mm. At 3T, a pseudo-continuous wave saturation was achieved using a dual channel transmit approach (14) in which each RF channel pulses for 50ms alternatingly for a total of 1.0s with B1rms of 1.6μT. Images were acquired using a turbo spin echo sequence with TR/TE/FA = 2.7s / 6.1ms / 90°. A 3D volume consisting of 15 slices across a FOV of 220×180×66mm3 was acquired. The in-plane resolution was 2.2mm2 with slice thickness of 4.4mm. At both fields, the post Gd T1 MPRAGE images were acquired covering the same volume at 1×1×1mm3 resolution.
Results and Discussion
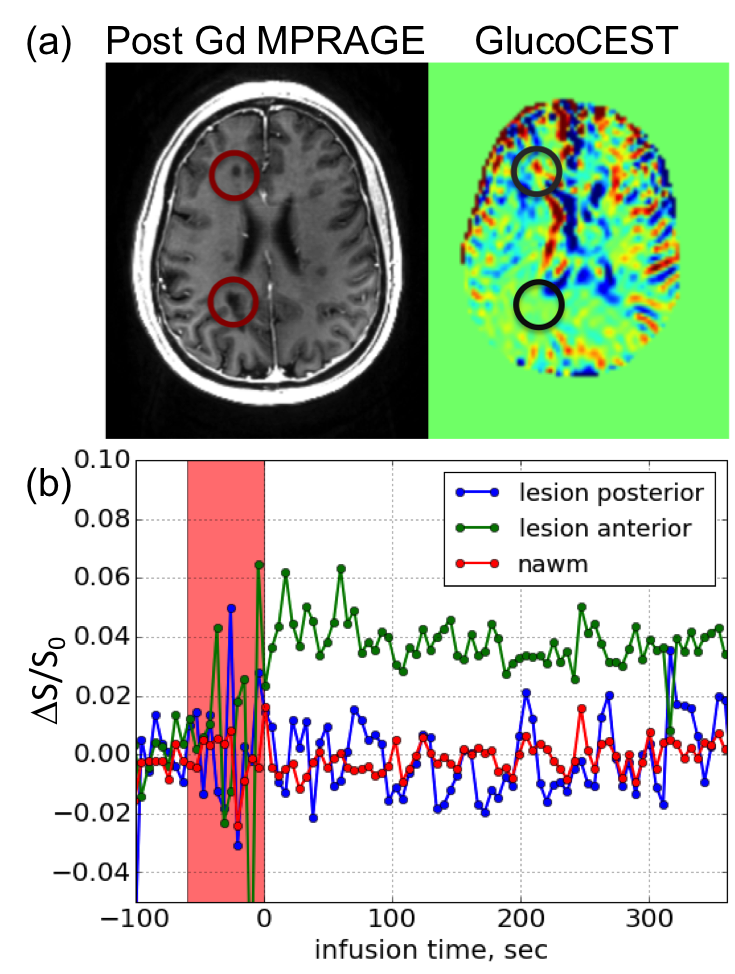
Fig 1a shows the co-registered T1 MPRAGE and dynamic difference CEST images from a single slice acquired at 7T. Dark lesions were identified in the post-contrast T1w images and circled in red. In the DGE images (area under the curve over 5 min post-infusion), the lesion posterior to the ventricles did not show appreciable enhancement. However, the smaller lesion anterior to the right ventricle did show pronounced enhancement. The dynamic curve in Fig 1b shows that the glucoCEST signal in the anterior lesion increased rapidly post-injection and the enhancement persisted during the entire course of study (>5 min post-injection), while the posterior lesion and the normal appearing white matter (NAWM) remained stable within the noise post injection.
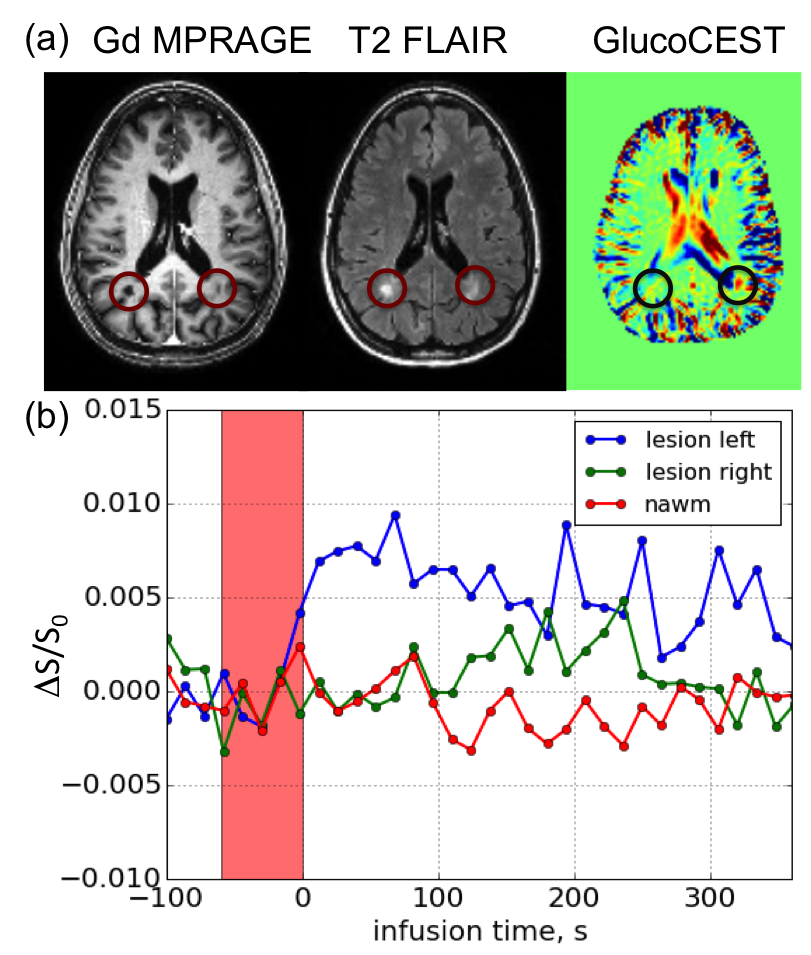
Fig. 2a shows the post Gd T1 MPRAGE, T2 FLAIR and the glucoCEST images of the same slice acquired at 3T. It can be seen that posterior to the ventricle, a lesion in the left hemisphere was enhanced while a lesion on the right was not. The uptake of glucose, as shown in the dynamic curve (Fig. 2b) shows persistent, distinguishable differences between the glucose enhanced lesion versus the non-enhanced lesion and the NAWM. Our interpretation is that because the size of a glucose molecule is much smaller than the Gd macromolecule contrast agent, lesions are possibly more permeable to glucose for minor BBB disruptions that are not severe enough to be permeable to Gd chelates. At both field strengths, the fact that we observed glucoCEST enhancement in some MS lesions that were not enhanced by Gd may suggest the presence of a minor BBB disruption/inflammation that was not detectable by Gd T1w.
Conclusion
Our results show that it is possible to study MS lesions using glucoCEST at 7T and 3T. Presence of enhancement in some lesions seen in glucoCEST images but not Gd T1w images may suggest the presence of minor but persistent BBB disruption/inflammation. These results suggest that glucose transport (passive and active) may be more sensitive than Gd-enhanced MR to lesions due to MS.Acknowledgements
No acknowledgement found.References
1. Chan KW, McMahon MT, Kato Y, Liu G, Bulte JW, Bhujwalla ZM, Artemov D, van Zijl PC. Natural D-glucose as a biodegradable MRI contrast agent for detecting cancer. Magn. Reson. Med. 2012;68(6):1764-1773.
2. Walker-Samuel S, Ramasawmy R, Torrealdea F, Rega M, Rajkumar V, Johnson SP, Richardson S, Goncalves M, Parkes HG, Arstad E, Thomas DL, Pedley RB, Lythgoe MF, Golay X. In vivo imaging of glucose uptake and metabolism in tumors. Nat. Med 2013;19(8):1067-1072.
3. Nasrallah FA, Pages G, Kuchel PW, Golay X, Chuang KH. Imaging brain deoxyglucose uptake and metabolism by glucoCEST MRI. J. Cereb. Blood Flow and Metab. 2013;33(8):1270-1278.
4. Xu X, Chan KW, Knutsson L, Artemov D, Xu J, Liu G, Kato Y, Lal B, Laterra J, McMahon MT, van Zijl PC. Dynamic glucose enhanced (DGE) MRI for combined imaging of blood-brain barrier break down and increased blood volume in brain cancer. Magn. Reson. Med. 2015: 74(6): 1556-1563.
5. Jin T, Mehrens H, Hendrich KS, Kim SG. Mapping brain glucose uptake with chemical exchange-sensitive spin-lock magnetic resonance imaging. J. Cereb. Blood Flow and Metab. 2014;34(8):1402-1410.
6. Zu Z, Spear J, Li H, Xu J, Gore JC. Measurement of regional cerebral glucose uptake by magnetic resonance spin-lock imaging. Magn. Reson Imag. 2014;32(9):1078-1084.
7. Gore JC, Brown MS, Mizumoto CT, Armitage IM. Influence of glycogen on water proton relaxation times. Magn. Reson. Med.1986;3(3):463-466.
8. Yadav NN, Xu J, Bar-Shir A, Qin Q, Chan KW, Grgac K, Li W, McMahon MT, van Zijl PC. Natural D-glucose as a biodegradable MRI relaxation agent. Magn. Reson. Med. 2014;72(3):823-828.
9. Rivlin M, Horev J, Tsarfaty I, Navon G. Molecular imaging of tumors and metastases using chemical exchange saturation transfer (CEST) MRI. Sci. Rep. 2013;3:3045.
10. Rivlin M, Tsarfaty I, Navon G. Functional molecular imaging of tumors by chemical exchange saturation transfer MRI of 3-O-Methyl-D-glucose. Magn. Reson. Med. 2014;72(5):1375-1380.
11. Xu, X.; Yadav, N. N.; Knutsson, L.; Hua, J.; Kalyani, R.; Hall, E.; Laterra, J.; Blakeley, J.; Strowd, R.; Pomper, M.; Barker, P.; Chan, K.; Liu, G.; McMahon, M. T.; Stevens, R. D.; van Zijl, P. C. M., Dynamic Glucose-Enhanced (DGE) MRI: Translation to Human Scanning and First Results in Glioma Patients. Tomography 2015, 1 (2), 105-114.
12. Schuenke, P.; Paech, D.; Koehler, C.; Windschuh, J.; Bachert, P.; Ladd, M. E.; Schlemmer, H. P.; Radbruch, A.; Zaiss, M., Fast and Quantitative T1rho-weighted Dynamic Glucose Enhanced MRI. Sci. Rep. 2017, 7, 42093.
13. Paech D, Schuenke P, Koehler C, Windschuh J, Mundiyanapurath S, Bickelhaupt S, Bonekamp D, Bäumer P, Bachert P, Ladd ME, Bendszus M, Wick W, Unterberg A, Schlemmer HP, Zaiss M, Radbruch A. T1ρ-weighted Dynamic Glucose-enhanced MR Imaging in the Human Brain. Radiology. 2017 Jun 16:162351.
14. Keupp J, Baltes C, Harvey P, J. VdB. Parallel RF transmission based MRI technique for highly sensitive detection of amide proton transfer in the human brain at 3T. Proc. Int. Soc. Magn. Reson. Med. 2011;19(710).
Figures