4921
Blood Brain Barrier Water Permeability in Non-Enhancing Multiple Sclerosis Lesion with Intrinsic Diffusivity Encoding of Arterial Labeled Spins (IDEALS)1Biomedical Engineering, Stony Brook University, Stony Brook, NY, United States, 2Biology, Stony Brook University, Stony Brook, NY, United States, 3Neurology, Stony Brook University Hospital, Stony Brook, NY, United States, 4Radiology, Stony Brook University Hospital, Stony Brook, NY, United States
Synopsis
Persistent endothelial abnormalities and blood-brain barrier (BBB) disruption may play an important role in MS lesion formation and progression. In MS, BBB dysfunction occurs not only in active lesions with contrast-enhancement, but also in inactive (chronic) lesions and normal appearing white matter. In this study a novel method to map whole-brain BBB water permeability (IDEALS) was used to measure in non-enhancing MS lesions of 11 relapse-remitting MS patients. Although the permeability for MRI contrast in non-enhancing MS lesions is several orders of magnitude lower than that of enhancing MS lesions, our study demonstrated a robust reduction of lesion water permeability.
Introduction:
Multiple sclerosis (MS) is the leading cause of disability in young adults1. The blood-brain barrier (BBB) plays a critical role in maintaining homeostasis within the brain2. Clinical data and gadolinium DCE-MRI have linked BBB breaching to the onset and progression of MS lesions3. Since trans-capillary water permeability may provide a more direct and sensitive assessment of BBB integrity, here, we apply a novel method developed in our lab, Intrinsic Diffusivity Encoding of Arterial Labeled Spins (IDEALS), to non-invasively investigate changes of BBB water permeability, i.e. water extraction fraction (Ew) and water permeability-surface area product (PSw) in non-enhancing MS lesion and normal-appearing white matter (NAWM).Theory:
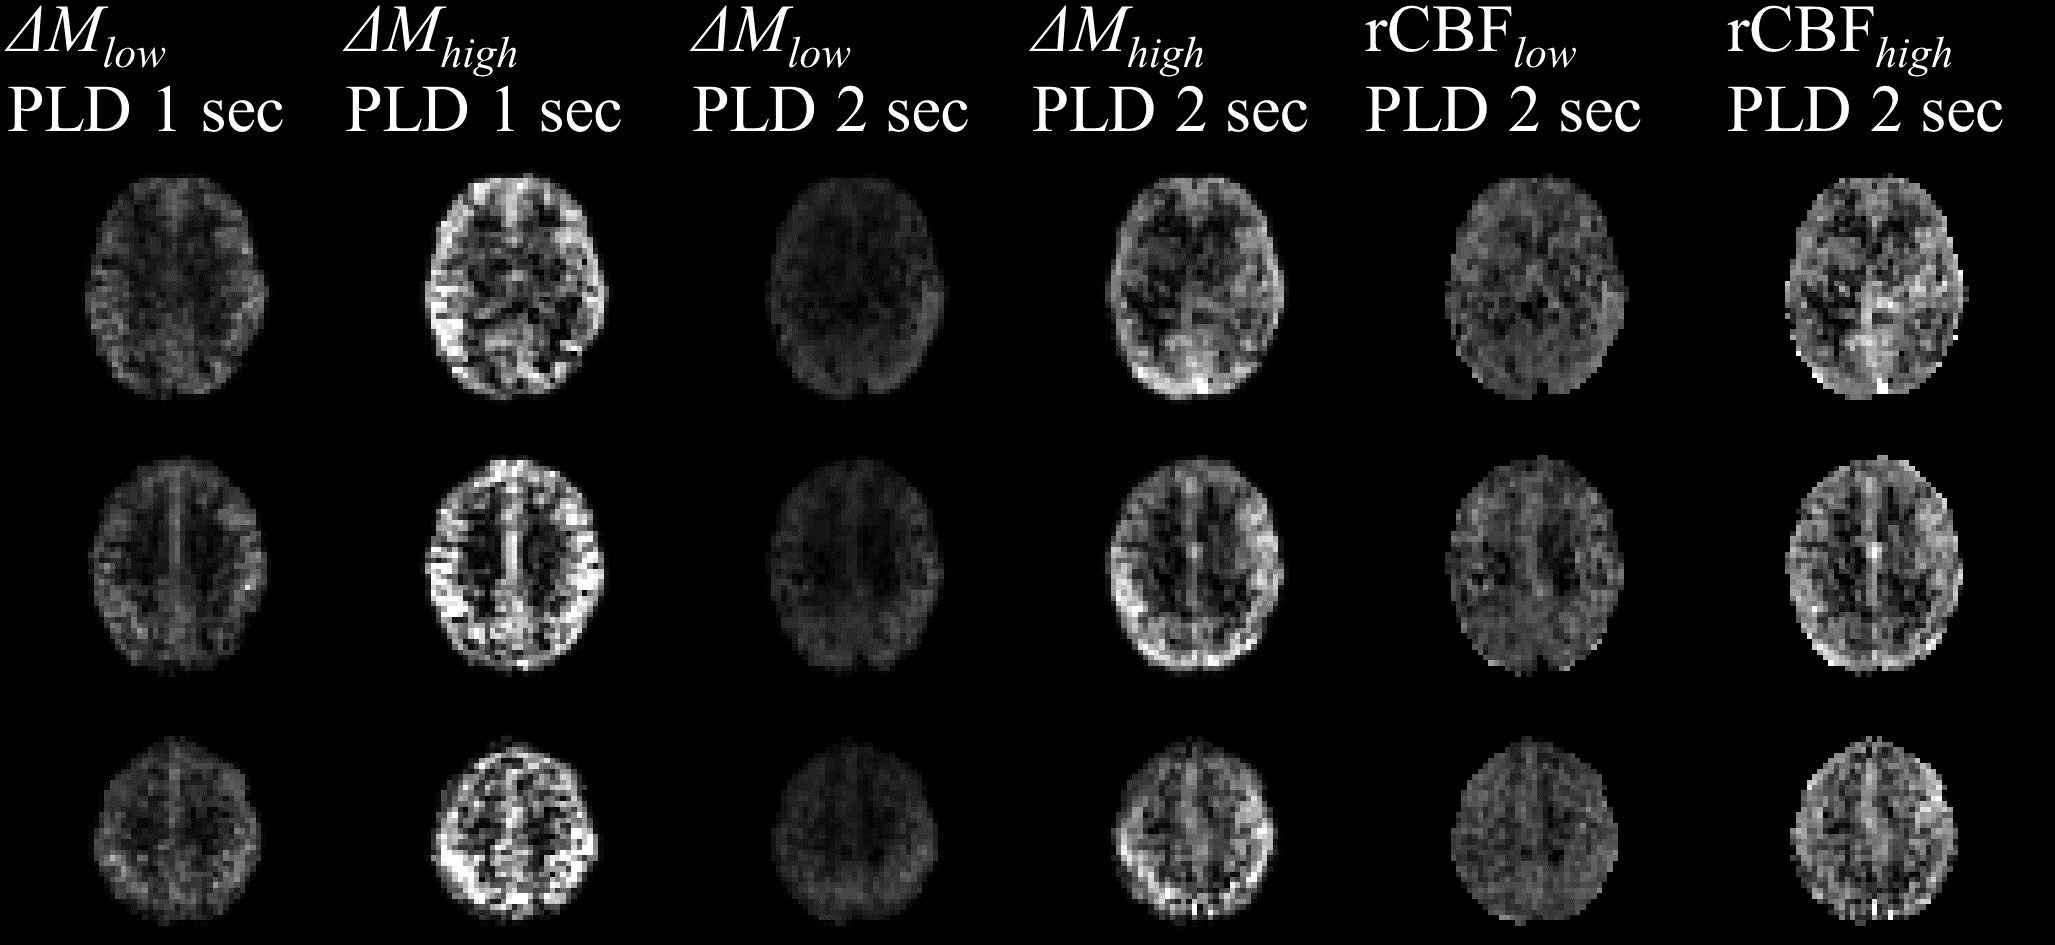
In IDEALS, intravascular and extravascular labeled water after pCASL preparation will be separated by the intrinsic diffusivity of the segmented 3D-GRASE acquisition. The attenuation of the k-space signal caused by self-diffusion and flow-related pseudo-diffusion along the 3D-GRASE echo train manifests as a point spread function (PSF) along the partition direction in the image domain. The PSFs are different for intra- and extra-vascular labeled spins, and are dependent upon the segmentation scheme and other MR parameters. Perfusion MR signals $$$∆M_{high}$$$ and $$$∆M_{low}$$$ acquired at high and low segmentation schemes respectively, can be described as:
$$$∆M_i=(1-A_2)\cdot ∆M_{true}\otimes PSF_i^{intra}+A_2\cdot ∆M_true\otimes PSF_i^{extra}$$$, (1)
where the subscript i represents the high and low segmentation schemes; $$$∆M_{true}$$$ is the true perfusion signal; \otimes is the convolution operator; $$$PSF_i^{intra}$$$ and $$$PSF_i^{extra}$$$ are the PSFs for intravascular and extravascular spins respectively; A2 is the signal fraction from labeled extravascular spins. The PSFs can be estimated under the paradigm of augmented extended phase graphs accounting for diffusion and pseudo-diffusion4. Therefore, an A2 map can be estimated through a deconvolution process. To improve estimation robustness in low perfusion white matter (WM) regions, a partial volume correction method similar to CBF quantification is utilized5. Two post-labeling delay (PLD) values of 2000 ms and 1000 ms are adopted. A PLD of 2000 ms ensures that all labeled intravascular spins resides in venules and veins so that Ew can be derived from A2 after T1 correction. A PLD of 1000 ms will determine the arterial transit time (ATT) similar to FEAST approach6. The BBB PSw is subsequently estimated from the Renkin-Crone equation7,8:
$$$E_w=1-e^{-\frac{PS_w}{CBF}}$$$. (2)
Methods:
Eleven relapsing-remitting MS paitents were recruited with IRB approval and informed consent. All studies were performed on a Siemens 3T MRI with 12-channel head coil. ASL images were acquired using pCASL 3D-GRASE with the following parameters: TR/TE/Label Time 4500/16.12/1600ms, FA=120°, matrix of 64×64×32, FOV of 256×256×128 mm3, iPAT2. Two segmentation schemes (4PAR×2PE and 1PAR×2PE) and two post-label delays (PLDs) (1000 and 2000 ms) were used for a total of 4 sets of ASL images. High resolution MPRAGE and FLAIR images were acquired for tissue segmentation.
Cerebral blood flow (CBF) maps were estimated from partial volume corrected images at PLD of 2000 ms. CSF contamination was removed such that the CBF value at a given voxel was adjusted relative to its parenchymal tissue fraction. The BBB PSw was then estimated from Eq. (2). Non-enhancing MS lesions and surrounding normal appearing tissues were manually contoured using FLAR images. Normal-appearing white matter (NAWM) masks were created by segmentation of the MPRAGE image and removing the MS lesions and surrounding normal appearing tissues. Two-tailed paired t-tests were used to test for significant within-subject differences for the three regions.
Results:
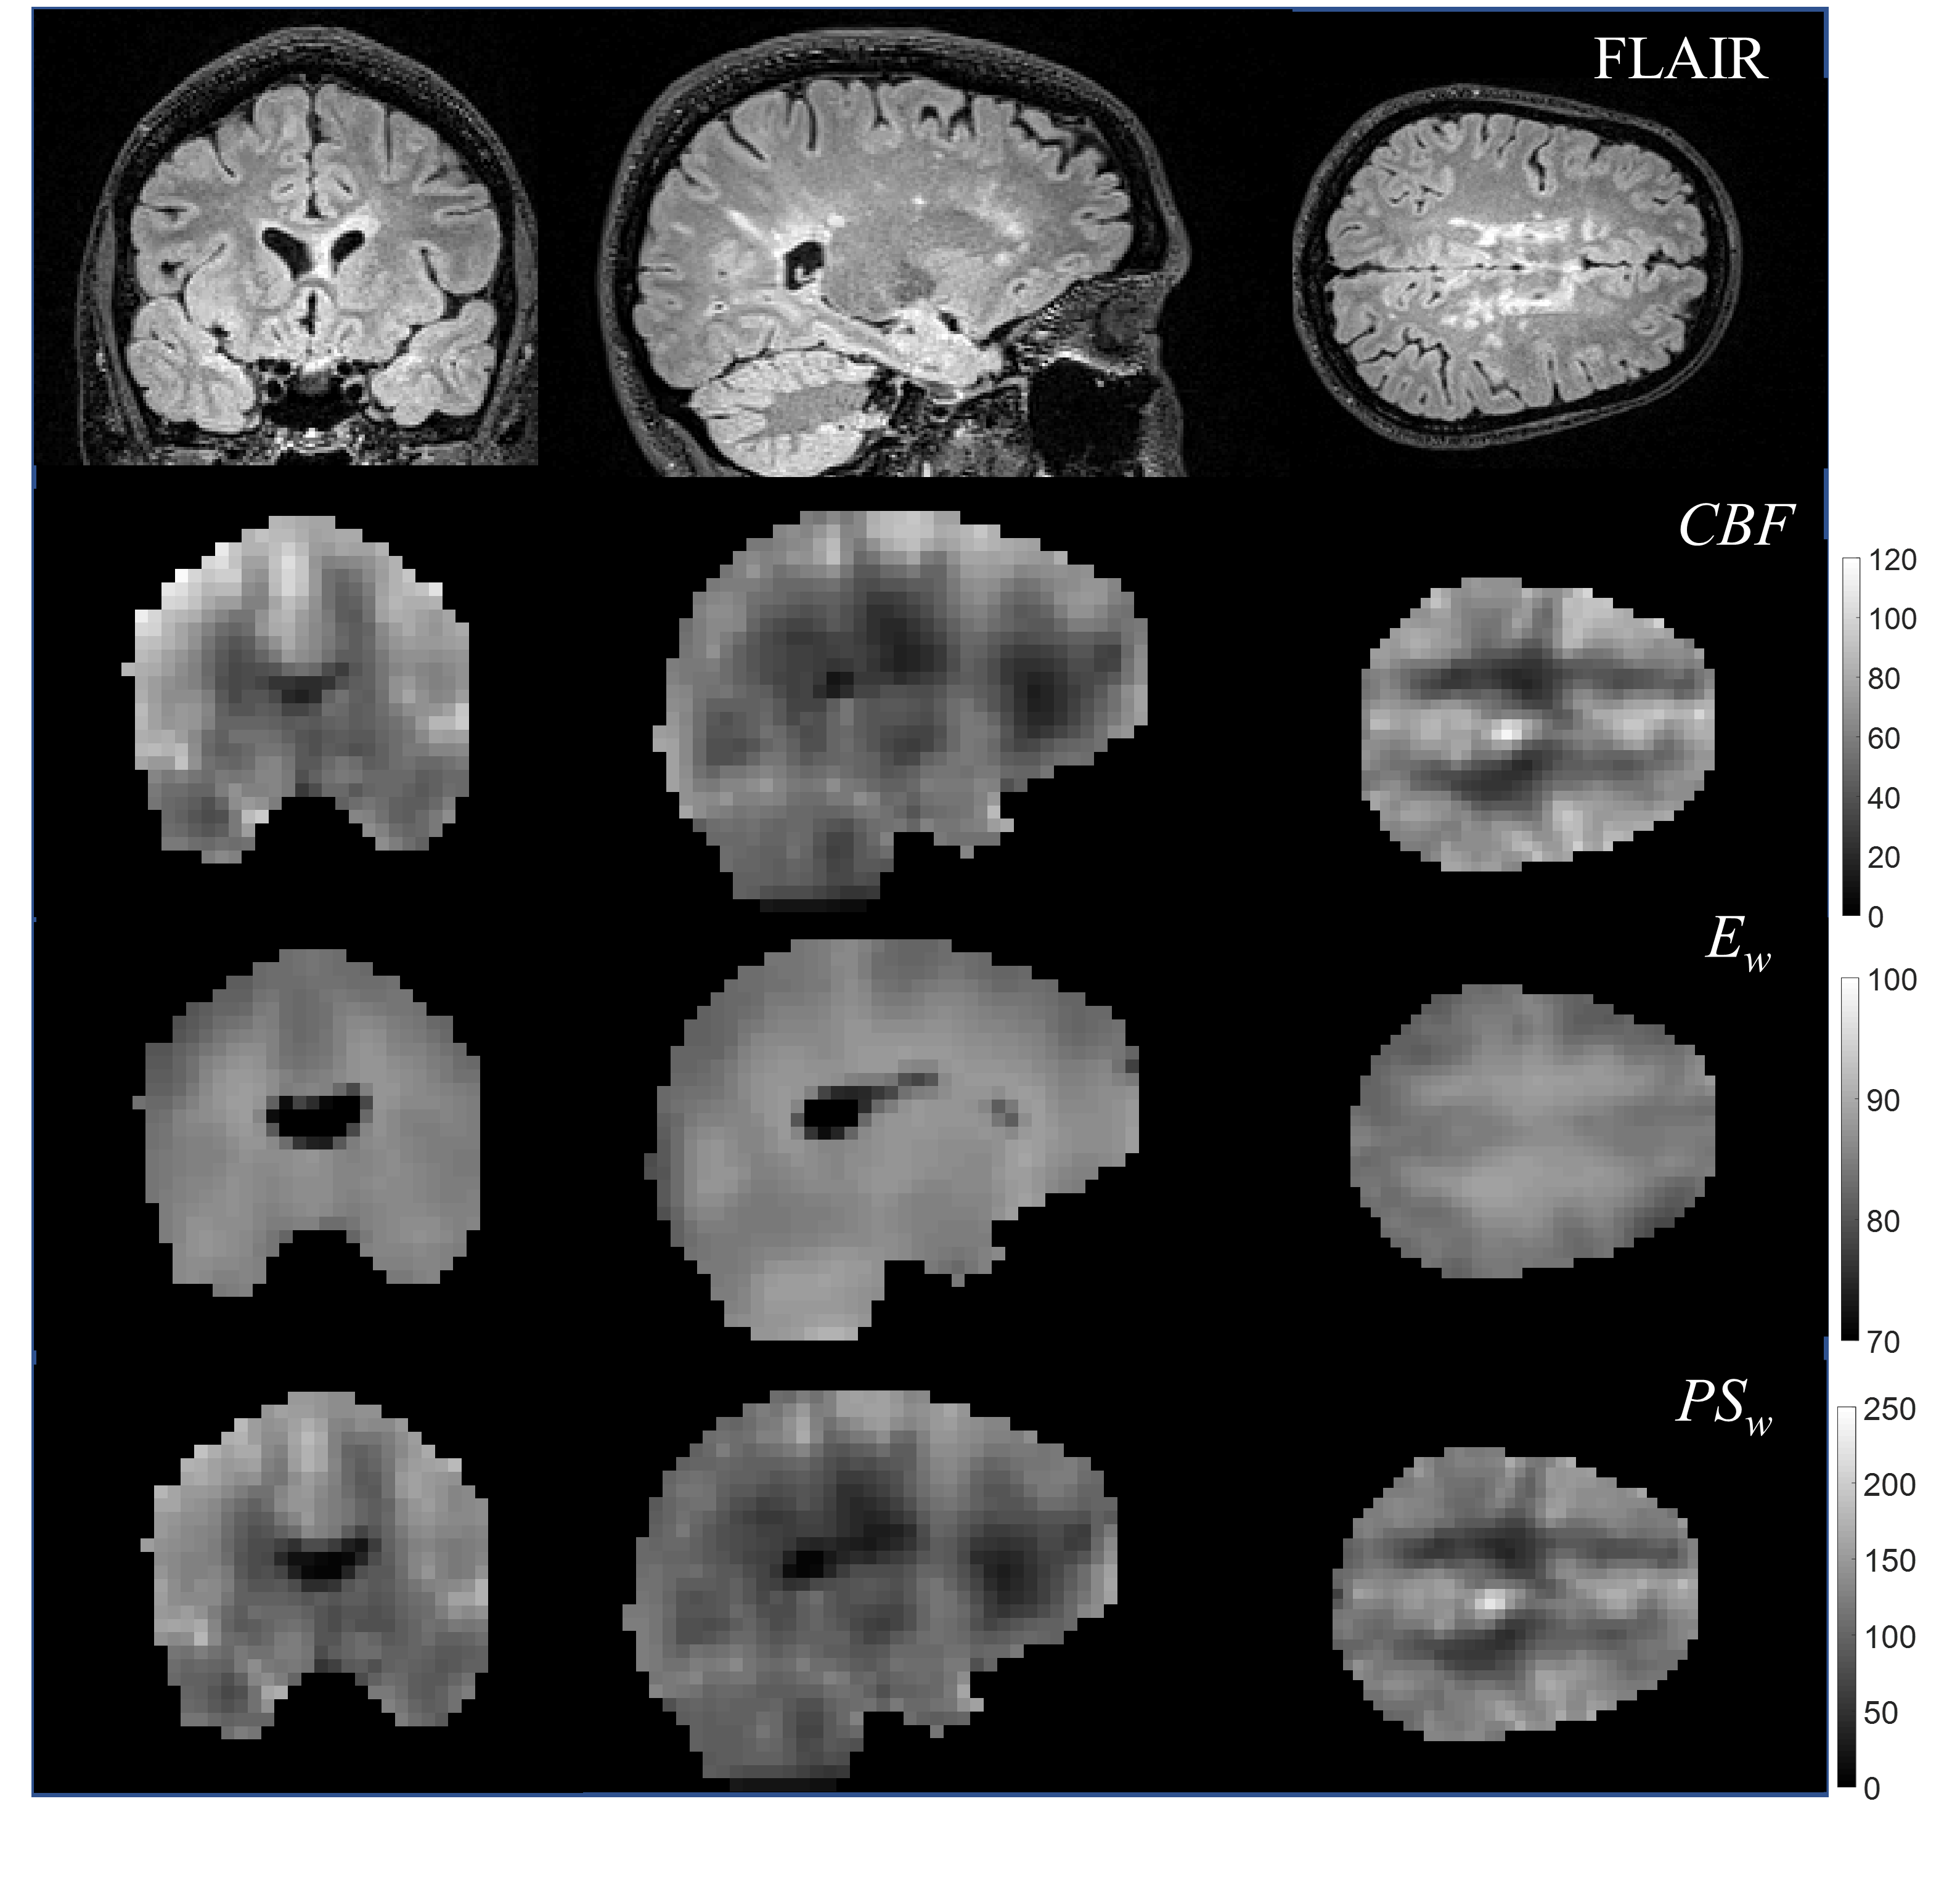
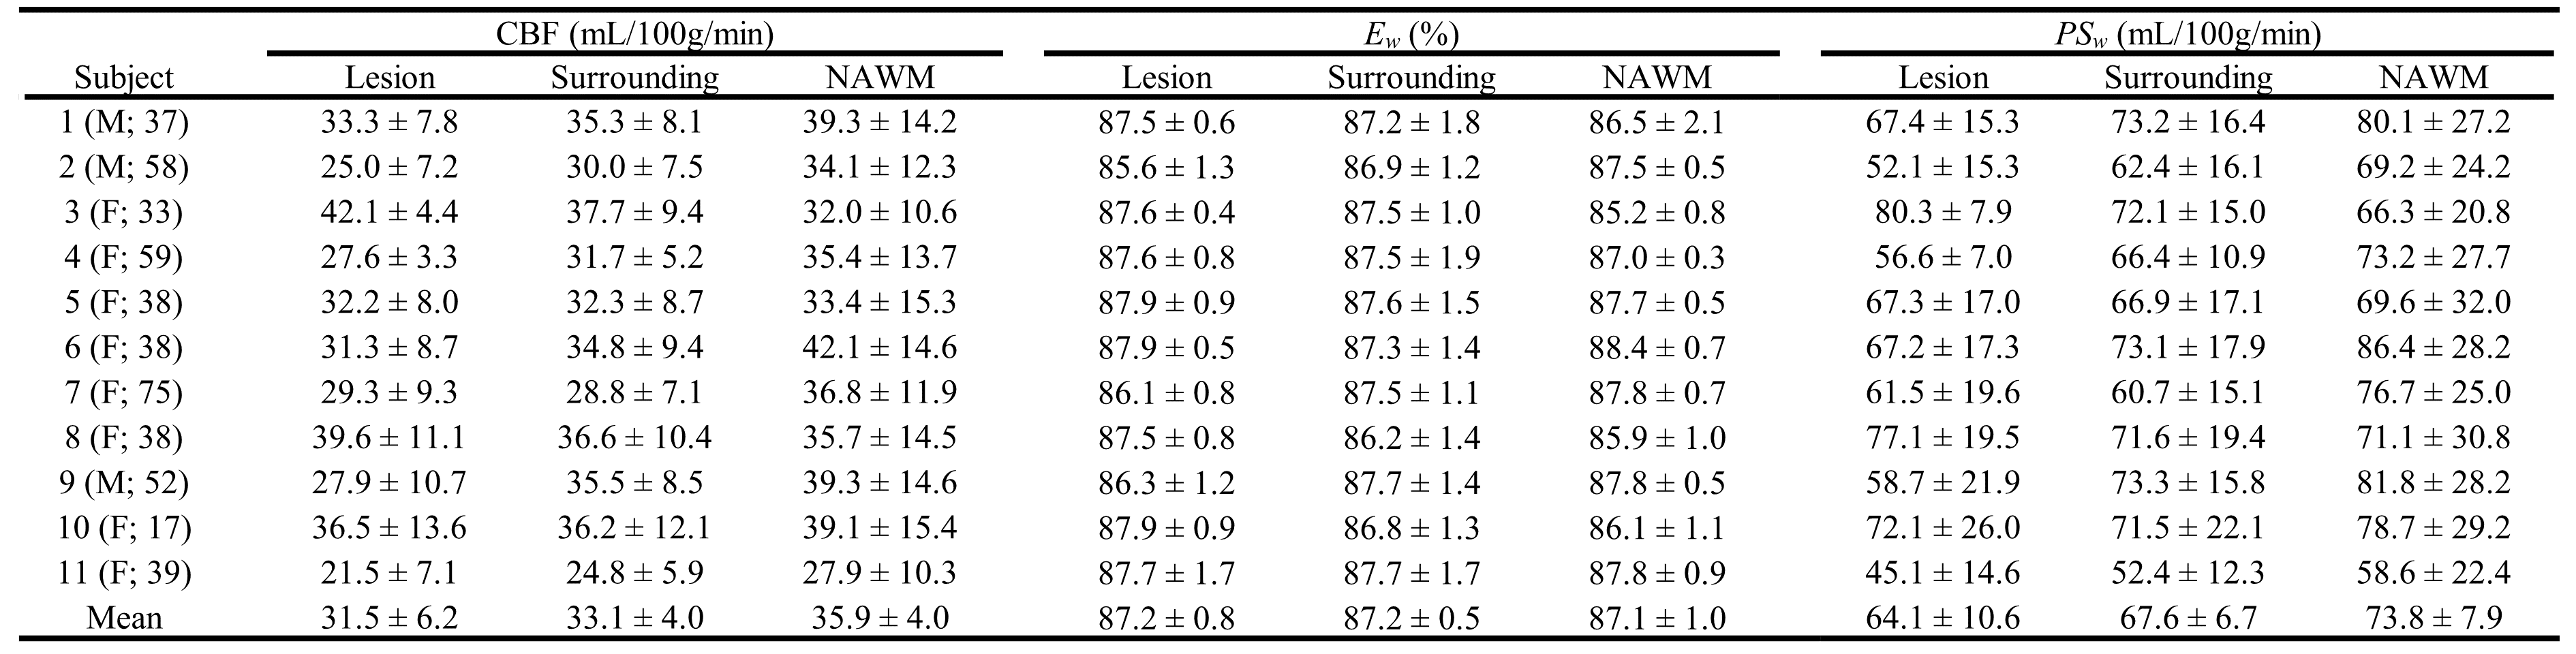
Figure 1 shows average images and rCBF maps from a representative patient. Figure 2 demonstrates the whole-brain mapping of BBB water permeability achieved with the IDEALS method. The CBF, Ew and PSw maps with corresponding T2-FLAIR image for a representative MS patient is displayed in Fig. 3. Average CBF, Ew and PSw values in MS lesions, surrounding regions and NAWM for all MS patients are listed in Table 3. The estimated CBF and PSw was significantly lower in MS lesions and surrounding regions compared to NAWM. No significant difference in Ew was observed but differences in PSw were more significant than CBF (p=0.018 vs 0.049 for lesions and p=0.006 vs 0.029 for surrounding regions).Discussion:
Although the permeability for MRI contrast in non-enhancing MS lesions is several orders of magnitude lower than that of enhancing MS lesions, our study demonstrated a robust reduction of lesion water permeability. The decreased BBB water permeability observed in MS lesions is consistent with previously reported observations and may demonstrate a link inflammation and metabolic changes associated with MS9.Conclusion:
The novel IDEALS method can non-invasively image whole-brain BBB water permeability (Ew and PSw) in MS patients. This method has the potential to elucidate the role of BBB water permeability in the development and progression of MS.Acknowledgements
No acknowledgement found.References
1. Frohman EM. Multiple sclerosis. Medical Clinics of North America. 2003;87(4):867-897.
2. Zlokovic BV. The blood-brain barrier in health and chronic neurodegenerative disorders. Neuron. 2008;57(2):178-201.
3. Hawkins BT, Davis TP. The blood-brain barrier/neurovascular unit in health and disease. Pharmacological reviews. 2005;57(2):173-185.
4. He X, Le T, Leuong H, DeLorentzo C, Rarsey R, Schweitzer M. Diffusion Sensitivity of 3D-GRASE Readout in ASL Perfusion. Paper presented at: ISMRM2015; Toronto, Canada.
5. Asllani I, Borogovac A, Brown TR. Regression algorithm correcting for partial volume effects in arterial spin labeling MRI. Magnetic Resonance in Medicine. 2008;60(6):1362-1371.
6. Wang J, Alsop DC, Song HK, et al. Arterial transit time imaging with flow encoding arterial spin tagging (FEAST). Magnetic Resonance in Medicine. 2003;50(3):599-607.
7. Renkin EM. Transport of potassium-42 from blood to tissue in isolated mammalian skeletal muscles. American Journal of Physiology--Legacy Content. 1959;197(6):1205-1210.
8. Crone C. The permeability of capillaries in various organs as determined by use of the ‘indicator diffusion’method. Acta Physiologica. 1963;58(4):292-305.
9. Rooney WD, Li X, Sammi MK, Bourdette DN, Neuwelt EA, Springer CS. Mapping human brain capillary water lifetime: high‐resolution metabolic neuroimaging. NMR in Biomedicine. 2015;28(6):607-623.
Figures