4920
Influence of Signal Magnitude on Intracranial Flow Quantification using 4D flow MRILeonardo A Rivera-Rivera1, Tilman Schubert2, Patrick A Turski1,3, Oliver Wieben1,3, and Kevin M Johnson1,3
1Department of Medical Physics, University of Wisconsin-Madison, Madison, WI, United States, 2Department of Radiology, Basel University Hospital, Basel, Switzerland, 3Department of Radiology, University of Wisconsin-Madison, Madison, WI, United States
Synopsis
Physiological parameters derived from quantitative flow MRI can potentially improve characterization of a large spectrum of vascular diseases if routinely used in a clinical setting. However, current barriers limit the use of quantitative flow MRI in a clinical setting, partially due to a lack of calibration tests, and concerns regarding accuracy and reproducibility. In this study we investigate the potential induced bias of flow measurements in a cranial 4D flow MRI acquisition due to signal magnitude heterogeneity, and the implications for comparing protocols with differing flip angle or contrast agent usage.
INTRODUCTION:
Recent advances have facilitated the use of 4D flow MRI in clinically acceptable acquisition times1, however accuracy and reproducibility are still major concerns limiting widespread clinical implementation. Velocity maps in PC-MRI are known to be susceptible to partial volume effects, arising from both low resolution and the unequal signal magnitude in background and within the vessel of interest.2 These effects are pronounced in smaller vessels such as those found in the intracranial vasculature. Such artifacts are often not readily observed from the raw data, therefore it is of importance to optimize 4D flow MRI protocols and/or correct for these effects using additional geometric modeling.3 In this study, we investigate the potential flow bias introduced by magnitude changes when using protocols with differing flip angles or contrast media (with vs without) in a cohort of healthy volunteers.METHODS:
Subjects: 13 healthy volunteers (age range 24-51y, mean=32y, 5F) participated in this study. With IRB approval and HIPAA compliance, written informed consent was obtained from all study subjects. For 9 volunteers scanning was performed before and after the administration of ferumoxytol (AMAG Pharmaceuticals, Inc., Cambridge, MA). Ferumoxytol was diluted to 60 ml and injected as a slow infusion. Images were acquired at 2 time points: pre-contrast, and after a dose of 5 mg/kg of ferumoxytol. MRI: Volumetric, time-resolved PC MRI data with 3-directional velocity encoding were acquired on a 3.0T clinical MRI system (MR750, GE Healthcare) with an 32 channel head coil (Nova Medical, Wilmington, MA, USA), with a 3D radially undersampled sequence, PC VIPR4 with the following imaging parameters: flip angle = 16˚, Venc = 80 cm/s, imaging volume = 22x22x16 cm3, 0.7 mm acquired isotropic resolution, TR/TE=5.78/1.74ms, scan time ~ 5 min, retrospective cardiac gated into 20 cardiac phases with temporal interpolation5. Four volunteers did not receive contrast agent, and were scanned four times with the same imaging parameters but varying flip angles [4˚, 8˚, 12˚, 16˚]. Flow analysis: Automatic vessel segmentation and flow quantification was performed in a customized Matlab tool6 (Mathworks, Natick, MA) from the reconstructed 4D flow MRI data. A centerline guided flow tracking algorithm was used to visualize and select the arterial segments for further analysis. Flow rates and signal of the magnitude images were calculated for each segment by averaging data obtained in five local cross-sectional cut-planes automatically placed in every centerline point perpendicular to the axial direction of the vessel. For this purpose 4 segments were selected (figure 2 a.): distal cervical internal carotid artery (ICA) (left and right), distal petrous ICA (left and right), and MCA M1 segment (left and right).RESULTS:
Figure 1 shows signal magnitude data from a volunteer shown as colormap on the maximum intensity projection (MIP) of the PC-MRA with a 4º flip angle. As the flip angle is increased the signal of the magnitude data increases near the region closer to the slab placement (distal cervical ICA), while it decreases along the ICA length and into smaller vessels (white arrow). Figure 3 shows how the flow and magnitude changes along the ICA to MCA as a function of the flip angle. A flip angle of 8˚ shows the least variation along the vessel length, while 16˚ shows the largest variation. Figure 2 shows MIP images from a different volunteer before and after the administration of 5 mg FE/kg. These images were acquired with the same parameters and a flip angle of 16˚. Post contrast images demonstrated a significantly higher SNR especially in smaller vessels when compared to the pre contrast scan. Figures 4 and 5 show box plots of the flow and magnitude signal in the pre- and post-contrast images. The flow and magnitude decreased considerably along the ICA and MCA in the pre contrast scan.DISCUSSION AND CONCLUSION:
This work demonstrates that caution should be placed when setting the flip angle for intracranial flow quantification. Theoretically, a flip angle creating flat, proton density weighted image should allow for the most accurate, although potentially noisier, flow quantification. Using a higher flip angle, can result in either an increase or decrease in the flow value as demonstrated with the increase in flow in non-contrast studies (4˚ vs 8˚) and decrease from (12˚ to 16˚). Using contrast media unifies the signal along the vasculature but is not practical in all studies and may potentially overestimate flow. Thus we recommend flip angle be set as low as reasonably allowable for maximal study reproducibility.Acknowledgements
We gratefully acknowledge R01NS066982, and GE Healthcare for assistance and support.References
- Markl M, et al. 4D flow MRI. J Magn Reson Imaging 2012; 36: 1015–1036.
- Peng SL, et al. Optimization of phase-contrast MRI for the quantification of whole-brain cerebral blood flow. J Magn Reson Imaging 2015; 42:1126–1133.
- Bouillot P, et al.3D phase contrast MRI: Partial volume correction for robust blood flow quantification in small intracranial vessels. Magn Reson Med. 2017 Feb 28. doi: 10.1002/mrm.26637
- TL Gu et al. PC VIPR: a high-speed 3D phase-contrast method for flow quantification and high-resolution angiography. AJNR 26(4):743-9 (2005).
- J Liu et al. Generation and visualization of four dimensional MR angiography data using an undersampled 3-D projection trajectory. IEEE TMI 25(2):148-57 (2006).
- Schrauben E, Wåhlin A, Ambarki K, Spaak E, Malm J, Wieben O, et al. “Fast 4D flow MRI intracranial segmentation and quantification in tortuous arteries.” J Magn Reson Imaging. 2015 Nov;42(5):1458-64.
Figures
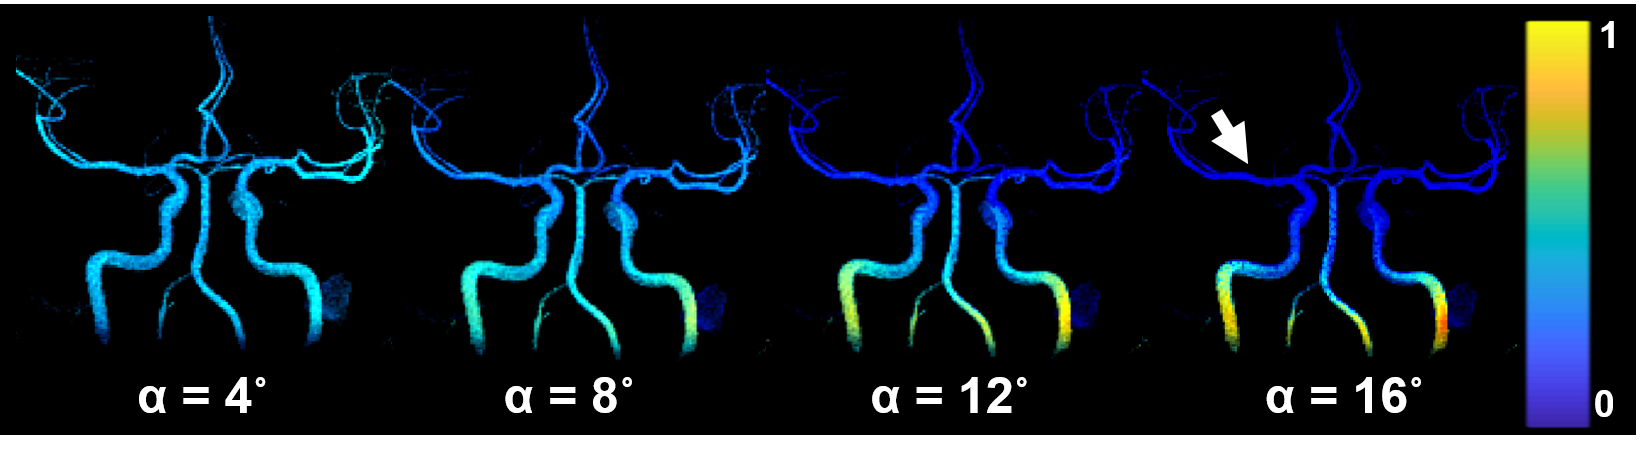
Figure 1: PC VIPR data from a volunteer shown as maximum
intensity projection (MIP) images. The intensity data difference data is from
the acquisition with 4º flip angle, and it was used to segment the vascularity
shown. However, the color maps represent the magnitude data for each of the
flip angles, and how magnitude signal changes along the vessel length. As the
flip angle is increased the magnitude signal increases near the region closer to
the slab placement (distal cervical ICA), while it decreases along the length of
the ICA and into smaller vessels (white arrow).
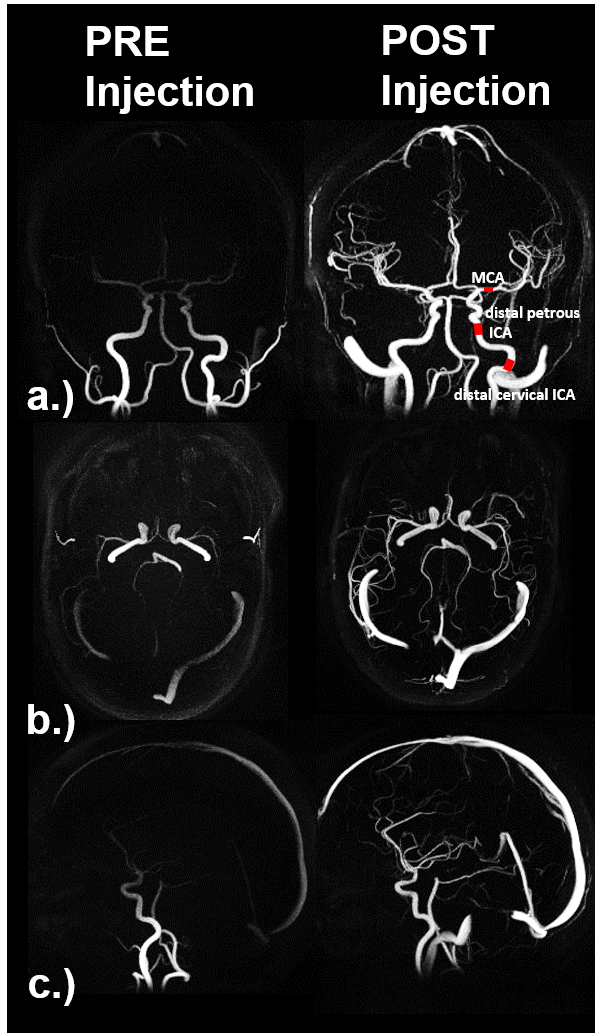
Figure 2: PC VIPR data from a different volunteer shown
pre and post ferumoxytol injection (5 mg FE/kg). The a.) coronal, b.) axial and
c.) sagittal maximum intensity projection (MIP) images of the complex
difference data shows signal dropout in smaller vessels in the pre contrast
scan acquired with a flip angle = 16˚. The post contrast images were acquired
with the same parameters as the pre contrast, but as expected small vessels do
not suffer from signal dropout at the higher flip angle.
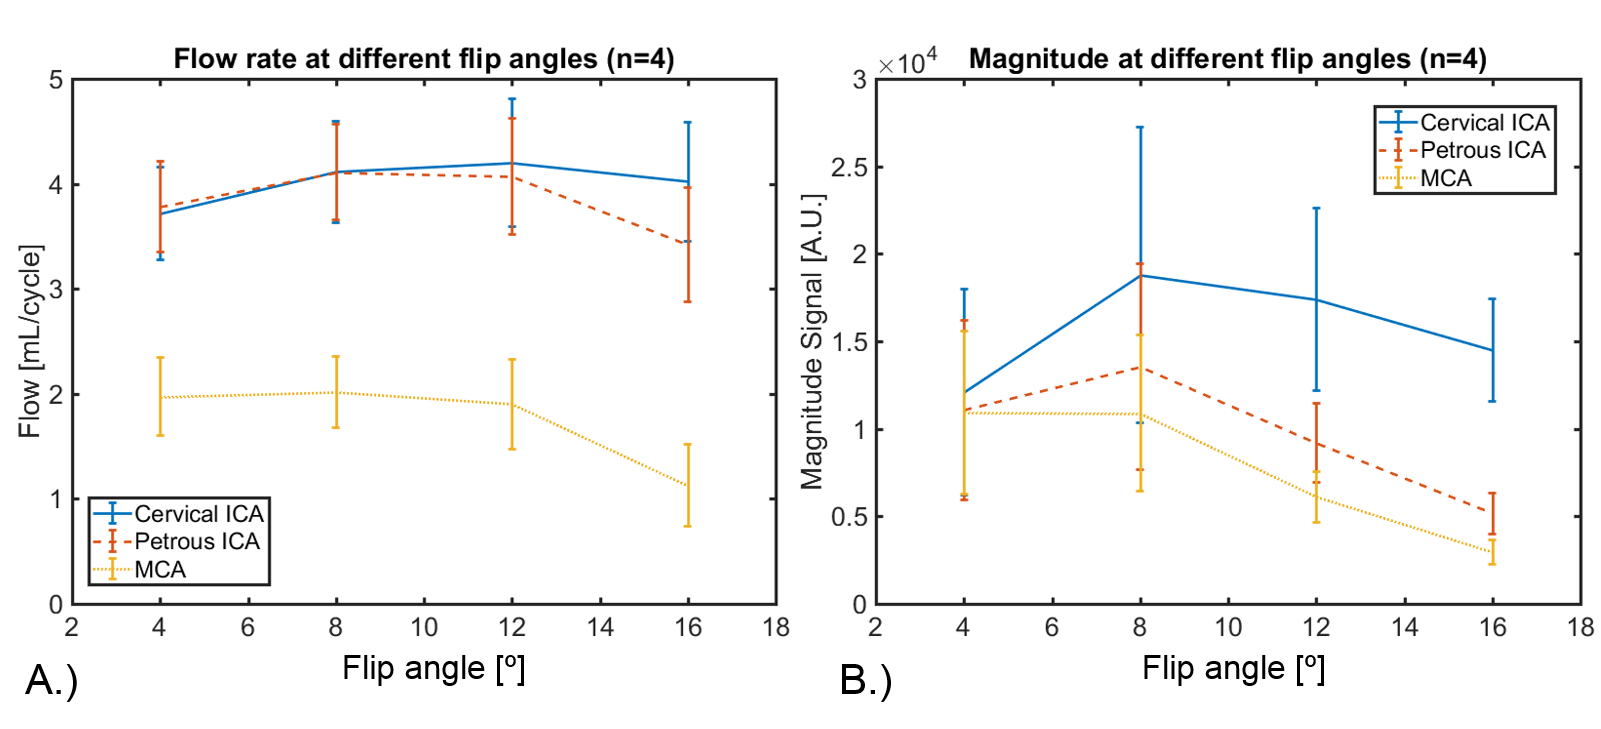
Figure 3: Sets of four images with identical parameters
but varying flip angle (4˚, 8˚, 12˚, and 16˚) were acquired in four healthy
volunteers. A.) Blood flow rates were quantified in three different anatomical
locations for each flip angle: cervical internal carotid artery (ICA), petrous
ICA, and middle cerebral artery (MCA). In addition, the magnitude images B.) were
also inspected in the same locations. Initial results showed an increase in
flow and magnitude signal within the first two flip angles (4˚ and 8˚),
followed by a considerable decrease in the magnitude signal and flow for flip
angles 12˚, and 16˚.
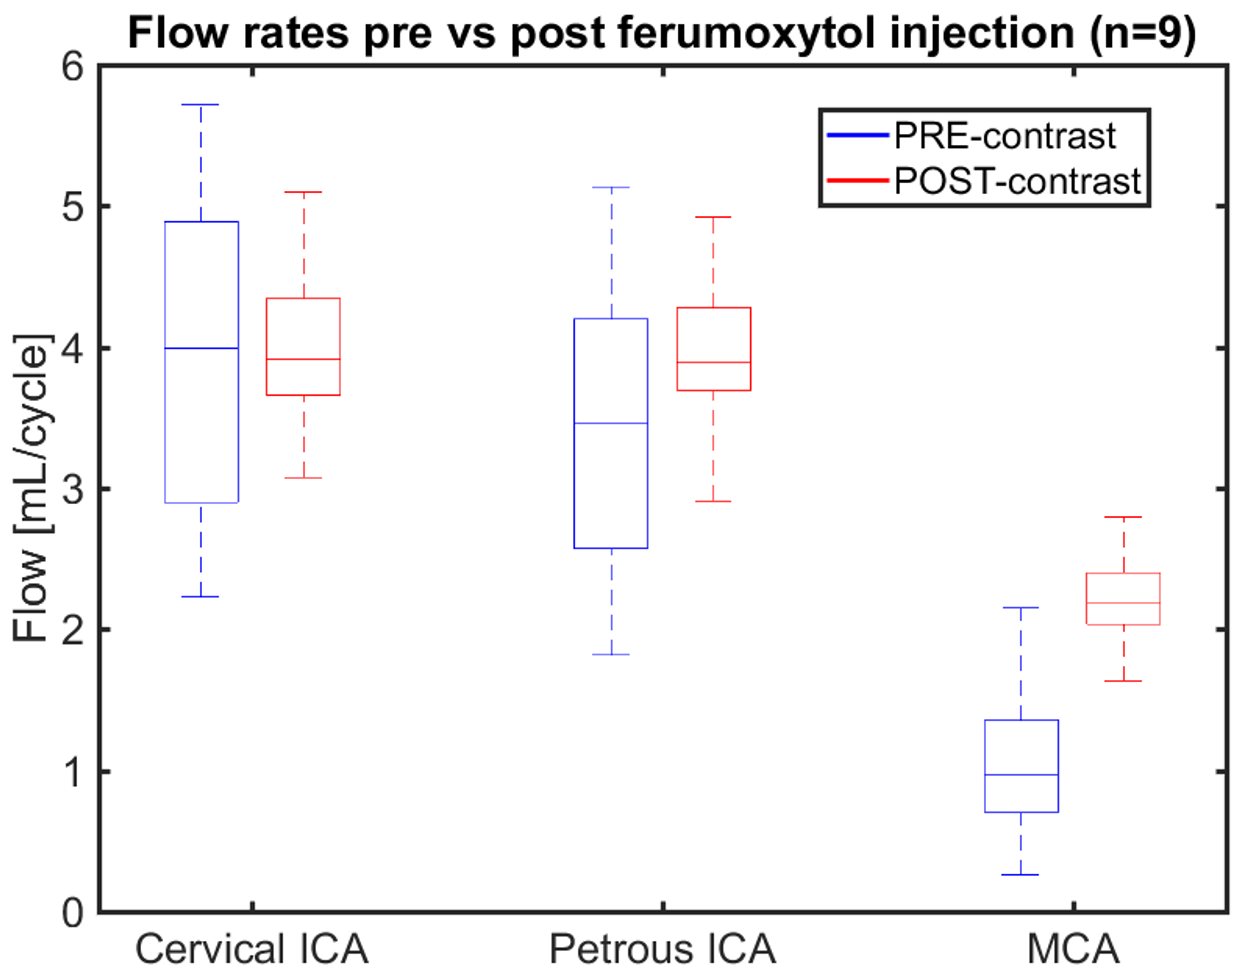
Figure 4: Box plots showing blood flow rates in healthy
volunteers (n=9) pre- and post ferumoxytol injection (5 mg FE/kg) in the
cervical ICA, petrous ICA, and MCA. Imaging parameters were equal for both
acquisitions and the flip angle was 16˚. As blood flow moved from ICA to MCA
the median value was the same at the cervical ICA, but began to decrease in the
pre contrast scans as blood moved from large to smaller vessels. In the MCA the
median blood flow was reduced to approximately 50% compared with the post
contrast scan.
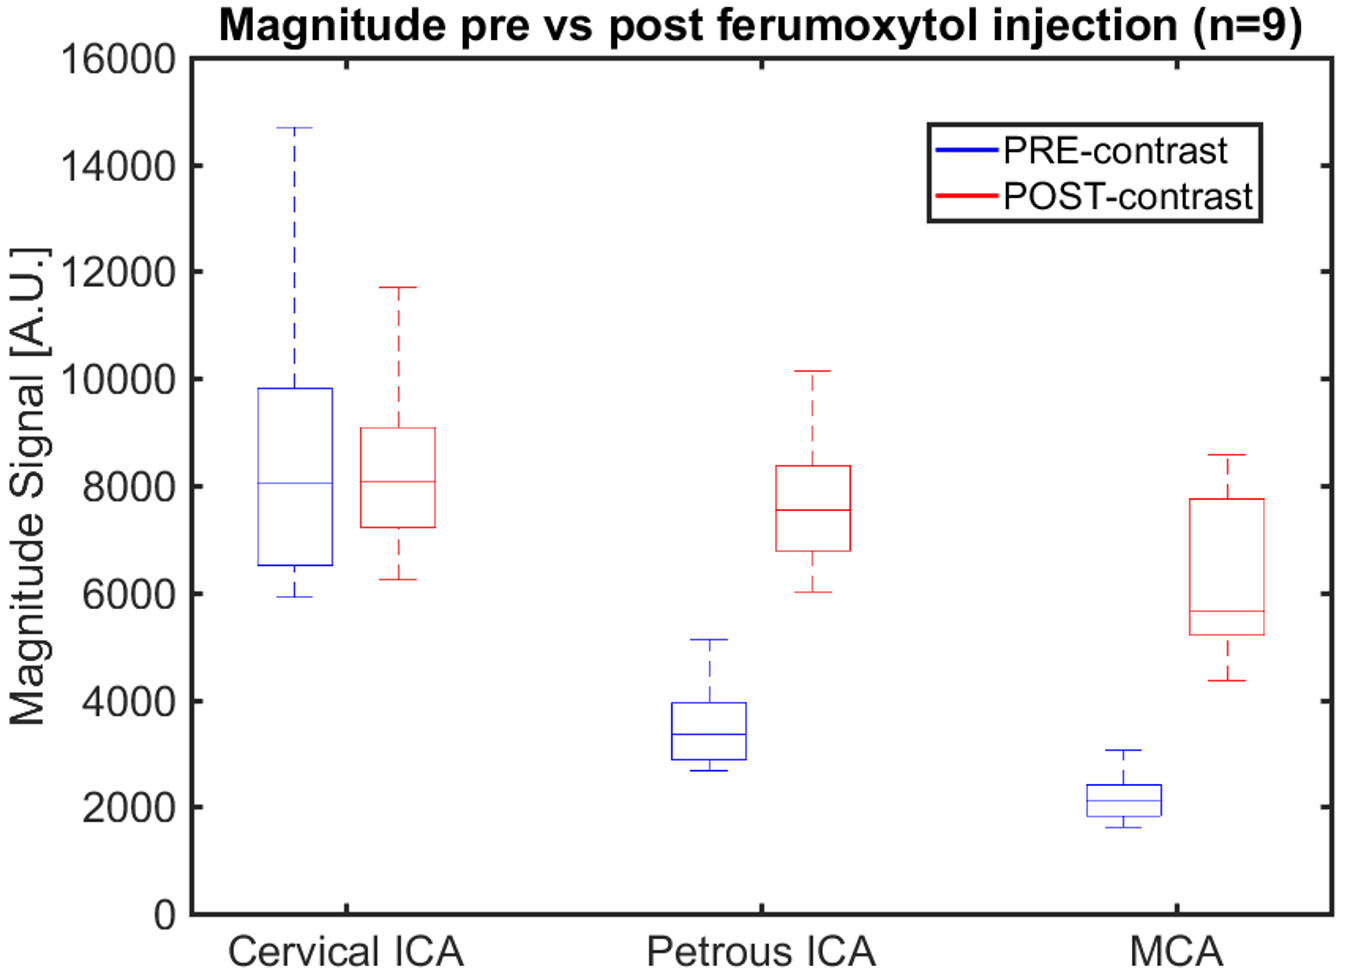
Figure 5: Box plots showing the magnitude signal in
healthy volunteers (n=9) pre- and post ferumoxytol injection (5 mg FE/kg) in
the cervical ICA, petrous ICA, and MCA. The magnitude signal follows a trend
similar to the flow rates, but a considerably larger drop in magnitude signal
can be noticed in the petrous ICA and MCA. These results suggest flow rates in
the pre contrast scan are affected by the dramatic decrease in magnitude signal
along the ICA to MCA. All parameters were the same with a flip angle of 16˚.