4919
Pseudo spiral sampling and Compressed Sensing reconstruction provides high acceleration of intracranial 4D flow MRI at 7T1Department of Radiology and Nuclear Medicine, Academic Medical Center, Amsterdam, Netherlands, 2Department of Diagnostic Radiology, Skane University Hospital, Lund, Sweden, 3Lund University Bioimaging Center, Lund University, Lund, Sweden, 4Department of Biomedical Engineering & Physics, Academic Medical Center, Amsterdam, Netherlands
Synopsis
Long scan times limit the application of 4D flow in clinical practice. Even at 7T, considerable scan times are needed for modest spatiotemporal resolutions. This work demonstrates the advantage of Compressed Sensing acceleration of 4D flow MRI at 7T with a novel undersampling technique. Healthy subjects (n=5) were scanned using standard SENSE and a proposed undersampling technique with Compressed Sensing reconstruction. Flow analysis showed minor differences, and image quality improved for Compressed Sensing reconstructions with maintained resolution and reduced scan time. The method enables further increases of acceleration and spatiotemporal resolution, adding more physiological details beyond current resolution limitations.
Introduction
Intracranial 4D flow MRI can quantify hemodynamics in the Circle of Willis (CoW), which may benefit diagnosis, treatment, and screening of vascular pathologies. Moreover, the SNR increase at 7T compared to 3T allows for improved flow visualization and quantification in intracranial arteries1. However, even with higher SNR, 4D flow acquisitions in a clinically acceptable scan time (<20 min) are still limited to a modest spatiotemporal resolution. Ideally, a spatial resolution of 0.5 mm and a temporal resolution between 50-100 ms is needed to accurately capture local hemodynamics (e.g. flow, pulsatility, and wall shear stress)2-4. To go beyond current scan time limitations, advanced acceleration techniques are needed to reduce the scan time.
Therefore, the purpose of this abstract is to investigate the benefit of Compressed Sensing5,6 (CS) accelerated 4D flow MRI at 7T in terms of image quality and acceleration.
Methods
All experiments were performed on a 7T MR scanner (Achieva, Philips, Best, The Netherlands) using a dual-channel transmit/32-channel receive head coil (NOVA Medical, Wilmington, MA, USA). The scanner software was modified to continuously sample the k-space in a pseudo spiral Cartesian fashion. Sampling profiles (ky,kz) were updated after every flow encoding segment (4$$$\times$$$TR), and together with a physiological heart rate variability, random undersampling over time could be achieved7. With this sampling strategy, designed to exploit the total variation (TV) in the CS reconstruction, retrospective binning according to trigger time created a unique variable density sampling pattern per cardiac frame (Figure 1). Furthermore, the acquired data set can be reconstructed with different temporal resolutions.
The study population consisted of healthy subjects (n=5, average age (SD) = 32.2 (7.7), 4 males) with no history of cardiovascular disease. Each subject was scanned with the proposed CS undersampling technique with acceleration factor of 8 (scan time 5:09 min), and with a standard SENSE 3.5 scan (7:42 min). A SENSE factor of 3.5 in phase encoding direction was chosen as the highest acceleration still giving acceptable image quality. For both sequences, scan parameters were: FOV 180x180x20 mm3, voxel size 0.5x0.5x0.5 mm3, TE/TR 3.0/7.0 ms, FA 8 degrees, and VENC 150 cm/s.
The acquired data was reconstructed by ReconFrame (Gyrotools, Zurich, Switzerland) and retrospectively binned in defined cardiac frames. CS reconstruction was performed using Berkeley Advanced Reconstruction Toolbox (BART)8. A sparsifying TV transform in time and a wavelet transform in space where used with regularization parameters of rTV = 0.01, rW = 0.01, and 50 iteration steps. All CS data sets were reconstructed into 6, 9, and 12 cardiac frames, resulting in final acceleration factors of 8, 12, and 16 (called CS8, CS12, CS16), respectively. SENSE data had 6 cardiac frames.
For blood flow pathline visualization, the intracranial arteries were segmented in Mimics Medical (Materialise, Leuven, Belgium)(Figure 2) and imported into GTflow (Gyrotools, Zurich, Switzerland). Flow measurements were performed in GTFlow in 4 perpendicular slices in the left and right Internal Carotid Artery as well as Middle Cerebral Artery.
Bland-Altman plots and flow curves were used to compare flow differences between CS8 and SENSE scans (6 cardiac frames), CS8 and CS12 (9 frames), and CS8 and CS16 (12 frames). The CS sets with fewer cardiac frames were linearly interpolated by a shape-preserving piecewise cubic interpolation to match the number of cardiac frames.
Results
Figure 2 compares the quality of magnitude/phase images and vessel segmentations of both scans. The CS reconstructed images contain less noise and give better contrast for the vessels, which is advantageous for sharper segmentations. Figure 3 shows a pathline flow visualization, highlighting the benefit of a higher temporal resolution. Flow comparison shows minor differences between CS8 and SENSE as well as CS for higher accelerations (CS12 and CS16) in terms of median bias (Figure 4). Furthermore, the flow curves in Figure 5 illustrate the importance of having a high enough temporal resolution to accurately capture the flow dynamics, which is only possible with high acceleration factors.Discussion
The proposed approach to continuously sample the k-space in a pseudo spiral Cartesian fashion gives the possibility to retrospectively increase the acceleration and temporal resolution to visualize physiologically relevant features, which are not visible in SENSE accelerated scans. Although no median bias in flow quantification could be observed between the scans, further investigation is needed to conclude if individual differences are due to either sequence limitations (e.g. resulting in segmentation errors) or physiological variation.Conclusion
Intracranial blood flow in the Circle of Willis at 7T can be determined with high spatial and temporal resolution in shorter scan time using a novel pseudo spiral Cartesian sampling pattern and Compressed Sensing reconstruction.Acknowledgements
This work has been supported by the Netherlands Organization for Scientific Research – NWO (HTSM2014). We thank Maarten Versluis (Philips, Best, The Netherlands) as well as Gérard Crelier and Martin Bührer (Gyrotools, Zurich, Switzerland) for their ongoing support.References
- Van Ooij P., et al. Quantification and visualization of flow in the Circle of Willis: Time‐resolved three‐dimensional phase contrast MRI at 7 T compared with 3 T. Magn. Reson. Med. 2013; 69(3):868-876.
- Wahlin A., et al. Phase contrast MRI Quantification of pulsatile volumes of brain arteries, veins, and cerebrospinal fluids compartments: Repeatability and physiological interactions. J. Magn. Reson. Imaging 2012;35:1055-1062.
- Wolf R. L., et al. Analysis of systematic and random error in MR volumetric flow measurements. Magn. Reson. Med. 1993;30:82-91.
- Petersson, et al., Assessment of the accuracy of MRI wall shear stress estimation using numerical simulations. J. Magn. Reson. Imaging 2012; 36(1):128-138.
- Lustig M, et al., Compressed Sensing MRI. Signal processing Magazine 2008; 72:1053-5888.
- Lustig M, et al., Sparse MRI: The application of compressed sensing for rapid MR imaging. Magn. Reson. Med. 2007; 58:1182-1195.
- Gottwald L, et al., Compressed Sensing accelerated 4D flow MRI using a pseudo spiral Cartesian sampling technique with random undersampling in time. Proc. Intl. Soc. Mag. Reson. Med. 25; 2017
- Uecker M, et al. Berkeley advanced reconstruction toolbox. Proc. Intl. Soc. Mag. Reson. Med. 23; 2015
Figures
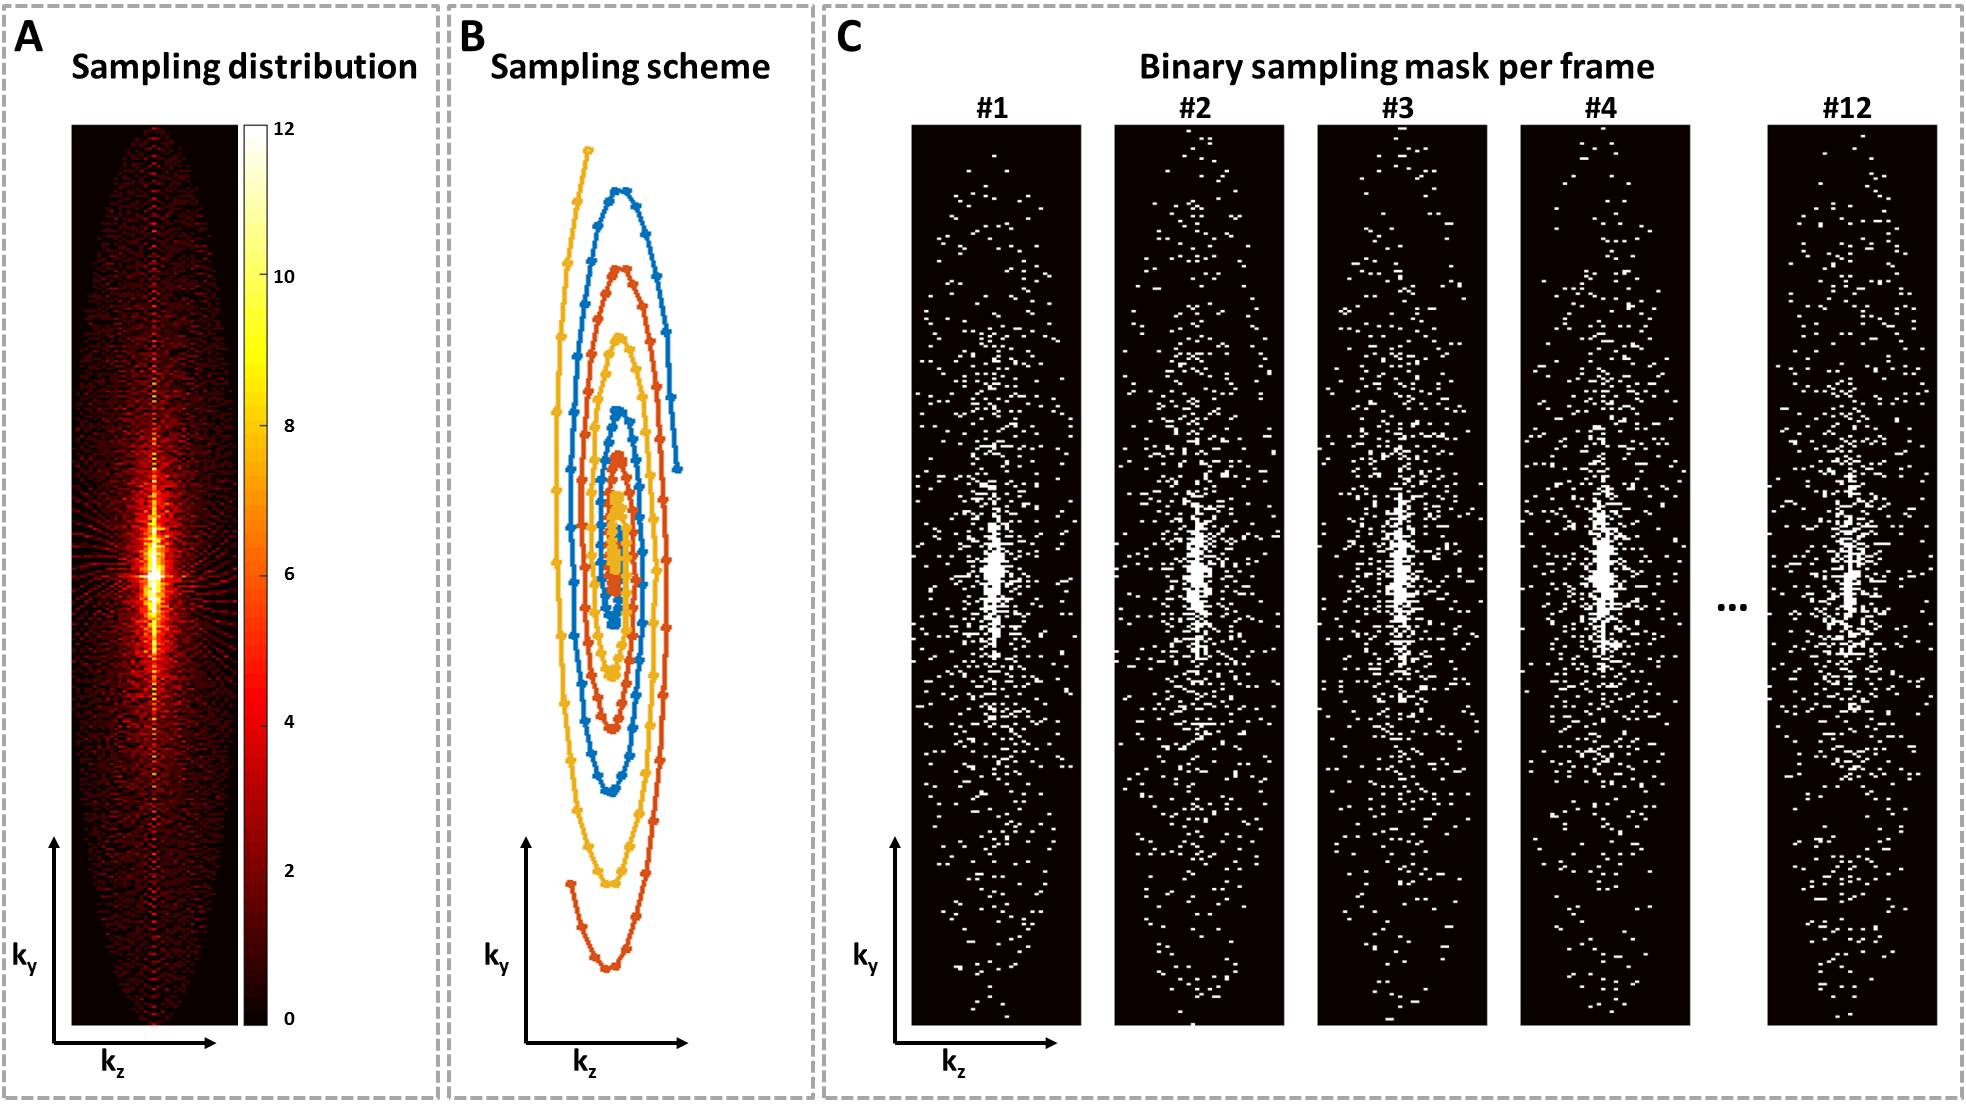
A: Sampling distribution after binning. Continuously sampling the k-space in a pseudo spiral Cartesian fashion results in a variable density distribution by design.
B: Sampling scheme illustration of 3 pseudo spirals trajectories with golden-angle increment.
C: Unique sampling masks of the different cardiac frames after binning.