4918
4D CSF Flow Measurement in Cervical Spine at 3T1ECE, University of Louisville, Louisville, KY, United States, 2Department of Radiology, University of Louisville, Louisville, KY, United States, 3Electrical and Computer Enginnering, University of Louisville, Louisville, KY, United States
Synopsis
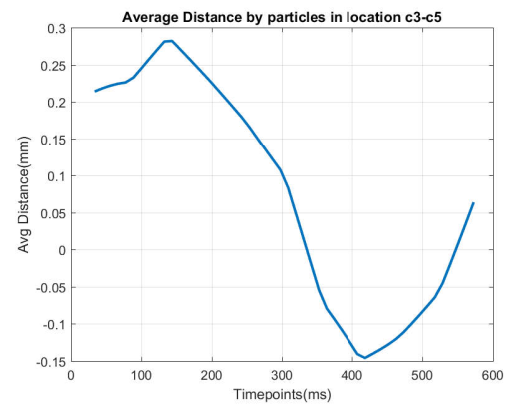
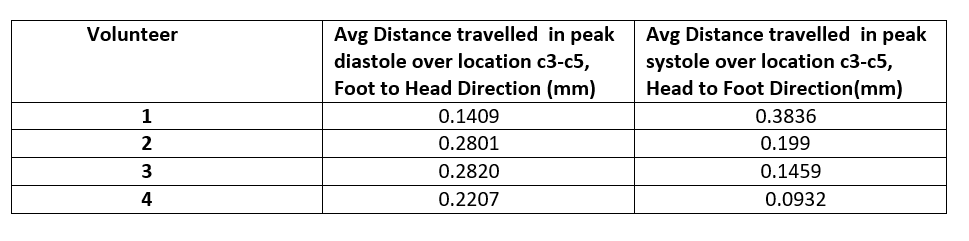
Quantitative and Qualitative analysis of CSF flow was done on a Siemens Skyra 3T Scanner. Four normal Volunteers data shows highly accurate flow waveform, average distance travelled by particle along spinal axis and clear axial and coronal flow visualization between C3-C6 in the cervical spine. Particle tracking was performed in each axial slices. Distance travelled by particles along spinal axis was measured in all volunteers. The average distance travelled in all slices during systole in the head to foot direction varied from 0.1mm to 0.38 mm and during diastole varied from 0.14mm to 0.28 mm in the opposite directions.
Introduction
Detailed analysis of cerebrospinal fluid flow is very important to detect different carniospinal diseases including hydrocephalus, chiari malformation etc. 4D phase contrast MRI makes it possible to measure flow velocity in three different axis along with cardiac phase and with a large field of view. Though CSF flow is very slow in comparison with blood flow in the body, its quantification is very important.Methods
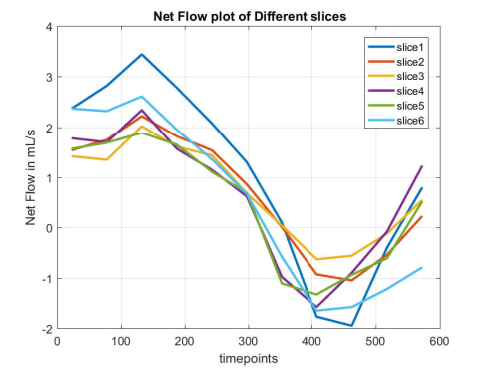
4 normal volunteers were scanned in location spanning from cervical vertebrae c3 to c6 and consisting of 6 axial slices orthogonal to the flow direction. Scanning was performed on a Siemens Skyra 3T scanner using a 20 channel head coil. Conventional 4D Cartesian techniques was applied for data acquisition. Scan parameters were as follows: FOV = 165×220×30 , TR= 54ms, TE=10ms, Flip Angle= , Venc (throughplane)=12cm/s, Venc (InPlane)= 2cm/s , In Plane Resolution= 1.15 x 1.15, Slice Thickness= 5mm, Number of Cardiac Phase= 11. All 4D flow results were visualized and analyzed by GTFlow (Gyrotools, Zurich, Swizerland). Flow waveforms were generated for slices 1-6 (C3-C6 levels). Particle tracking was performed for virtual particles on slices 2-5.Results
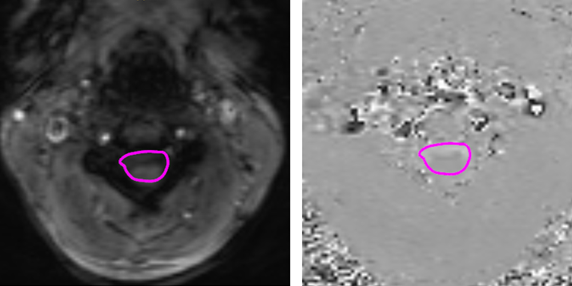
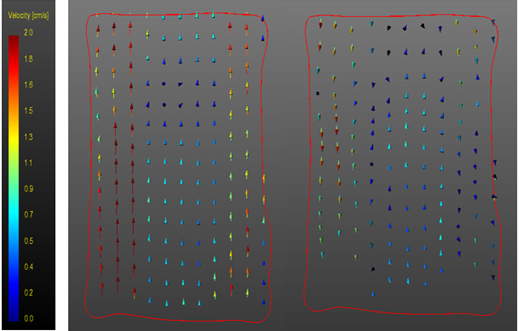
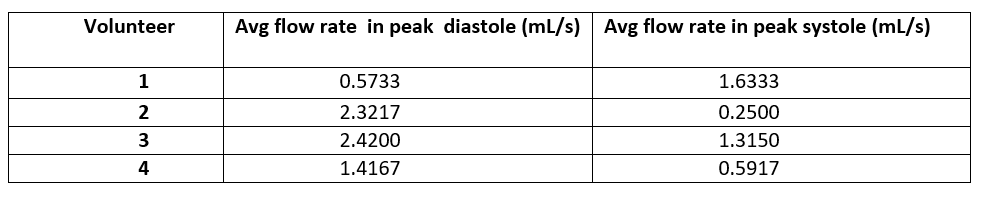
Figure 1 shows selected contour in magnitude image (left) and phase image(right) in one axial slice. Figure 2 shows flow waveform in each axial slice in a normal volunteer. Table 1 shows average flow rate over all axial slices during peak diastole and peak systole in Volunteer 1-4. Average flow in peak diastole varies from 0.57mL/s – 2.42mL/s and average flow in peak systole varies from 0.25ml/s-1.63mL/s. Figure-3 shows flow pathline in coronal slice during peak diastole and peak systole. Using particle tracking, in axial slices average distance travelled by virtual particles in the foot to head direction was measured for axial slices 2 to 5. Figure 4 shows average distance travelled by particles in one healthy Volunteer. Table 2 displays the average distance travelled by particles over axial slices 2 to 5 during peak diastole and peak systole in volunteers 1 to 4. Peak diastolic distance varied from 0.14mm to 0.28mm and peak systolic distance varied from 0.1mm to 0.38 mm in opposite directions.Discussion
In this abstract we presented initial results of 4D CSF flow measurement in the cervical spine in normal volunteers at 3T. The flow waveform and the travelled distance will prove useful in determining CSF flow abnormalities in patients.Acknowledgements
No acknowledgement found.References
[1]N. Pelc, " Rapid flow measurement using an NMR imaging system", Magnetic Resonance Imaging, vol. 11, no. 3, p. IV, 1993.
[2]B. Battal, M. Kocaoglu, N. Bulakbasi, G. Husmen, H. Tuba Sanal and C. Tayfun, "Cerebrospinal fluid flow imaging by using phase-contrast MR technique", The British Journal of Radiology, vol. 84, no. 1004, pp. 758-765, 2011.
[3]N. Hayashi, M. Matsumae, S. Yatsushiro, A. Hirayama, A. Abdullah and K. Kuroda, "Quantitative Analysis of Cerebrospinal Fluid Pressure Gradients in Healthy Volunteers and Patients with Normal Pressure Hydrocephalus", Neurologia medico-chirurgica, vol. 55, no. 8, pp. 657-662, 2015.
Figures