4917
Quantification of total cerebral blood flow measurements using phase contrast magnetic resonance imaging: Comparison and validation at 1.5T and 3T1Department of Radiology, China Medical University Hospital, Taichung, Taiwan, 2Department of Biomedical Imaging and Radiological Science, China Medical University, Taichung, Taiwan
Synopsis
The effect of field strengths of the total cerebral blood flow (TCBF) quantification using non-gated phase contrast magnetic resonance imaging (PC-MRI) was evaluated in this study. Our results show that, non-gated PC-MRI for TCBF quantification at 3T provided better inter-scan reproducibility when compared to that at 1.5T. Nevertheless, non-gated PC-MRI for TCBF measurements can be performed equally well at 1.5T and 3T. Findings of this study may facilitate data interpretation and comparison of TCBF between different field strengths.
Introduction
Exact knowledge of blood supply to the brain is of great interest because it provides important physiological information for probing cerebral function and hemodynamics such as brain development1 and cerebrovascular diseases2. Previous studies have also shown that, by using non-gated phase contrast magnetic resonance imaging (PC-MRI) to measure the flow flux at main feeding arteries of the brain such as bilateral internal carotid arteries (ICAs) and vertebral arteries (VAs), one can quantify the whole-brain cerebral blood flow (CBF) within minutes3, 4. The reduced scanning time is important for clinical applications. However, most quantitative studies on whole-brain CBF using non-gated PC-MRI to date have been performed at 3T. In clinical, many longitudinal studies as well as quantitative patient follow-up, could be limited by system changes from higher to lower field strengths since 1.5T MRI is more widely available. Whether non-gated PC MRI data acquired at different field strengths, such as 1.5T and 3T, could be merged, to our knowledge, no study of consistency across field strengths has previously been conducted. Therefore, the central goal of this study was to perform the systemic evaluations at 1.5T and 3T to assess the effect of field strengths on the quantification of total CBF (TCBF). The inter-scan reproducibility was discussed as well.Methods
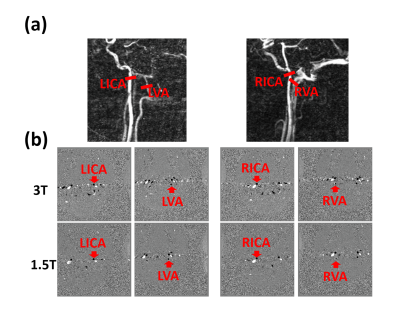
Study design: A total of 15 healthy subjects (6 females, 22.5 ± 2.5 years old) were recruited in this study. Informed consent was obtained using IRB-approved protocol. All volunteers were scanned at both a 1.5T and 3T scanners on the same day. The order of 1.5T or 3T scanning was randomized. For each field strength, every subject underwent two MRI sessions with changing the position to test the inter-scan reproducibility. MRI measurement: A non-gated 2D PC-MRI pulse sequence was implemented on two whole-body MRI units operating at 1.5T (GE, Optima MR450w, Wisconsin, USA) and 3T (GE, Signa, Excite HDxt, Wisconsin, USA). For each subject, a 2D PC MR angiogram was first performed to visualize the feeding arteries of the brain (Fig. 1a). For flow quantification, 2D cross-sectional planes were placed perpendicular to the flow through the left and right ICA (LICA and RICA) and left and right VA (LVA and RVA) at the level of foramen magnum3. Identical scanning parameters were used for both scanners, as follows: TR/TE/flip angle = 19 ms/7.2 ms/18°, spatial resolution = 0.5 x 0.5 x 5 mm3, NEX=2, and VENC = 70 cm/s. Data analysis: To compare data measured from 2 different field strengths, two-way ANOVA test with repeated measures was performed on blood flows from 4 major feeding arteries. The relationship between the TCBFs, a sum of the measurements from bilateral ICA and VA, from 2 field strengths was examined with the Pearson correlation coefficient analysis. A Bland and Altman analysis was performed to assess the degree of inter-scan reproducibility for each field strength.Results and discussion
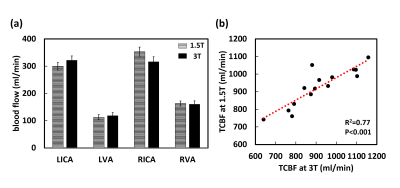
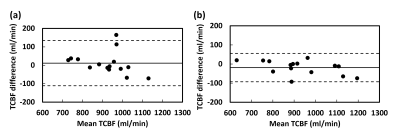
Effects of field strengths on TCBF measurements: One representative set of phase images from four feeding arteries acquired from 2 different field strengths are shown in Fig. 1(b). From the visual inspection, these phase images obtained by different field strengths have virtually identical image contrast. Two-way ANOVA with repeated measures showed that, the field strength has an insignificant effect on blood flow measurement (Fig. 2a, P=0.8). The comparisons of flow volume among four feeding arteries were not different between field strengths (Fig. 2a, P=0.18). No differences in TCBF were observed between field strengths (paired t-test, P=0.63) and regression analysis showed a strong correlation (Fig. 2b, R2=0.77, P<0.001). These findings suggest that measurements of TCBF at 1.5T is comparable with and correlated with those at 3T. Inter-scan reproducibility: Figure 3a and 3b show the Bland and Altman plots between two TCBF measurements in the two sessions (rescanning with repositioning, short-term reproducibility) from 1.5T and 3T, respectively. Due to the methodological limitations as well as intrinsic physiological fluctuations, the TCBF measurements demonstrated the slight variations between sections for both field strengths. The coefficient of variations (CoVs) for inter-scan reproducibility were respectively 3.12% and 2.24% for 1.5T and 3T. TCBF measured at 1.5T appeared to show the lower reproducibility when compared to this at 3T, but this did not reach the significant level (P=0.44).Conclusion
In conclusion, the results of this work demonstrated that non-gated PC-MRI for TCBF quantification at 3T provided better inter-scan reproducibility when compared to that at 1.5T. Nevertheless, non-gated PC-MRI for TCBF measurements can be performed equally well at 1.5T and 3T. Findings of this study may facilitate data interpretation and comparison of TCBF between different field strengths.Acknowledgements
No acknowledgement found.References
1. Liu P, Huang H, Rollins N, Chalak LF, Jeon T, Halovanic C et al. Quantitative assessment of global cerebral metabolic rate of oxygen (CMRO2) in neonates using MRI. NMR in biomedicine 2014; 27(3): 332-40.
2. Bandera E, Botteri M, Minelli C, Sutton A, Abrams KR, Latronico N. Cerebral blood flow threshold of ischemic penumbra and infarct core in acute ischemic stroke: a systematic review. Stroke 2006; 37(5): 1334-9.
3. Liu P, Lu H, Filbey FM, Pinkham AE, McAdams CJ, Adinoff B et al. Automatic and reproducible positioning of phase-contrast MRI for the quantification of global cerebral blood flow. PloS one 2014; 9(5): e95721
4. Xu F, Ge Y, Lu H. Noninvasive quantification of whole-brain cerebral metabolic rate of oxygen (CMRO2) by MRI. Magnetic resonance in medicine 2009; 62(1): 141-8.
Figures


