4915
Pulsatility and velocity in cerebral penetrating arteries in patients with carotid occlusive disease with 7T phase contrast: preliminary results1Radiology, UMC Utrecht, Utrecht, Netherlands, 2Neurology, UMC Utrecht, Utrecht, Netherlands
Synopsis
The direct contribution of hemodynamics to the development and progression of vascular cognitive impairment (VCI) is relatively unexplored due to technical challenges concerning the assessment of hemodynamic properties of small vessels. This ongoing study explores changes of hemodynamics by measuring the velocity and pulsatility of perforating arteries in patients with internal carotid artery disease and healthy controls. The preliminary results indicate that high resolution velocity and pulsatility measurements in patients are challenging, particularly due to motion related artefacts. Thus, future research will evaluate user independent analysis to reduce the influence of artifacts and assess test-retest agreement by repeated scanning.
Introduction
Although it is known that conditions like heart failure and carotid occlusive disease (COD) are associated with cognitive impairment, the direct contribution of hemodynamics to the development and progression of vascular cognitive impairment (VCI) is relatively unexplored (1). This is mainly due to technical challenges regarding the assessment of hemodynamic properties of small vessels. Therefore, the aim of this research is to explore changes of hemodynamics in patients with small vessel disease. Recent research has shown that it is possible to assess velocity and pulsatility in the cerebral perforating arteries (2,3). This work presents preliminary results from an ongoing study in which the velocity and its pulsatility of perforating arteries is measured in patients with internal carotid artery (ICA) occlusion. We test this using phase contrast quantitative flow (2D Qflow) in the semioval centre (CSO), basal ganglia (BG) and in the proximal M1 segment of the middle cerebral arteries (MCAs) at 7T MRI.Methods
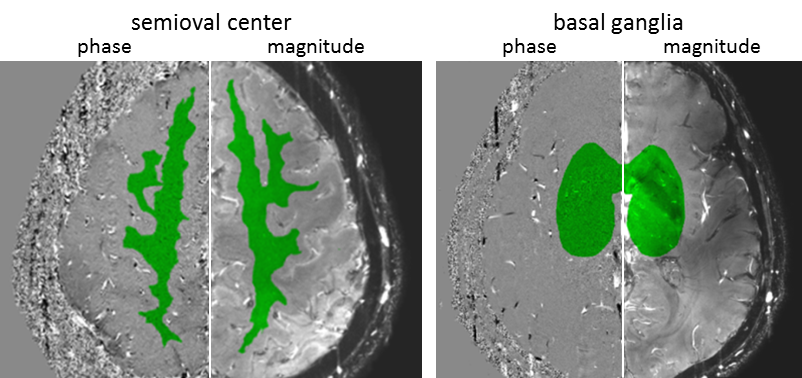
9 patients (64.9±5.5, 8 male) with a one-sided ICA occlusion and 8 healthy volunteers (66.6±9.4, 5 male) were recruited. Written informed consent was obtained from all patients and controls. All subjects were scanned with a 7T MRI (Philips) with 32 ch receive head coil (Nova Medical). All scans were retrospectively gated using a peripheral pulse oximeter for synchronization with the heart cycle. Blood flow velocities were measured as previously described (2,3) in the perforating arteries in the CSO and BG using a 2D single-slice Qflow sequence with the following parameters for the CSO: FOV=250x250mm2, voxels=0.3x0.3x2.0mm3, velocity encoding (Venc)=4cm/s, SENSE=1.5, 14-15 reconstructed heart phases. For the BG these parameters are: FOV=250x169mm2, voxels=0.3x0.3x2.0mm3, Venc=20cm/s, 10-15 reconstructed heart phases. The velocity in the proximal M1 segment of the MCA was measured using a 2D Qflow sequence with the following parameters: FOV=250x200mm2, voxels=0.5x0.5x3.0mm3, Venc=120cm/s, 13-14 reconstructed heart phases. When necessary, phase unwrapping was performed. Processing steps are as described before (2,3). In brief: i) phase correction of the velocity measurements by estimating the background phase offset from the mean, ii) estimation of the signal-to-noise ratio (SNR) of the velocity measurements by calculating its standard deviation (SD) from the SNR of the magnitude images, iii) manually identifying a region of interest on each 2D PCA slice. Voxels which did not include zero velocity in the 95% confidence interval (CI) at any time point in the cardiac cycle were regarded as vessels. From these vessels the average velocity over the cardiac cycle was calculated and a normalized pulsatility index (PI) was computed. Within patient comparisons were done, comparing the hemisphere ipsilateral to the occluded ICA to the opposite hemisphere, averaging over all vessels in a single hemisphere. Besides, comparisons between patients and healthy controls were performed taking the average values over both hemispheres. All statistical tests consisted of two tailed t-tests, which were paired for the within patients analysis and unpaired otherwise (significance level: p<0.05).Results and discussion
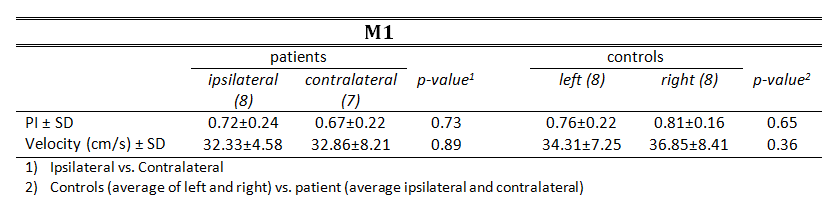
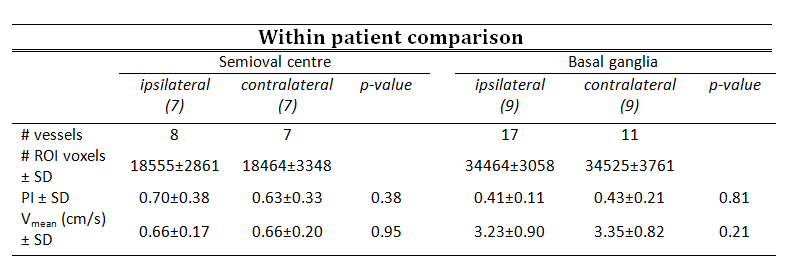
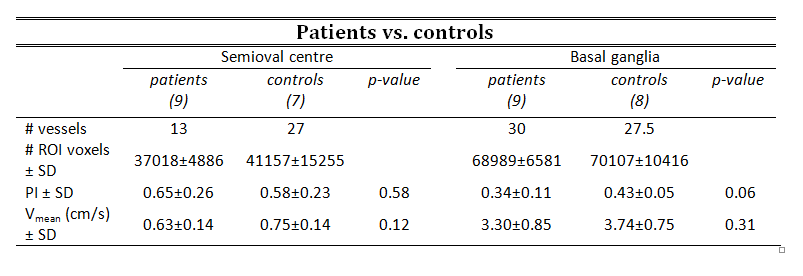
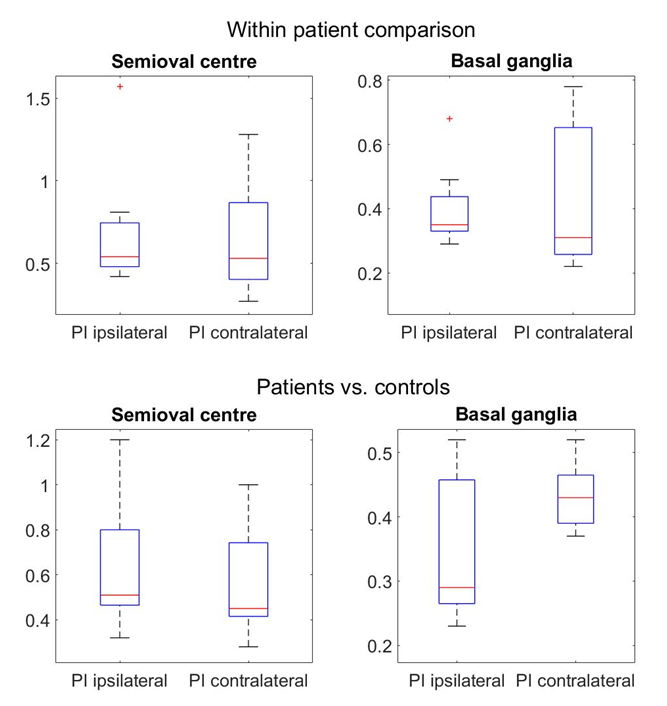
For the within patient comparison in the CSO, two patients were excluded because no perforating arteries were found in either the ipsilateral or contralateral hemisphere, and one healthy control was excluded from the within patient analysis due to an absent CSO scan. For the M1s, one ipsilateral and one two contralateral M1s were excluded due to bad image quality or absent QF scans. Concerning within patient analysis, there were no significant differences in the mean velocity over all perforating arties (Vmean) or PI between the ipsilateral and contralateral hemispheres for the M1 (Table 1), the penetrating arteries in the BG or in the CSO (Table 2). The results regarding the PI are further visualized in Figure 2. Also, no differences between controls and patients were observed (Table 3). For the CSO as well as the BG, patients show a larger variability in Vmean and PI then the healthy controls. The absence of a significant difference within patients and between patients and controls is probably due to limited power in this preliminary analysis. The larger variability and lower ROIs in the patients reflect the lower scan quality of patients compared to healthy controls, mainly due to movement of the patient during scanning. This can affect the number of perforating arteries detected and their velocity and pulsatility.Conclusion
Our preliminary results show that high resolution velocity and pulsatility measurements in patients is challenging, particularly for distinguishing between potential pathophysiological effects and motion-related artefacts. Thus, future research will evaluate user independent analysis to reduce the influence of artifacts (i.e. motion and physiological noise) and assess test-retest agreement by repeated scanning.Acknowledgements
This work was supported by the European Research Council, ERC grant agreement nᵒ337333 (JZ) and by the Horizon 2020 program of the European Union, grant agreement n°666881.References
(1) Bakker FC, Klijn CJ, Jennekes-Schinkel A, Kapelle LJ. Cognitive disorders in patients with occlusive disease of the carotid artery: a systematic review of the literature. J Neurol 2000, September;247(9):669-76.
(2) Bouvy WH, Geurts LJ, Kuijf HJ, Luijten PR, Kapelle LJ, Biessels GJ, Zwanenburg JJM. Assessment of blood flow velocity and pulsatility in cerebral perforating arteries with 7-T quantitative flow MRI. NMR Biomed 2016:29:1295-1304.
(3) Geurts LJ, Biessels GJ, Luijten PR, Zwanenburg JJM. Better and faster velocity pulsatility assessment in cerebral white matter perforating arteries with 7T quantitative flow MRI through improved slice profile, aquisition scheme and postprocessing. Magn. Reson. Med. doi:10.1002/mrm.26821.
Figures