4896
Influence of respiration-induced B0 variations in CSF flow quantification1Institute of Diagnostic and Interventional Radiology, University Hospital Cologne, Cologne, Germany, 2Philips GmbH Healthcare, Hamburg, Germany
Synopsis
Susceptibility changes and resulting B0 changes during the respiratory cycle lead to phase variations in cerebrospinal fluid phase-contrast flow measurements and might be erroneously misinterpreted as physiological flow changes. These B0 changes were analysed by acquiring flow compensated and flow encoded real-time, single-shot EPI images. The respiration-induced phase variations in phase-contrast images were found to depend on the magnetic field strength, the delay between the flow compensated and flow encoded images and the depth and frequency of respiration. Thus, respiration-induced B0 variations need to be corrected prior to analysing true respiration-dependent cerebrospinal fluid flow measured by real-time phase-contrast MRI.
Introduction
Due to the cardiac-driven pulsatility of cerebrospinal fluid (CSF) flow, phase-contrast (PC) measurements are typically cardiac gated1–3. Recent studies also showed an apparent respiration dependency of CSF hydrodynamics using real-time flow measurements4–6. Along another line of research, respiration induced B0 variations were investigated in the human spinal cord7. We herewith hypothesise that respiration-induced B0 variation, which are typically not accounted for in PC flow measurements of the CSF, can be erroneously misinterpreted as physiological, respiratory-induced flow changes. Measurements and simulations lead to the conclusion that respiratory-induced B0 variations have similar orders of magnitude as the previously described apparent respiration-dependency of CSF flow.Methods
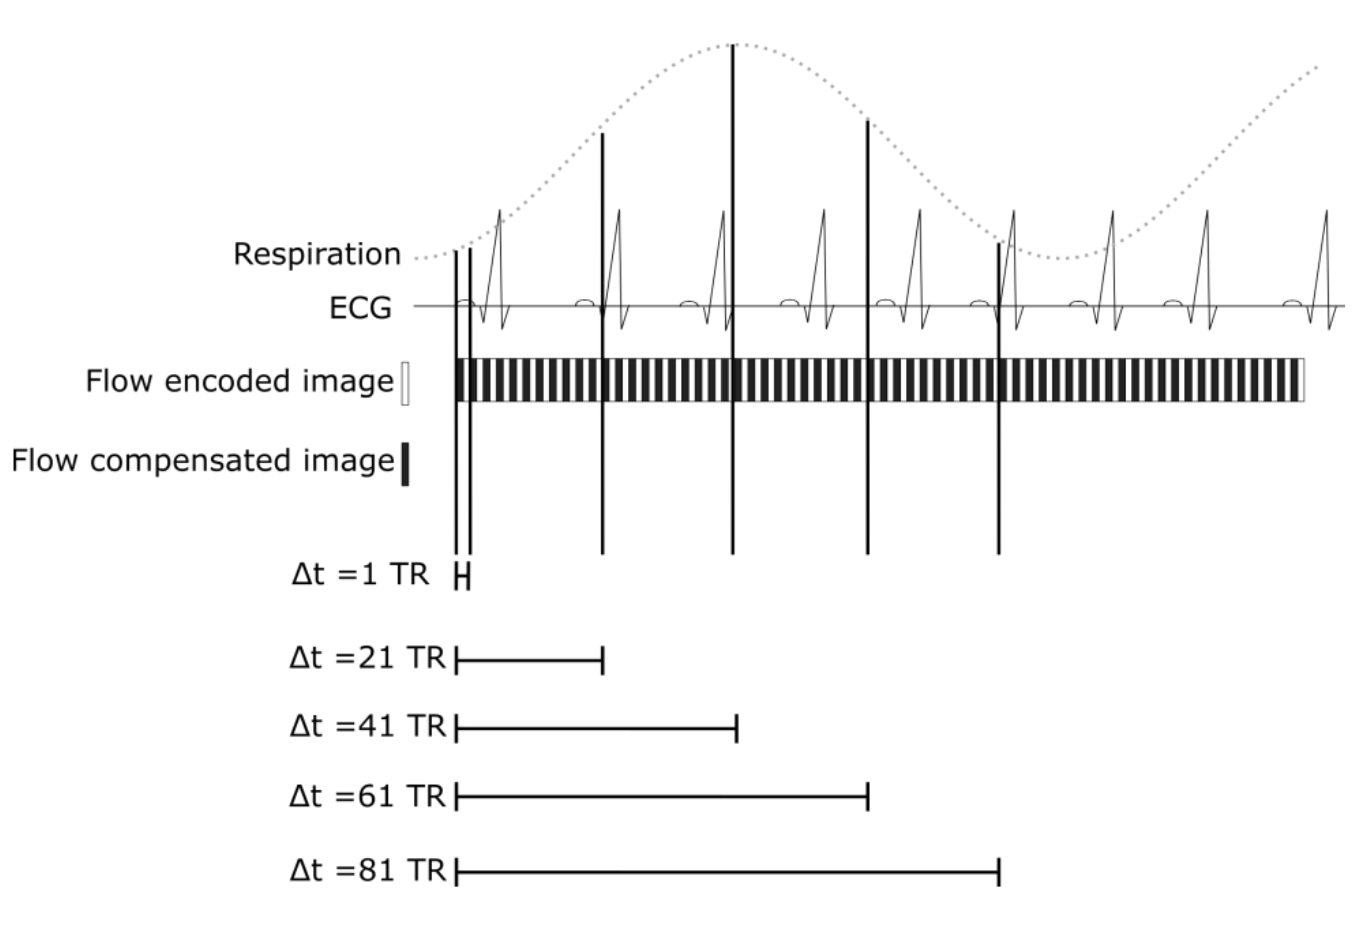
Real-time single-shot EPI PC scans were acquired in 5 healthy volunteers in a 2D slice at the level of the C3 vertebrae during normal free-breathing. Imaging parameters were as follows: TR: 30ms, TE: 12ms, resolution: 2.5x2.5mm, slice thickness: 8mm, matrix size: 128x128, SENSE factor: 2, EPI factor: 45. During a 60s acquisition time, 1000 dynamics were acquired. Flow compensated and through-plane flow encoded images were acquired in a TR interleaved order, leading to a temporal resolution of 60ms. Corresponding PC images were reconstructed. Variations on the reconstructions were evaluated by varying the time delay between both phase images used to reconstruct the PC images (Figure 1). Respiratory motion was recorded using an air-cushion belt. The scans were performed with two different encoding velocities (VENC) of 15cm/s and 30cm/s. All volunteers were acquired at 3T whereas one volunteer was, for comparison, additionally measured at 1.5T (Ingenia, Philips Medical Systems, Best, The Netherlands).
All flow compensated and flow encoded images were analysed separately by quantifying phase variations in one region of interest (ROI) in static tissue and one ROI in the CSF.
Results
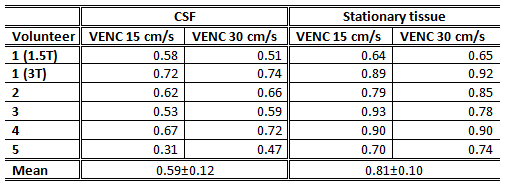
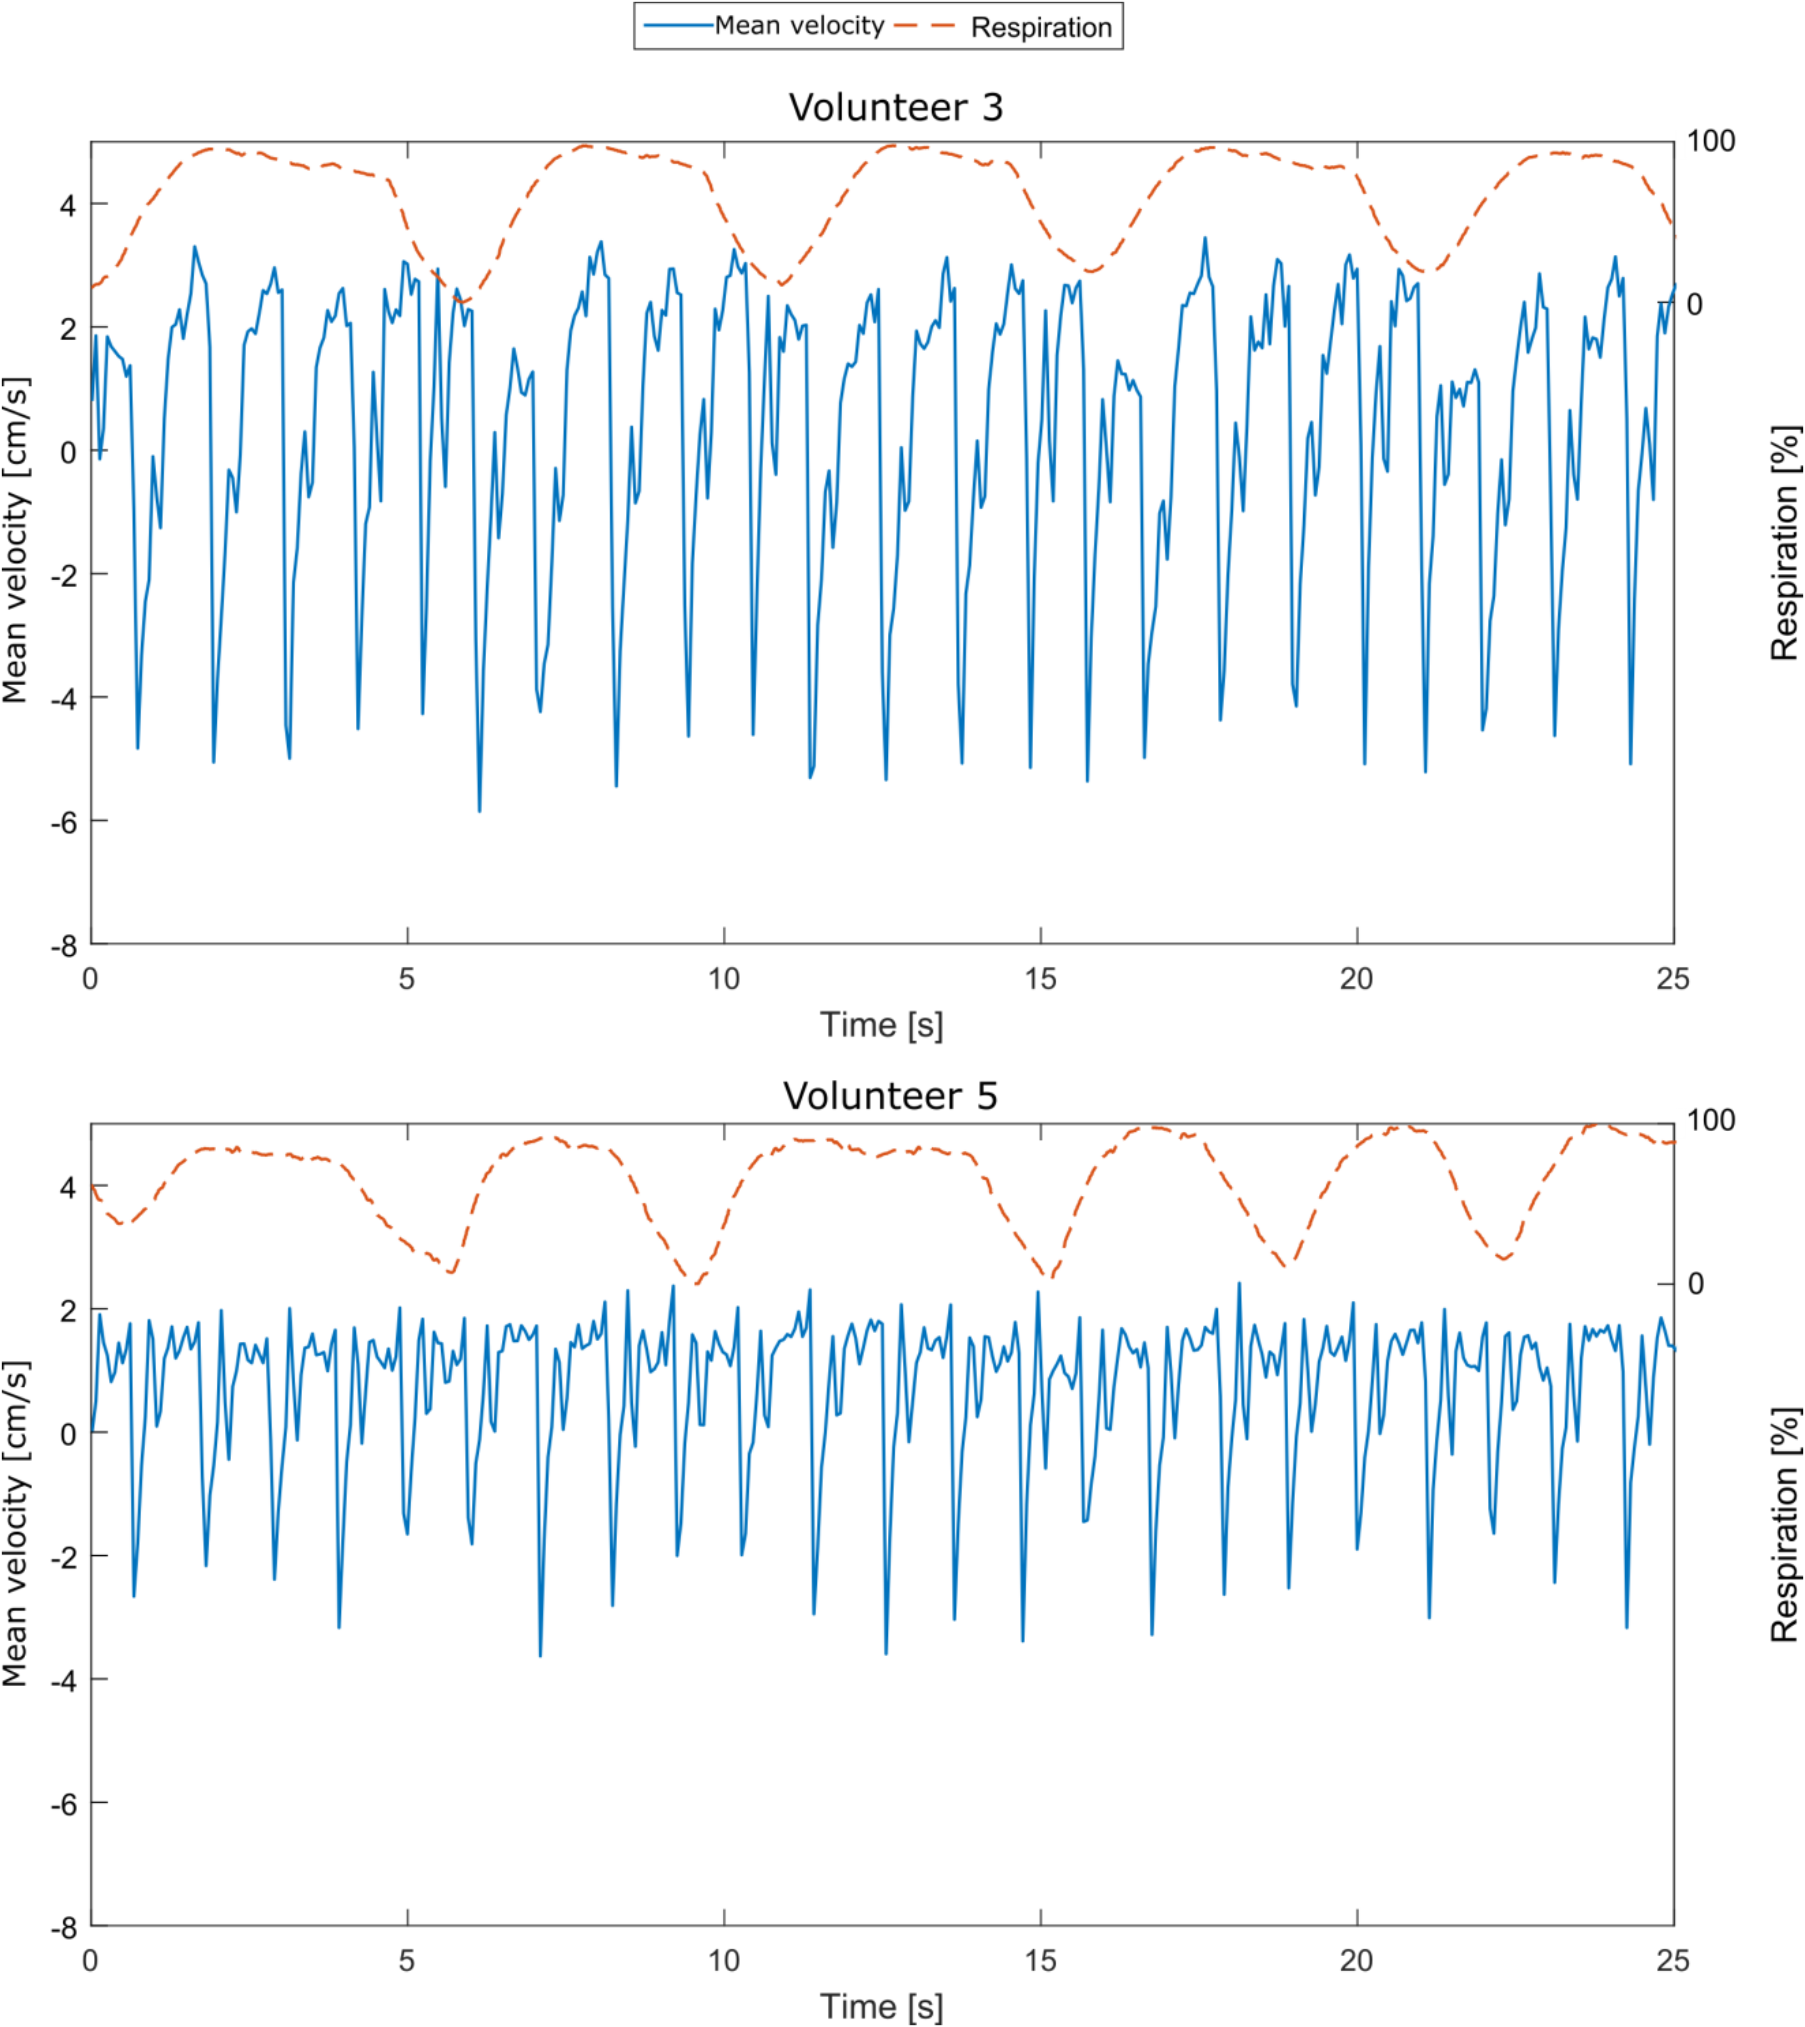
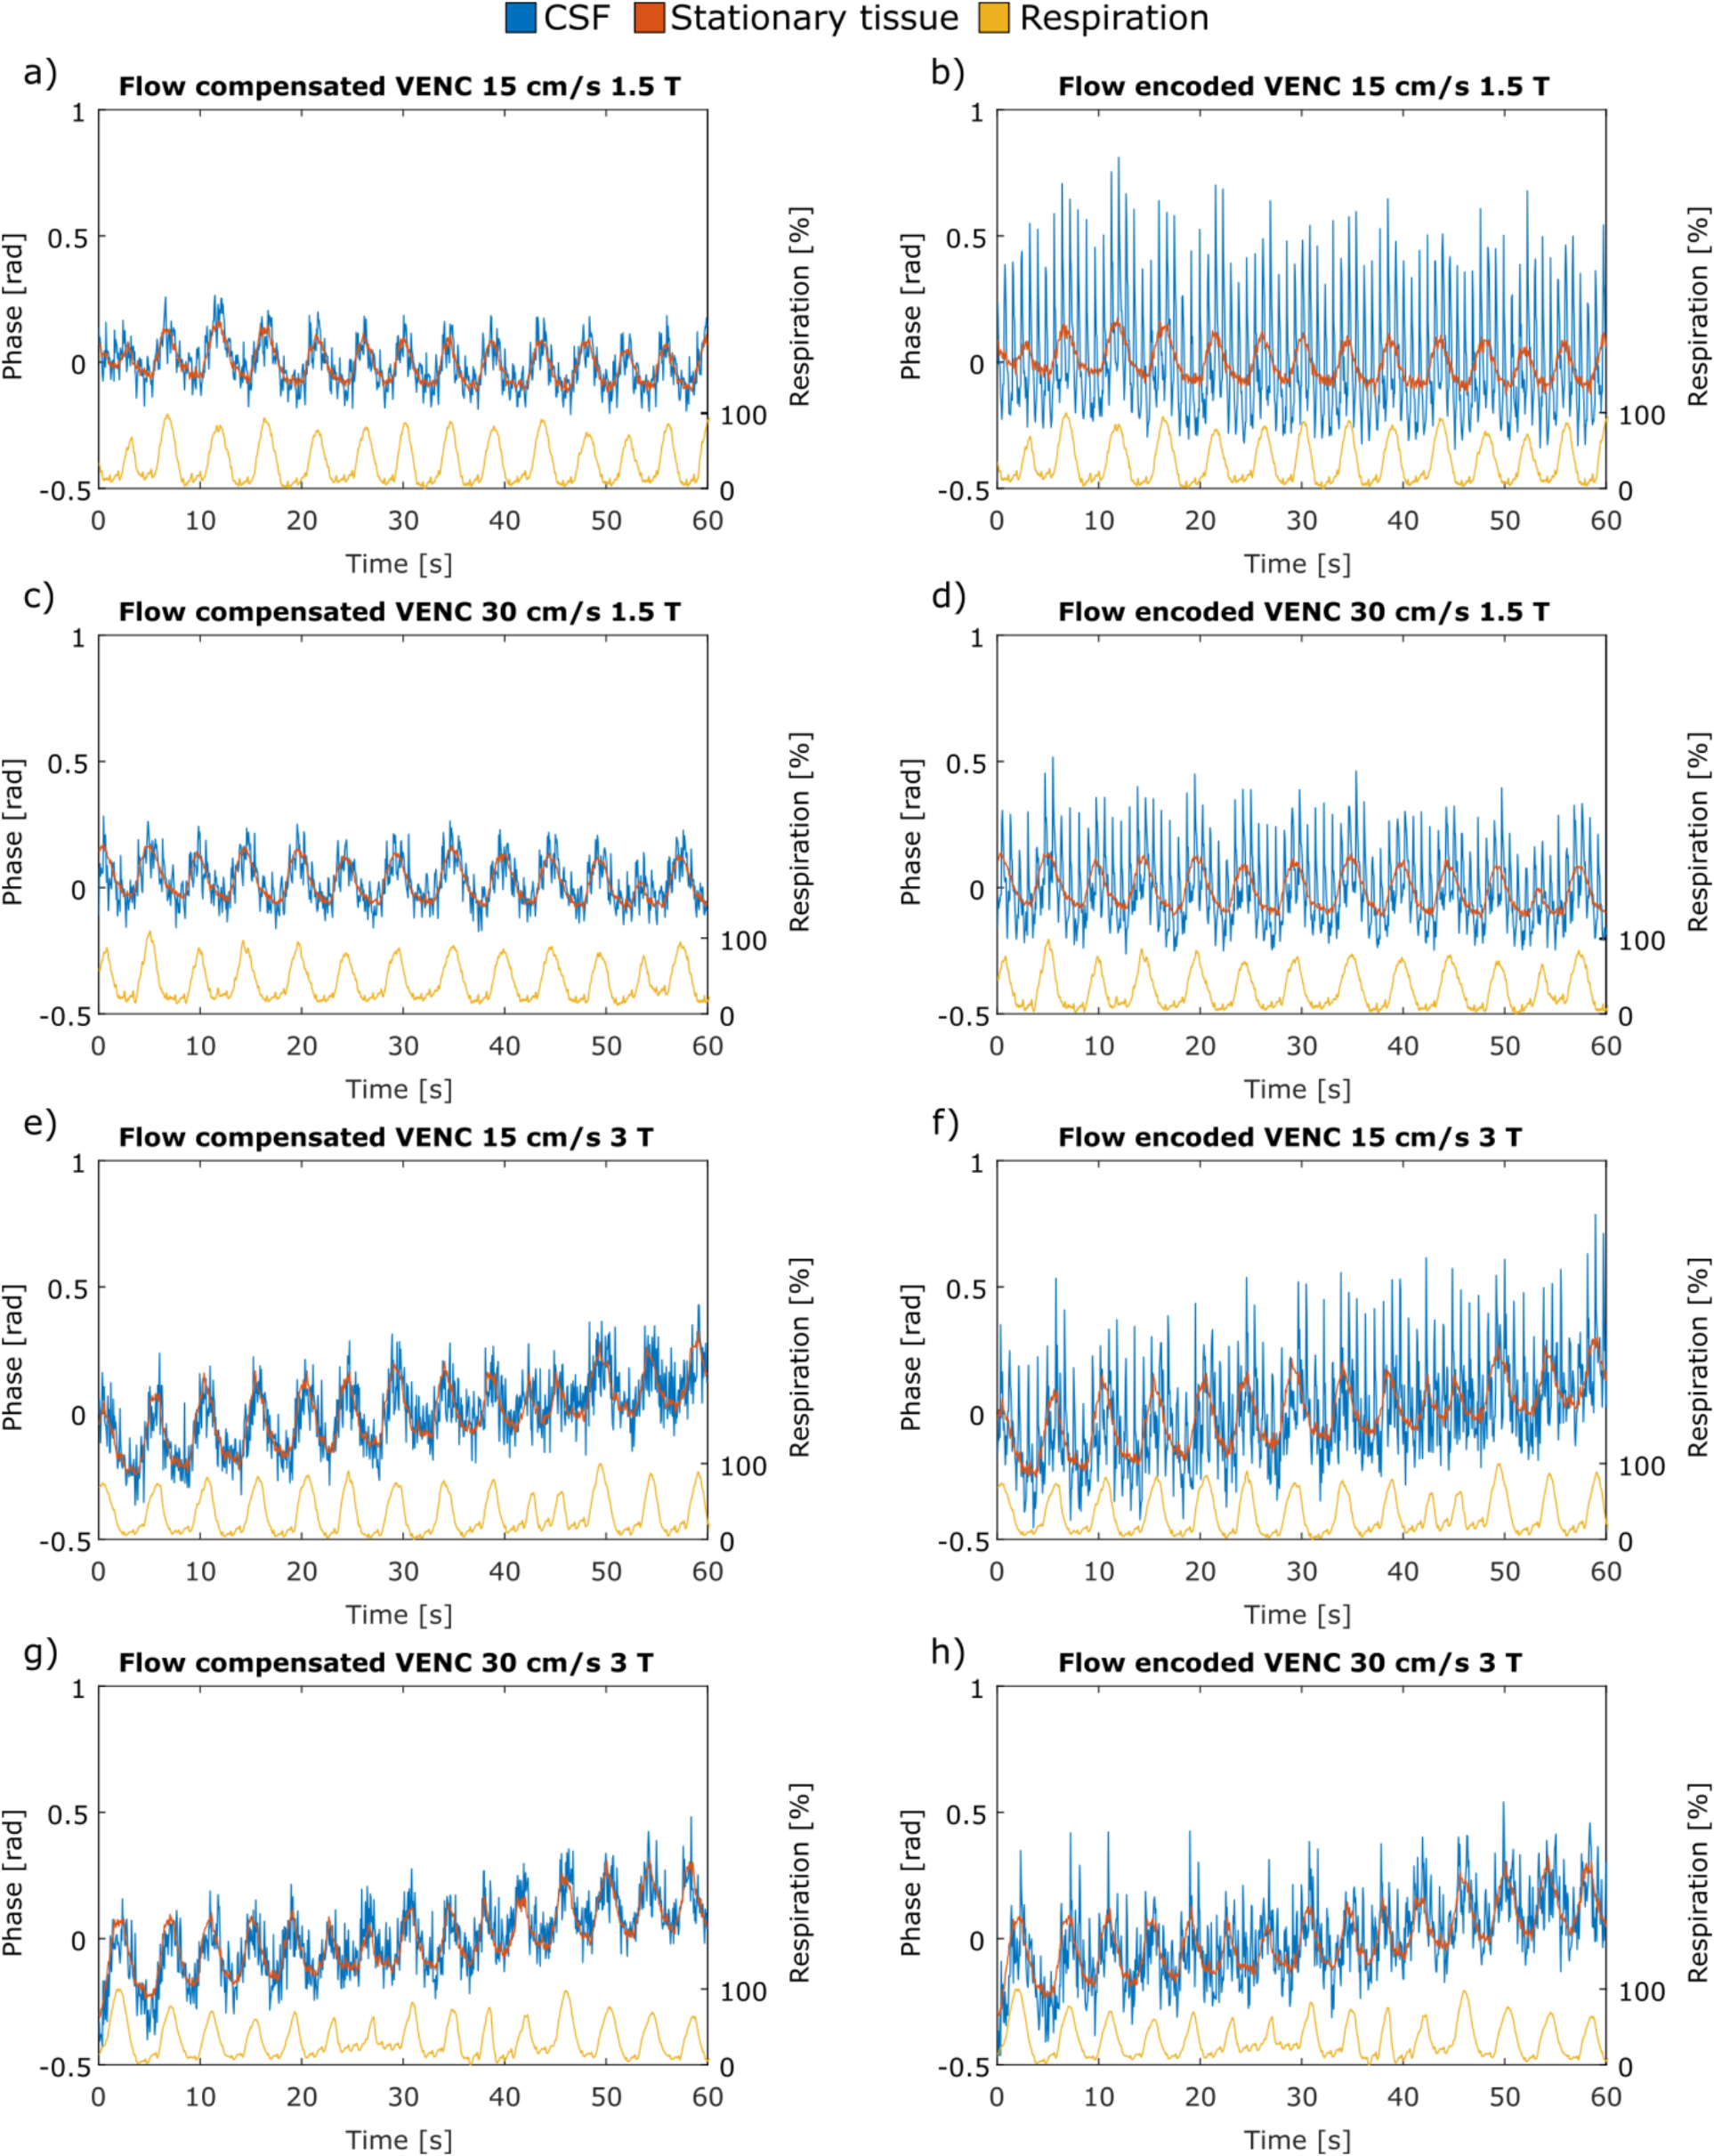
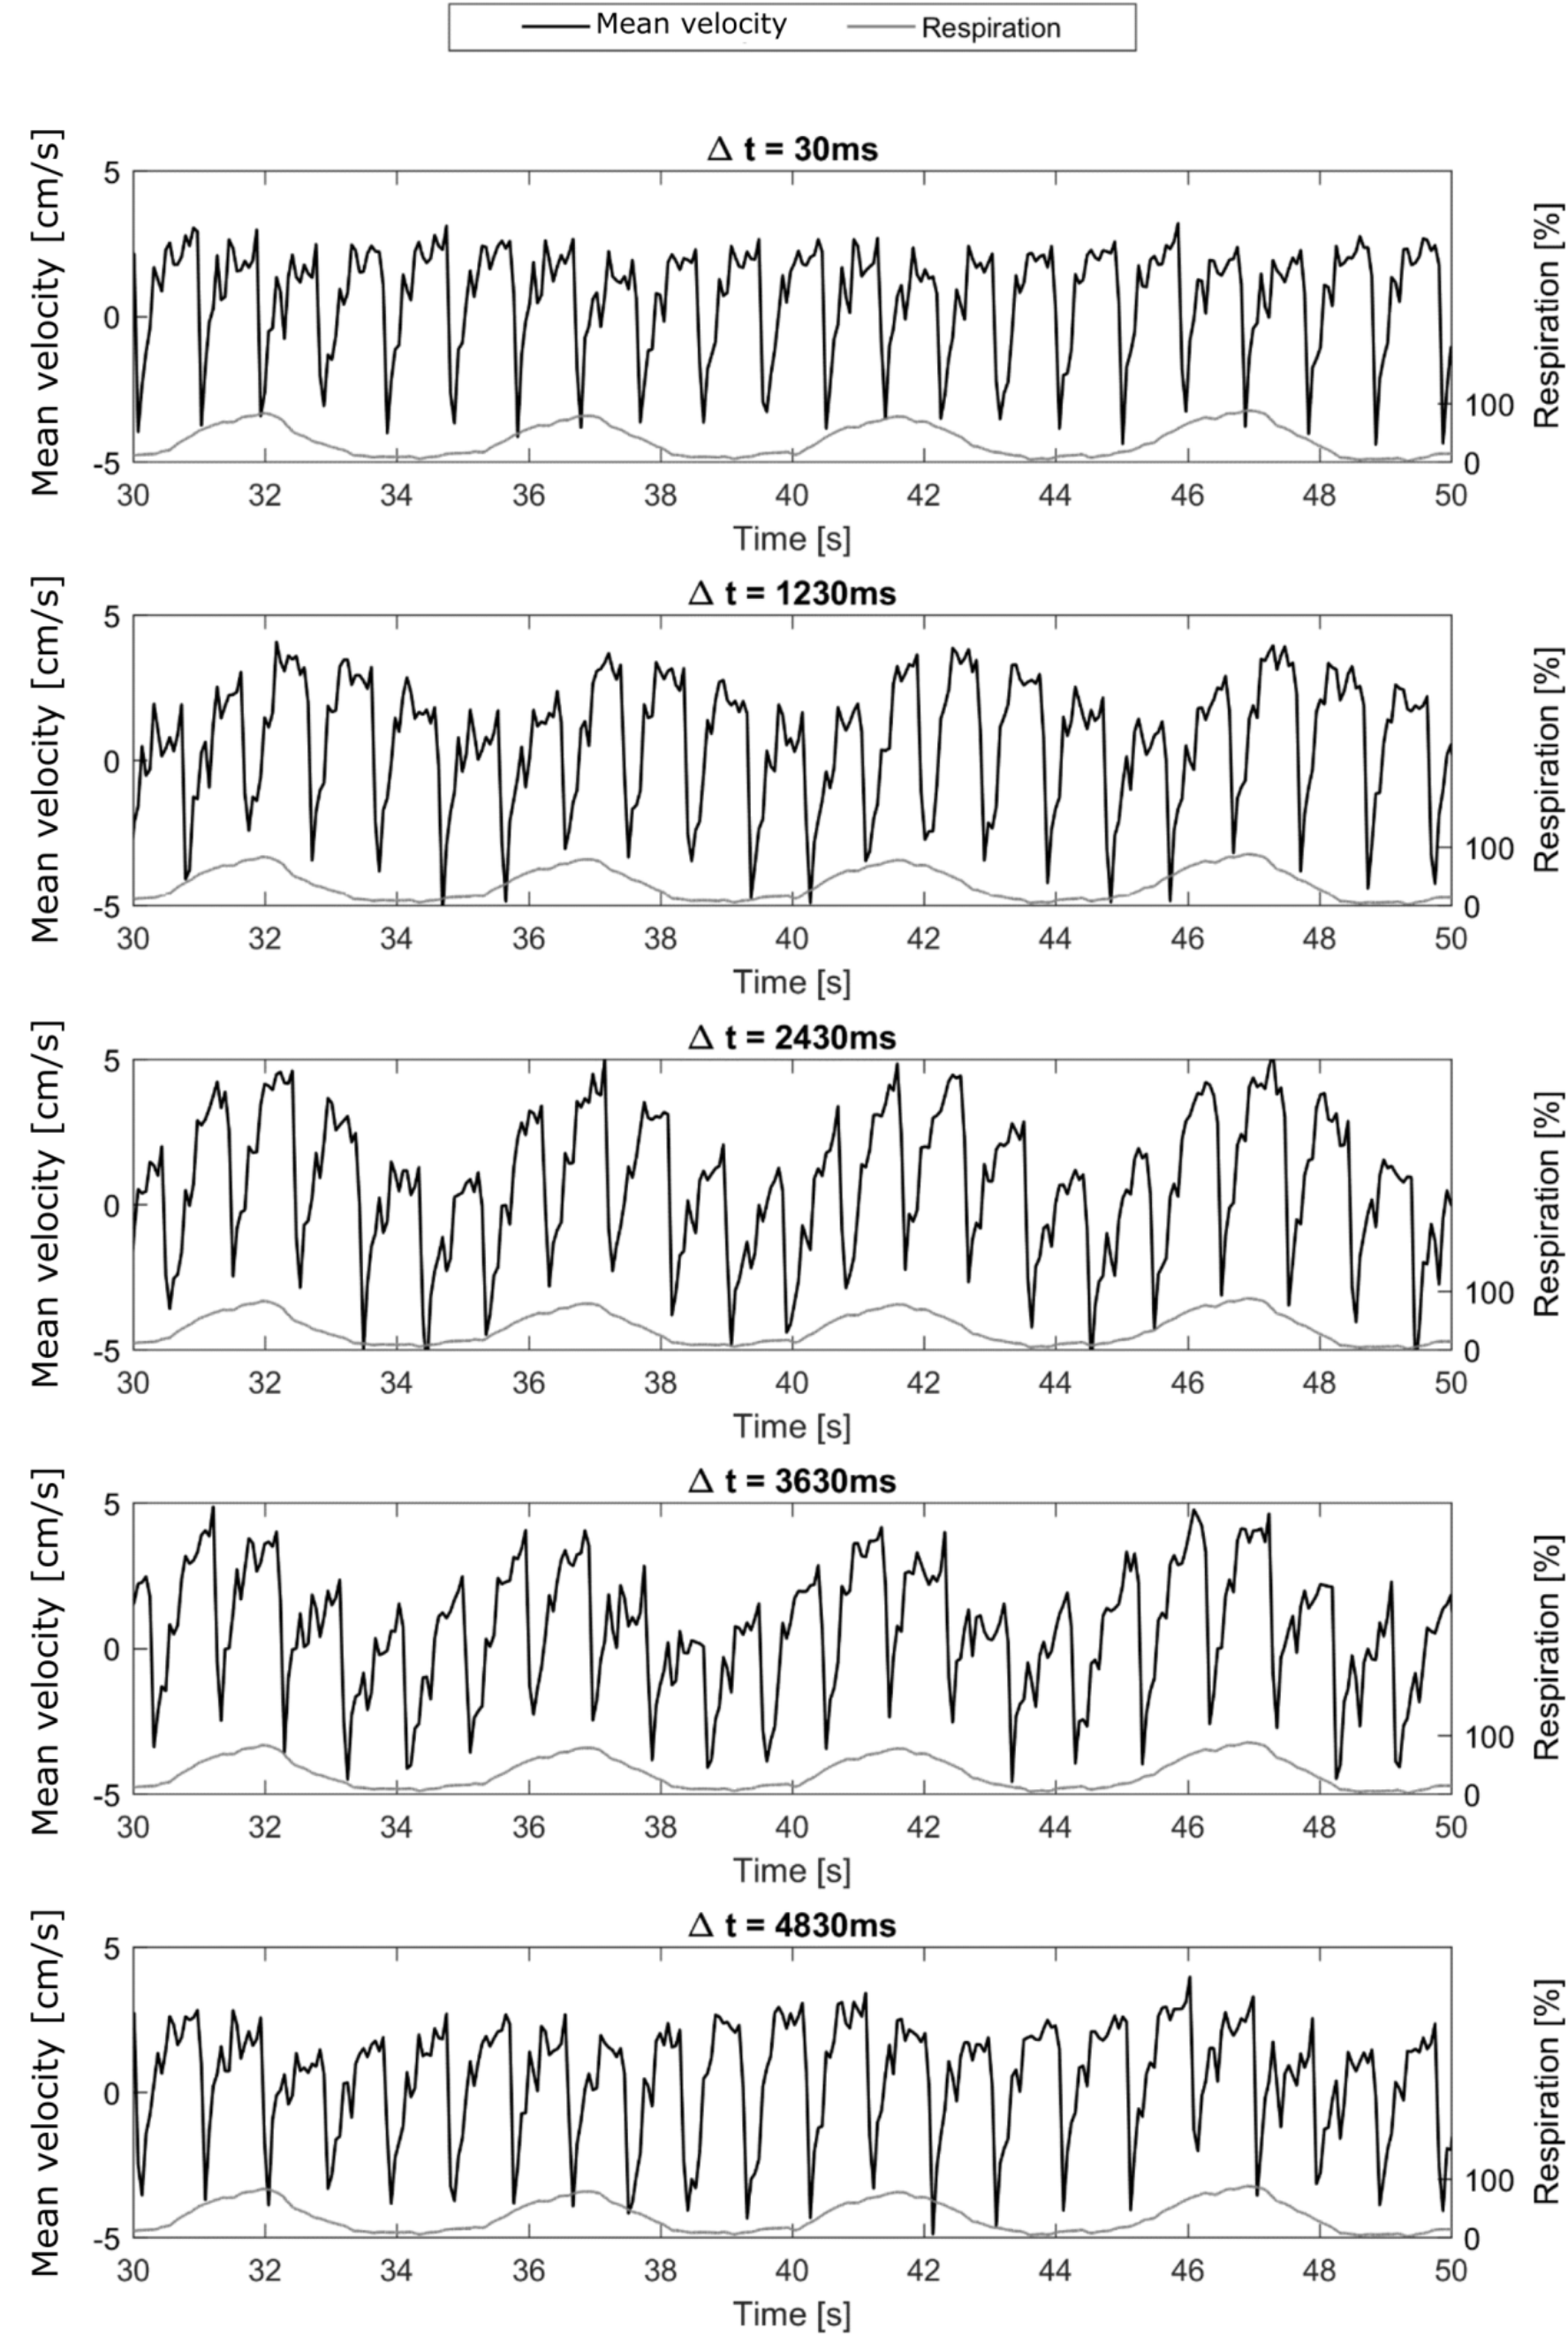
In line with recent studies4–6, normal breathing shows noticeable respiration dependency of CSF flow measurements in selected volunteers only (Figure 2, top), while other volunteers do not show a clear respiration dependency (Figure 2, bottom). For one volunteer, the respiration from the air-cushion belt (yellow) and the phase variations in both ROIs (blue and orange) of flow encoded (right) and flow compensated images (left) are plotted in figure 3. The mean Pearson coefficient (Table 1) between the flow compensated phase curves of both tissues and the respiratory air-cushion belt data over all volunteers is 0.59±0.12 for CSF and 0.81±0.10 for stationary tissue (p<0.001 for all values). Figure 4 shows CSF flow curves from reconstructed PC images at varying time delays between the phase images (as shown in Figure 1) and corresponding respiration curves of volunteer 2.Discussion
The flow compensated phase curves of both tissues show variations, directly correlated with respiration (Figure 3, left and Table 1), which can only be caused by B0 variations. Similar B0 variations can be seen in the flow encoded phase curves (Figure 3, right), overlaid with the physiological, cardiac-driven flow in the CSF ROI. When comparing flow encoded phase curves for different VENCs, the cardiac driven flow peaks are expectedly halved for doubled VENCs while the respiratory-induced phase variations have similar amplitudes. Similarly, for halved magnetic field strength while the flow velocities are similar (slight variations due to slightly different geometries and physiologic variations), the amplitude of respiratory-induced phase variations is nearly halved. These facts confirm that the measured phase variations are respiratory-induced B0 offsets rather than respiratory-induced flow changes. Finally, the influence of the delay between the acquisitions of flow compensated and encoded images on the apparent respiratory-induced flow curves in PC images (Figure 4) confirms our assumptions, that respiration-induced B0 variations play a crucial role in respiratory-resolved CSF flow quantification. Expectedly, depth and frequency of respiration also affect susceptibility changes and therewith the phase variations due to breathing.Conclusion
Susceptibility changes and resulting B0 changes during the respiratory cycle lead to phase variations in single-shot, real-time CSF PC flow measurements. The influence of these respiration-induced B0 variations was found to not depend on the VENC, but being dependent on the magnetic field strength, the delay between the flow compensated and flow encoded images used to reconstruct PC images and the depth and frequency of respiration. For short delays (30ms), only one volunteer showed apparent respiratory-induced flow changes. However, this effect might be increased in measurements with forced respiration and larger TR. In conclusion, B0 variations due to respiration need to be corrected prior to analysing true respiration-dependent CSF flow measured by real-time PC MRI. This can be performed by acquiring both flow compensated and encoded images during the same cardiac and respiratory phase or by applying image-based corrections.Acknowledgements
References
- Nitz WR, Bradley WG, Watanabe AS, et al. Flow dynamics of cerebrospinal fluid: assessment with phase-contrast velocity MR imaging performed with retrospective cardiac gating. Radiology. 1992;183(2):395-405. doi:10.1148/radiology.183.2.1561340.
- Greitz D, Wirestam R, Franck A, Nordell B, Thomsen C, Ståhlberg F. Pulsatile brain movement and associated hydrodynamics studied by magnetic resonance phase imaging. Neuroradiology. 1992;34(5):370-380. doi:10.1007/BF00596493.
- Stadlbauer A, Salomonowitz E, van der Riet W, Buchfelder M, Ganslandt O. Insight into the patterns of cerebrospinal fluid flow in the human ventricular system using MR velocity mapping. Neuroimage. 2010;51(1):42-52. doi:10.1016/j.neuroimage.2010.01.110.
- Chen L, Beckett A, Verma A, Feinberg DA. Dynamics of respiratory and cardiac CSF motion revealed with real-time simultaneous multi-slice EPI velocity phase contrast imaging. Neuroimage. 2015;122:281-287. doi:10.1016/j.neuroimage.2015.07.073.
- Dreha-Kulaczewski S, Joseph AA, Merboldt K-D, Ludwig H-C, Gärtner J, Frahm J. Identification of the Upward Movement of Human CSF In Vivo and its Relation to the Brain Venous System. J Neurosci. 2017;37(9):2395-2402. doi:10.1523/JNEUROSCI.2754-16.2017.
- Yildiz S, Thyagaraj S, Jin N, et al. Quantifying the influence of respiration and cardiac pulsations on cerebrospinal fluid dynamics using real-time phase-contrast MRI. J Magn Reson Imaging. February 2017:1-9. doi:10.1002/jmri.25591.
- Verma T, Cohen-Adad J. Effect of respiration on the B0 field in the human spinal cord at 3T. Magn Reson Med. 2014;72(6):1629-1636. doi:10.1002/mrm.25075.
Figures