4892
Analysis of cardiac motion induced error for in-vivo cardiac DTI in different heart phases - a comparison of second-order motion compensated SE versus STEAM1Institute for Biomedical Engineering, University and ETH Zurich, Zurich, Switzerland
Synopsis
Being a single R-R interval imaging technique, second order motion compensated spin echo (M2-SE) cardiac DTI is appealing for clinical application but its implementation has so far been limited to systolic imaging. In this study we investigate signal dephasing in in-vivo cDTI at different time points within the cardiac cycle. The motion induced dephasing found for both sequences lies well within the previously reported limits for repeated measurements, when imaged in mid-to-end systole and diastole. STEAM based approaches result in consistent signal preservation across the cardia cycle, while M2-SE the exhibits a minimum in signal dephasing at around 50%-75% systole.
Introduction
Second order motion compensated cardiac diffusion tensor imaging (cDTI)1-3 has emerged as alternative for STEAM based cDTI5-6. While STEAM immaging has been used to compare the myocadridaial microstructure in systole and diastole6-10 the application of second-order motion compensated spin-echo (M2-SE) sequences remain limitted. STEAM sequences rely on periodic cardiac motion which is assumed for most of the cardiac cycle. The M2-SE approach is in-sensitive towards second order motion privously applied during systolic contraction1-2. Any deviation from the prerequisit results signal dephasing which is missinterpreted as diffusion weighting. It is the objective of the present work to study signal dephasing and thereby quantify eddy-current and motion-induced errors affecting quantification in in-vivo cardiac DTI at different timepoint within the cardiac cycle.Methods
Data acquisition Imaging was performed on a 1.5T clinical MR system (32-channel cardiac receiver array, 80mT/m@100mT/m/ms gradient system). Three short-axis slices were acquired during respiratory navigator gated (5mm gating window) breath holding. Diffusion weighting (b=400s/mm2) was applied in frequency and in phase encoding direction. Through-plane dephasing was captured in the four-chamber horizontal long axis view (hla) and the two-chamber vertical long axis view (vla). Imaging parameters were identical for both sequences: spatial resolution 2.5×2.5mm2, slice thickness 10mm, reduced FOV11 230×104mm2, signal averages 3, TR=3 R-R (TR=6R-R for STEAM in short axis view to allow for slice cycling), TE=65ms (M2-SE) 32ms (STEAM). Three systolic trigger delays (time between trigger detection and the first 90° excitation pulse) we applied using ECG triggering: 25%, 50% and 75% peak systolic contraction. Hundred percent systole was identified visually from a short axis cine acquisition as time point of maximal contraction (temporal resolution 10ms). An additional diastolic time point was chosen based on a) quiescence period (visually assessed on short axis cine) and b) zero diastolic ventricular flow (assessed by a 2D quantitative flow measurement spatial/temporal resolution: 2.2×2.2×10mm3/38.5ms). Diastolic imaging was triggered using the scanner’s finger plethysmograph. To measure the eddy-current induced signal distortions the identical experiments were repeated in a 10l container filled with agar to assess.
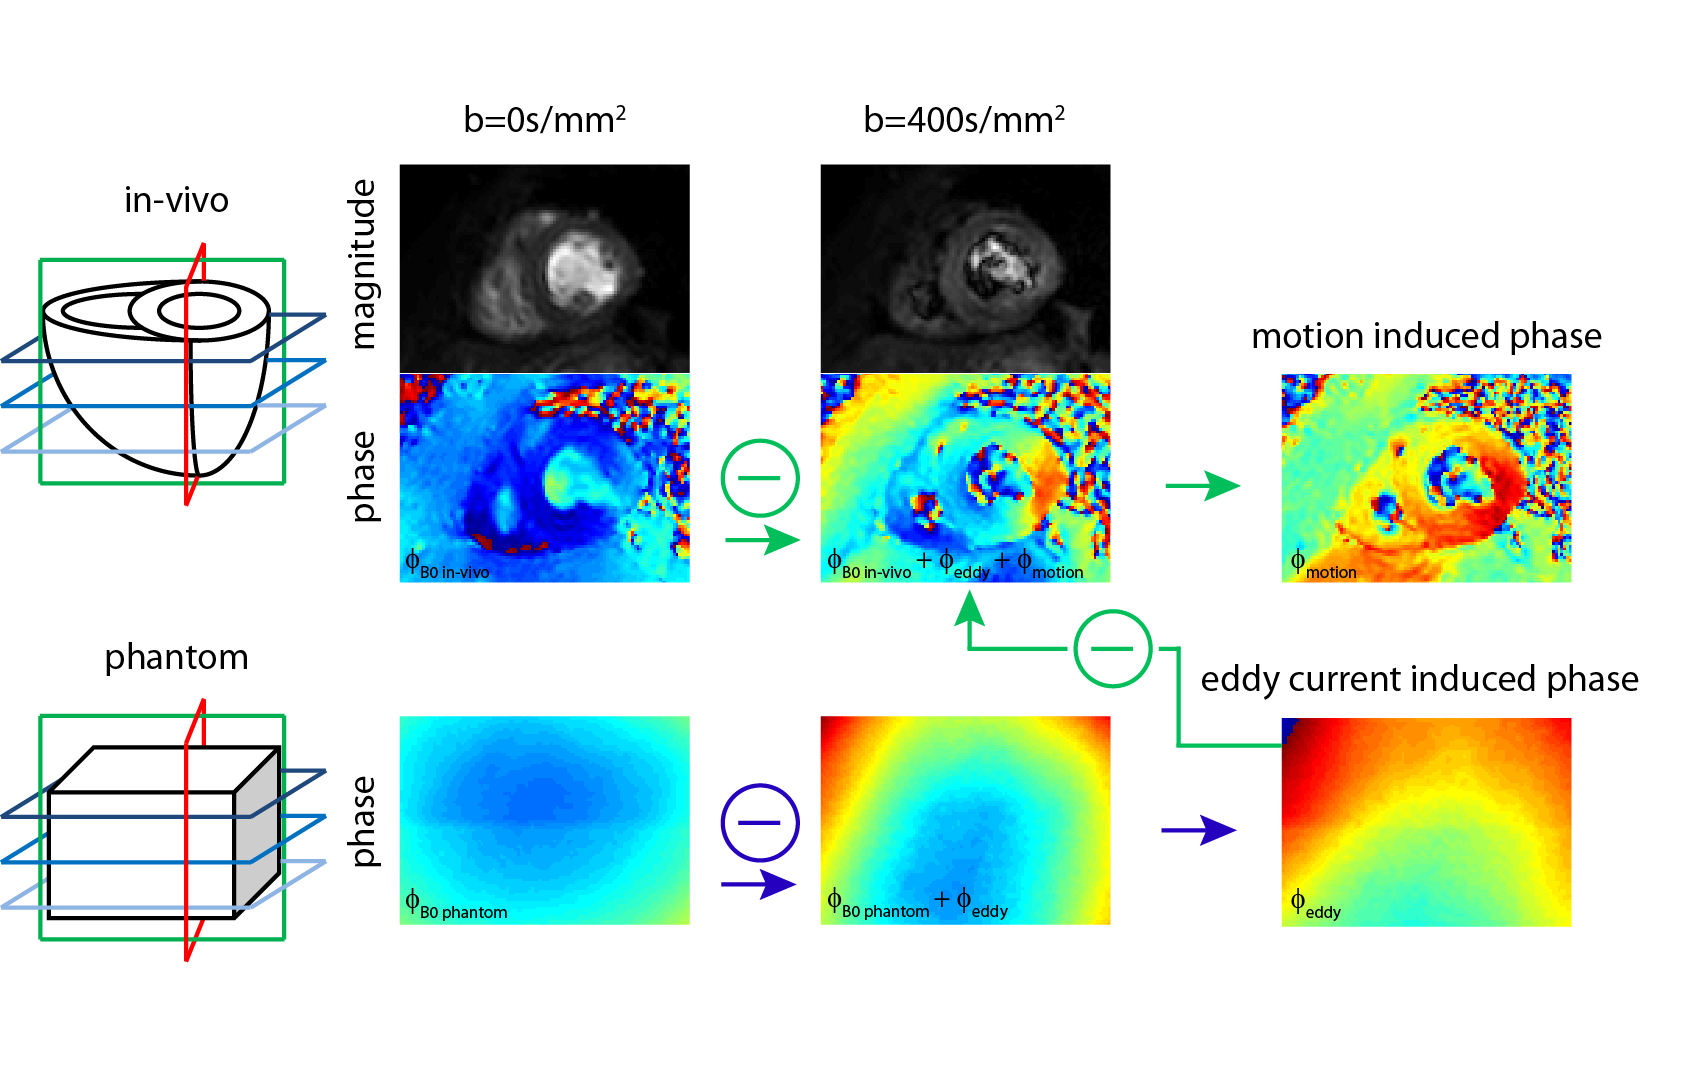
Data analysis: Figure 1 illustrates the data processing: The Phase resulting from eddy-currents was estimated by subtraction of the unweighted phantom phase-data from the corresponding diffusion weighted phase-image. Resulting eddy-current induced phase was removed from in-vivo data and the B0 phase (from the unweighted in-vivo acquisition) was subtracted from the diffusion weighted phase images upon image registration12. The obtained phase images were unwrapped and fitted to 5th order polynomial surfaces from which phase gradients were computed. Based on visual inspection, phase data corrupted by insufficient breath holding were discarded. The error in apparent diffusion coefficient (ADC) was calculated according to: $$ADC_{apparent}=ADC_{true}+ADC_{motion}=-\frac{1}{N}\sum_{i=1}^{N}\frac{1}{b}\left(log\left(\frac{S_{i true}}{S_{0}}\right)+log\left(\alpha_{i}\right)\right)$$
with αi being the signal attenuation due to dephasing along one encoding direction:
$$\alpha_{i}=\left|sinc\left(\frac{\overrightarrow{\nabla\phi_{i}}\cdot\overrightarrow{resolution}}{2}\right)\right|$$
All reported ADCmotion were computed for a spatial resolution of 2.5×2.5×8mm3.
Results
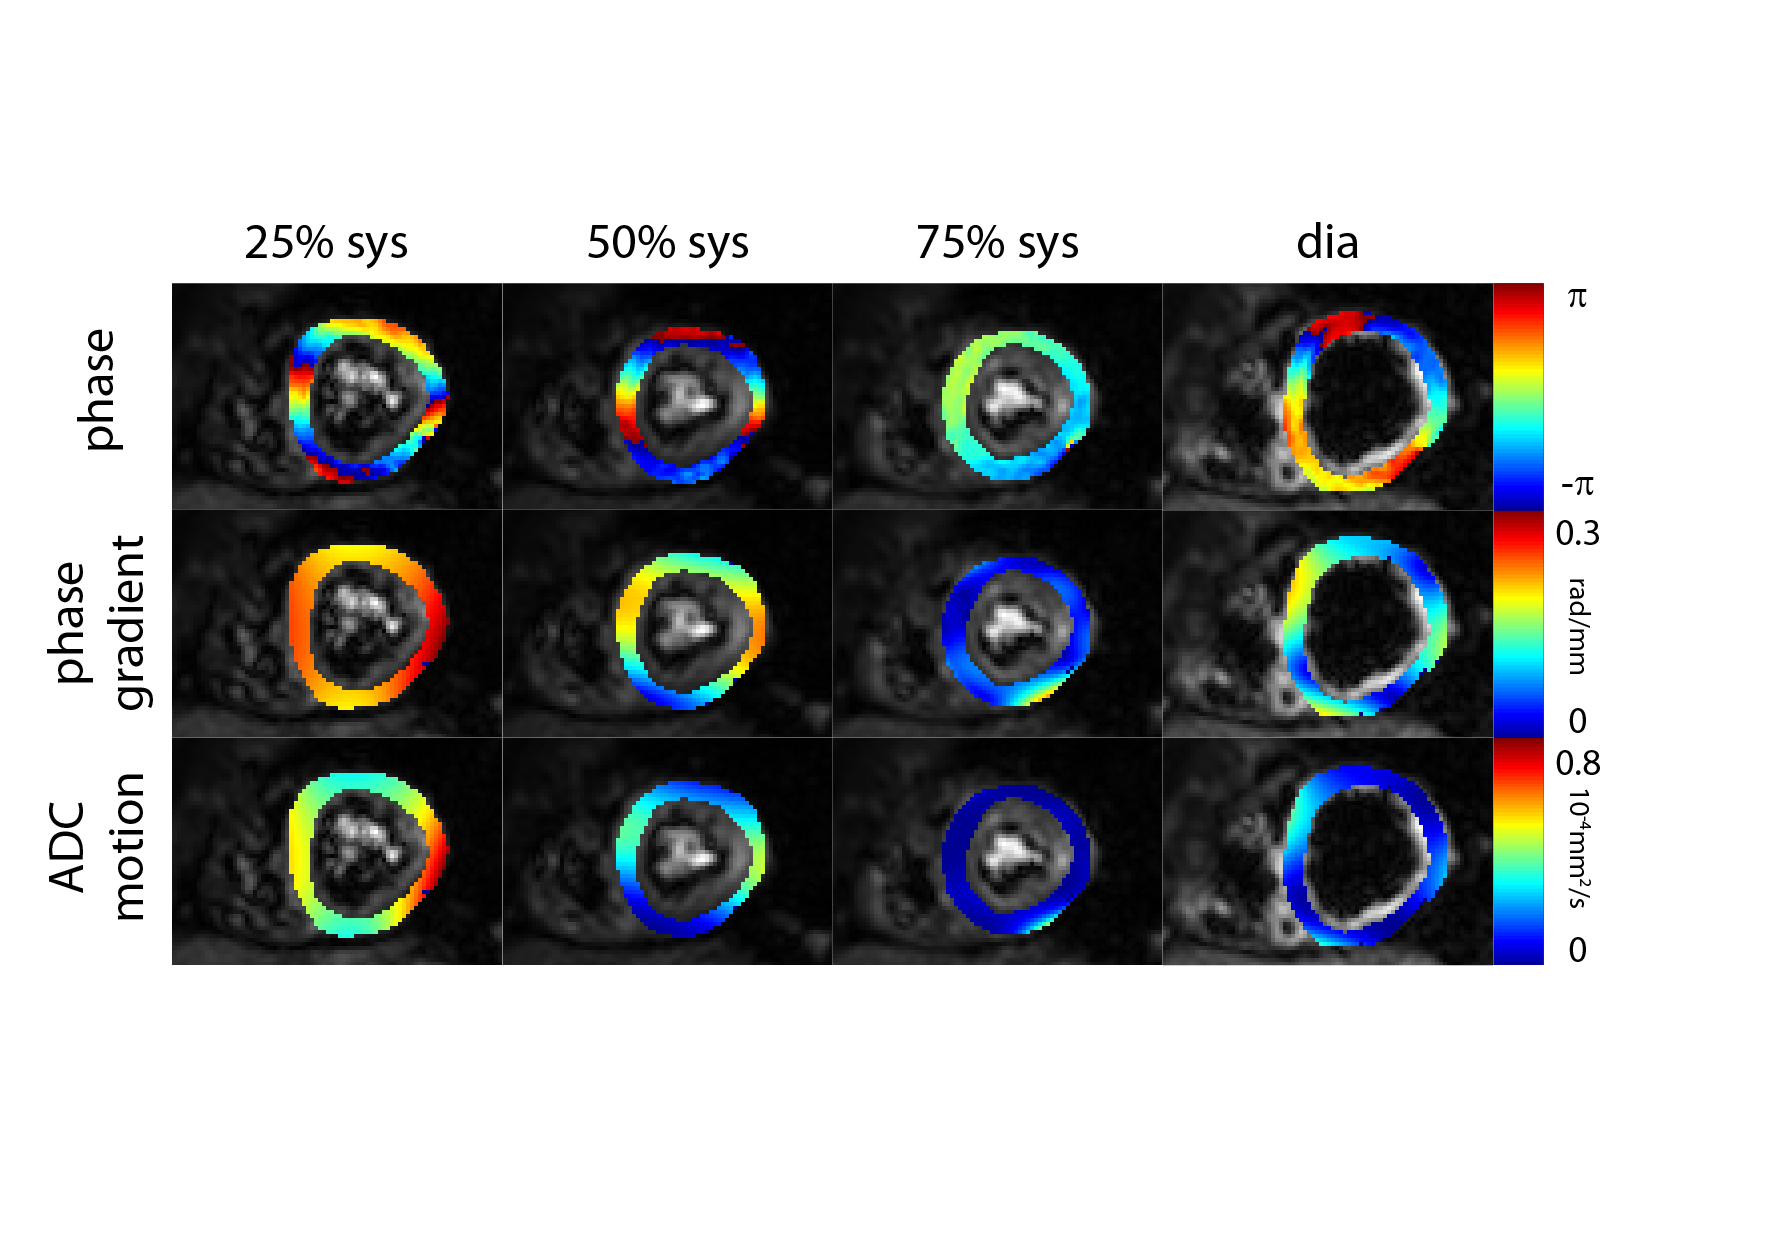
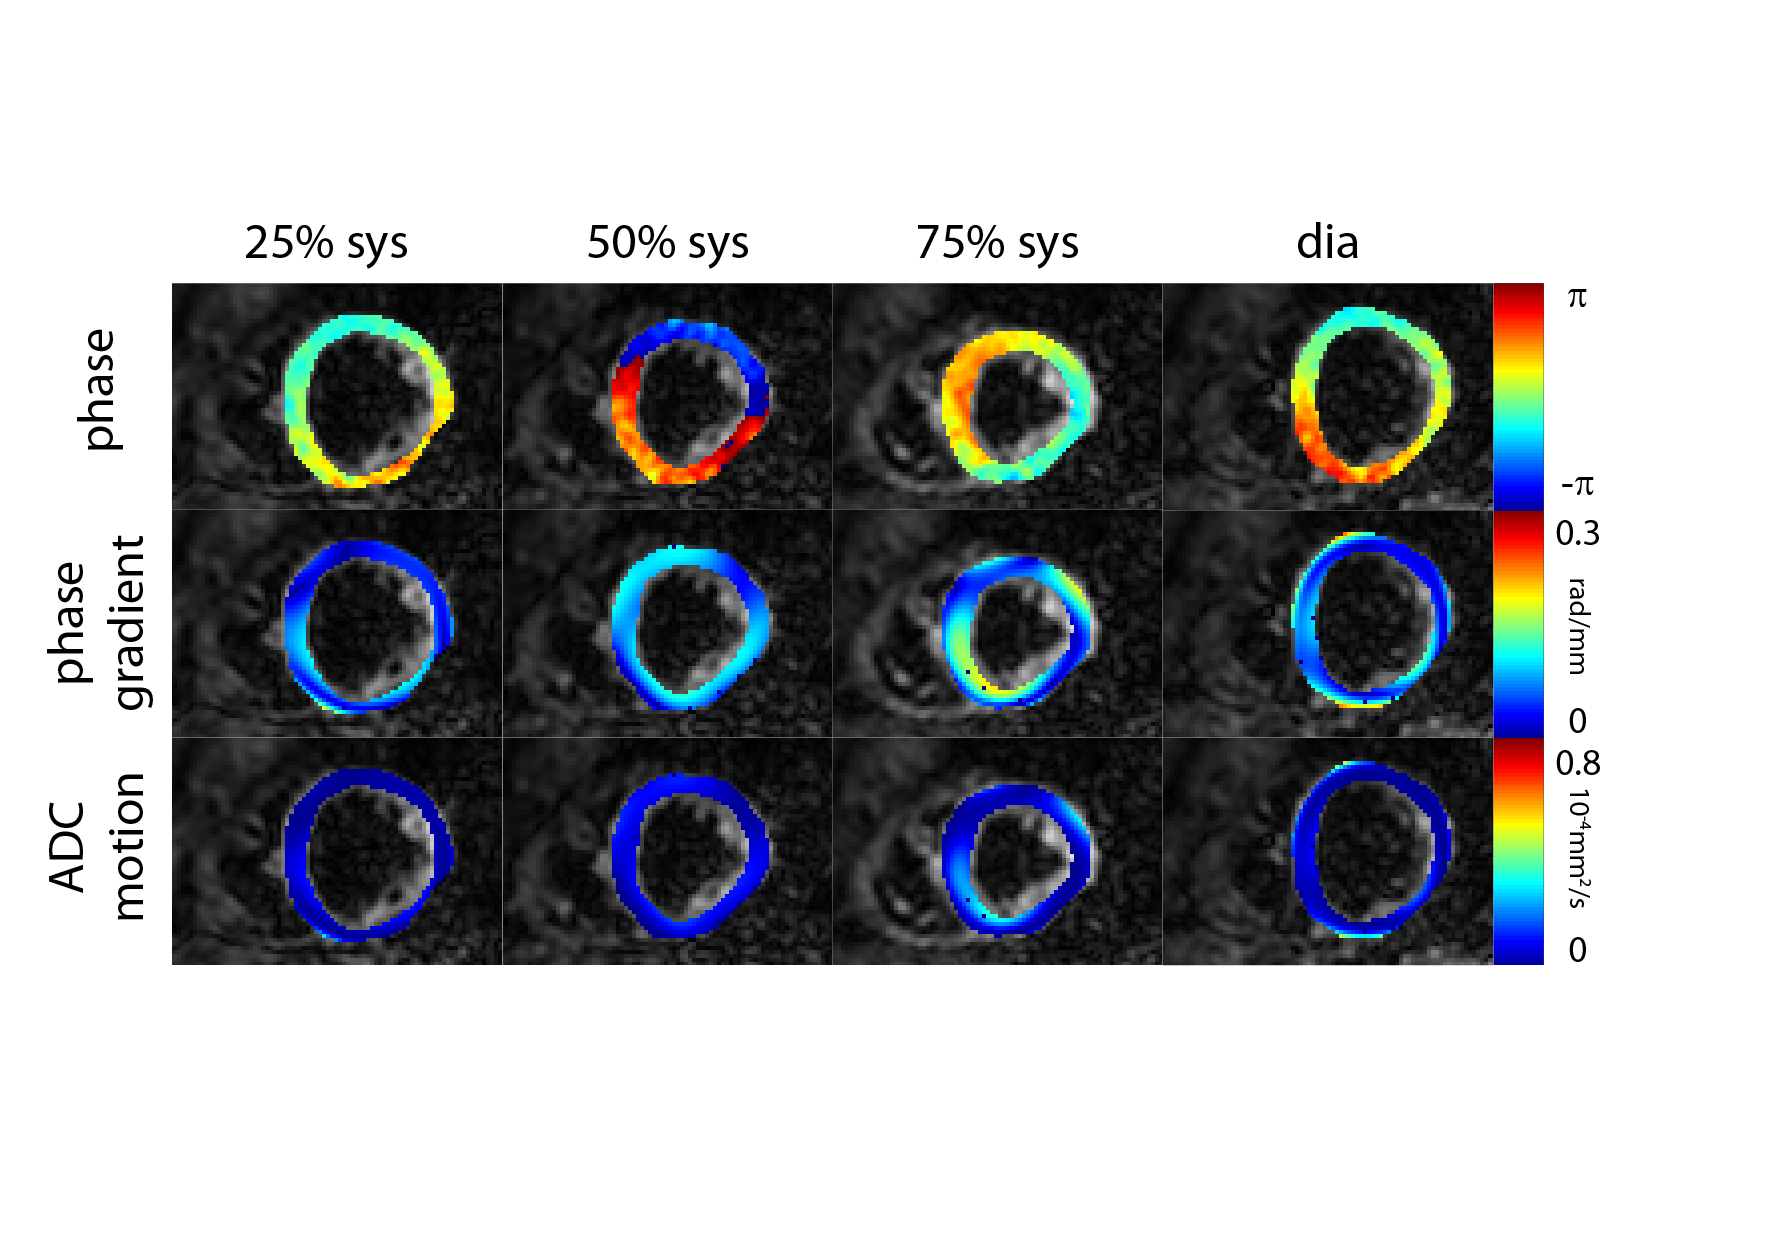
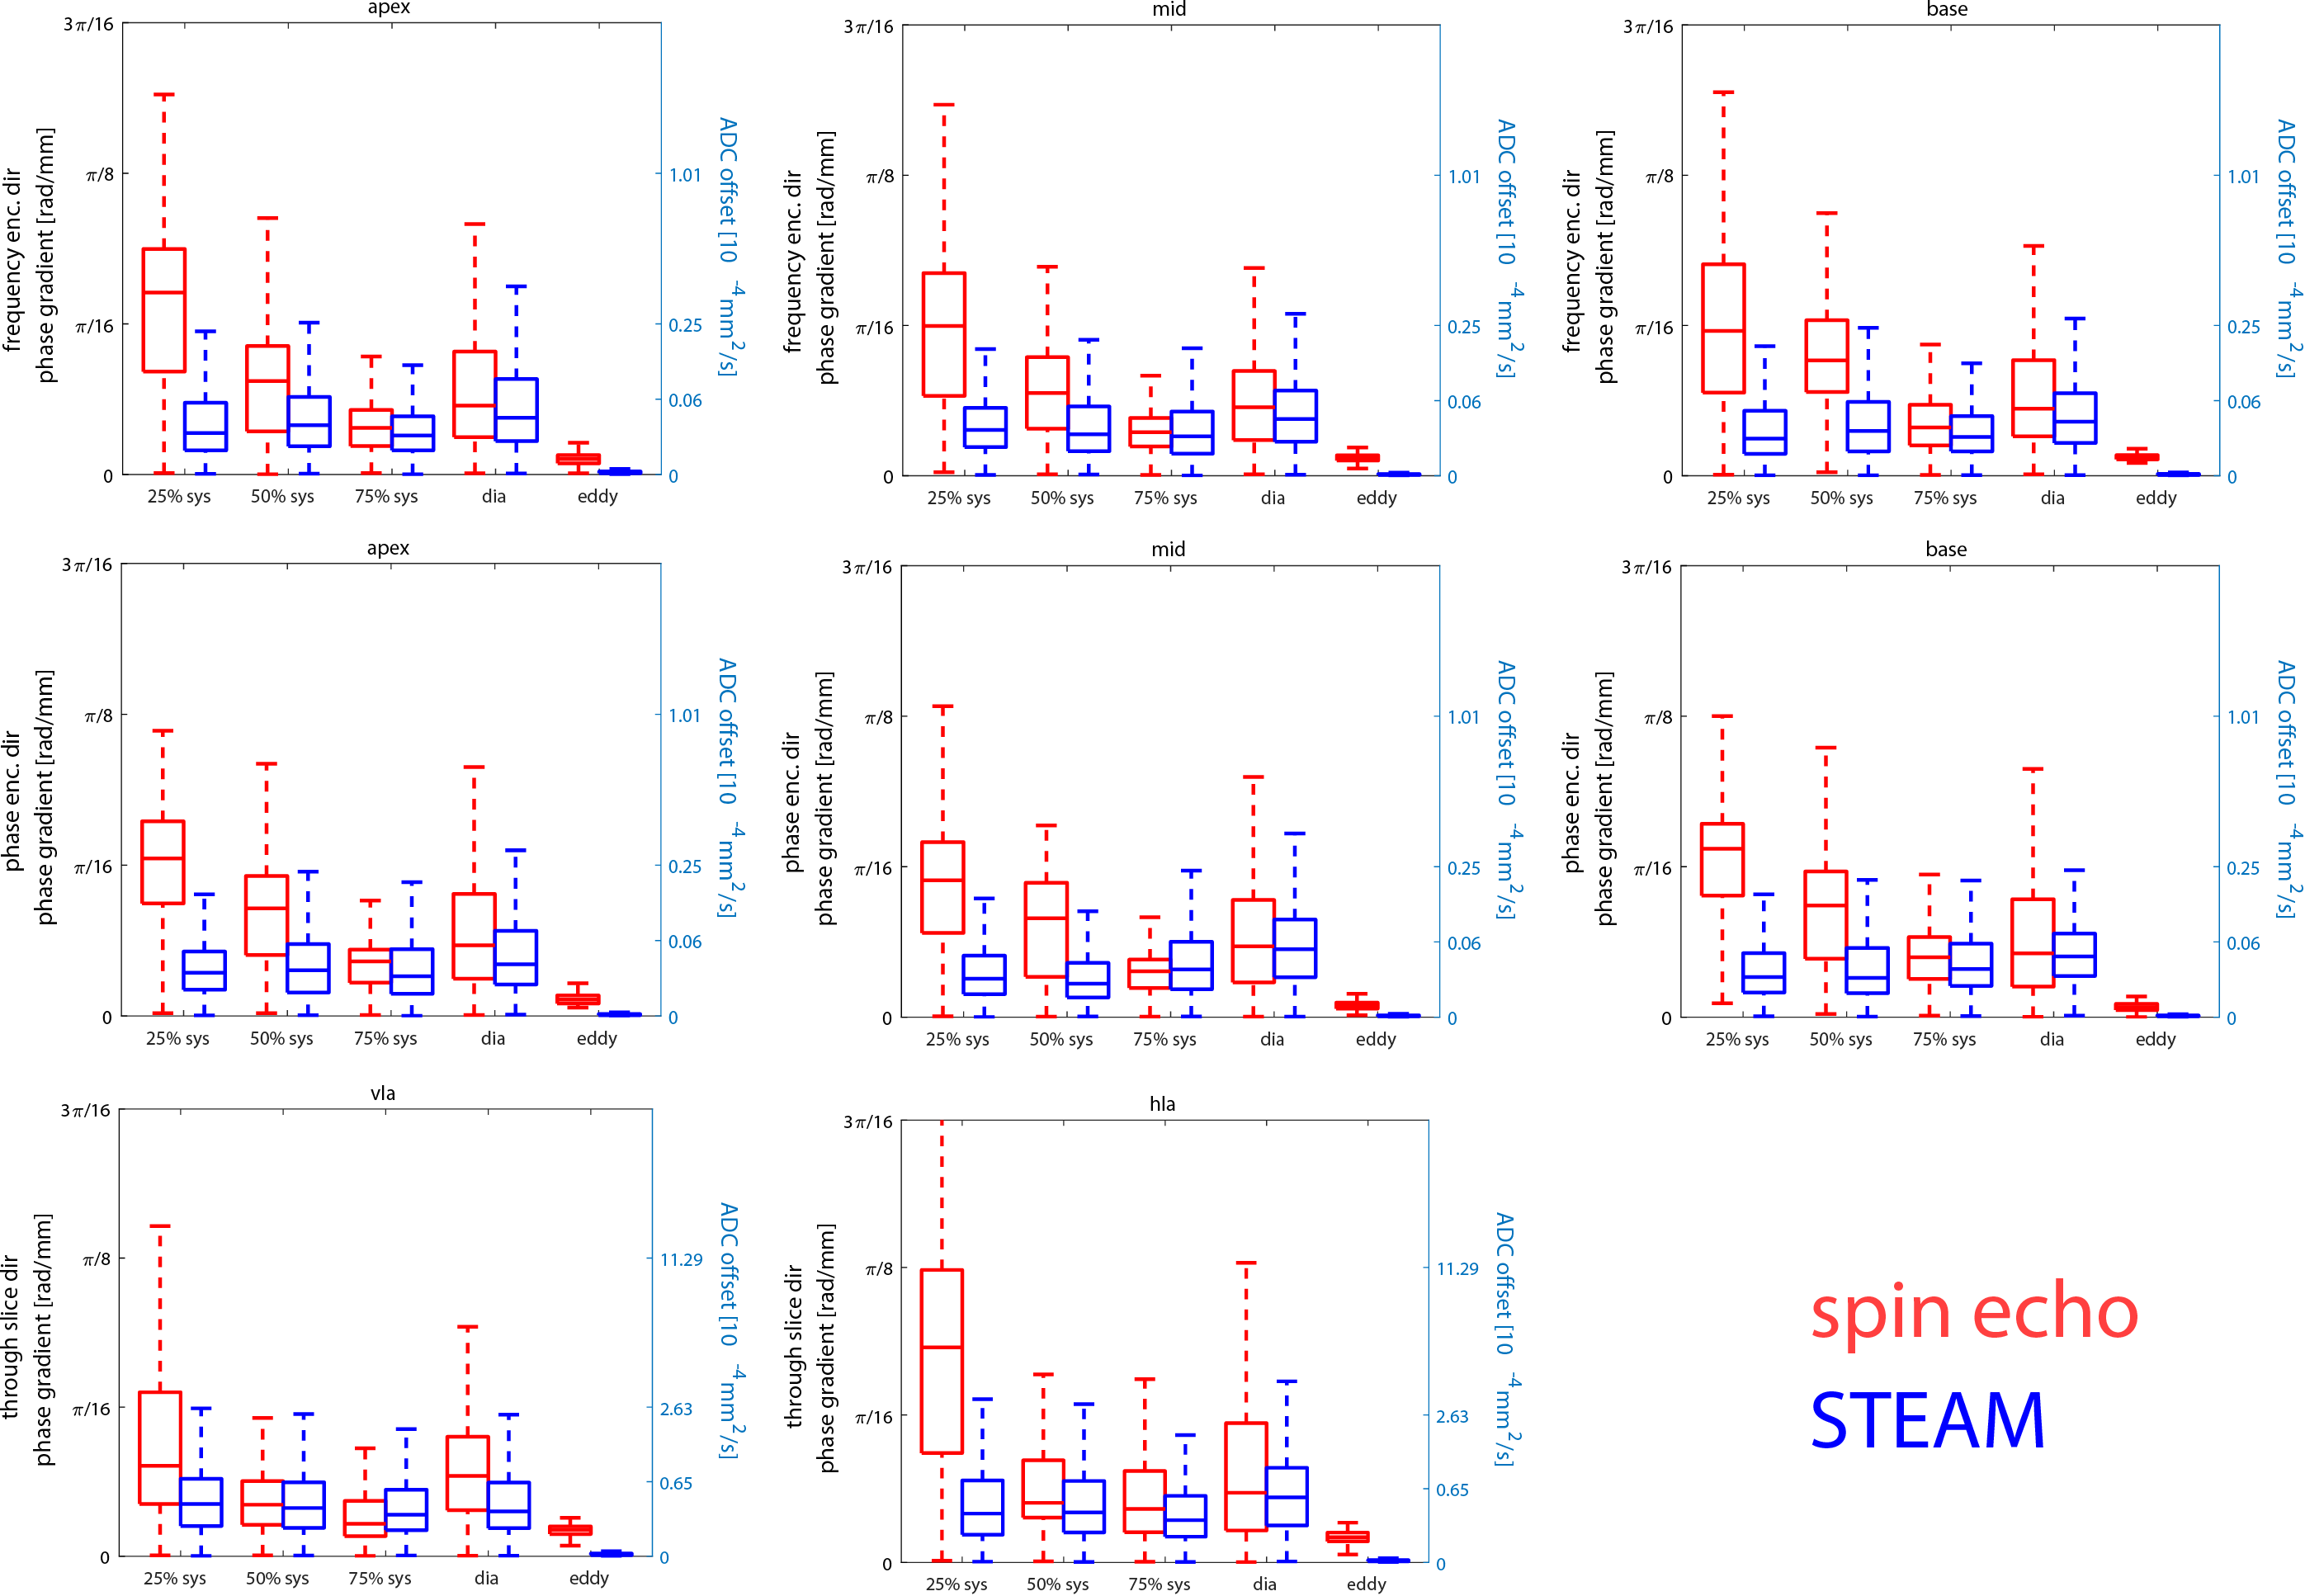
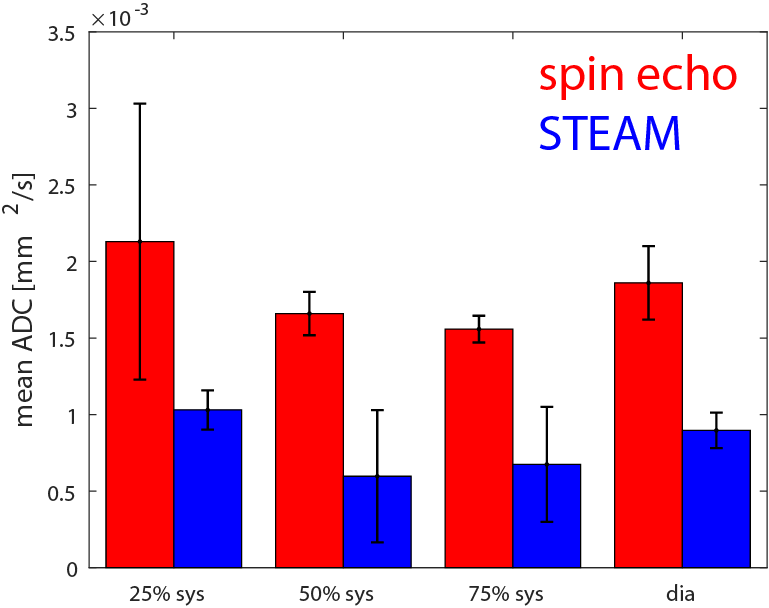
Figure 2 shows example phase maps for the different trigger delays for M2-SE along with the computed phase gradients and error in ADC. Figure 3 shows the corresponding maps for diffusion weighted STEAM imaging. The analysis across volunteers is shown in Figure 4. The measured phase gradients across the myocardium resulting from STEAM imaging is constant across different trigger delays: 0.06±0.01rad/mm for apex, mid and base equally (corresponding to an ADCmotion=2.3×10⁻⁶mm2/s), 0.06±0.01rad along the long axis (corresponding to an ADCmotion=2.4×10⁻⁵mm2/s). For M2-SE the phase gradient across the myocardium experiences a minimum around 50%-75% systole. At 75% systole both imaging sequences result in similar dephasing. The largest deviation between both sequences is found during early systole. Eddy-current induces dephasing is one order of magnitude larger for M2-SE compared to STEAM, however negligible compared to other sources of error: ADCmotion=3.6×10⁻⁶mm2/s for SE and 2.4×10⁻⁸mm2/s for STEAM for a voxel length of 8mm.Discussion
Being a single R-R interval imaging technique, M2-SE imaging is appealing for clinical use. A higher degree of motion sensitivity compared to STEAM sequences was found requiring careful planning of imaging time points within the cardiac cycle. Previously published reproducibility studies for STEAM imaging reported 2SD-limits for MD of 1.5-3.1×10⁻⁴mm2/s13-15. The motion induced dephasing found for both sequences lies well within the previously reported limits for repeated measurements, when imaged in mid-to-end systole and diastole. It is noted that similar phase gradients were found for in-plane and through-plane encoding directions leading to more severe signal dephasing through-plane with an anisotropic voxel size.Acknowledgements
No acknowledgement found.References
1.Welsh C, Di Bella E, Hsu E. Higher-order motion-compensation for in vivo cardiac diffusion tensor imaging in rats. IEEE Trans Med Imaging 2015;34:1843–1853.
2. Stoeck CT, von Deuster C, Genet M, et al. Second order motion compensated spin-echo diffusion tensor imaging of the human heart. Magn Reson Med 2015. doi: 10.1002/ mrm.25784.
3. Nguyen C, Fan Z, Sharif, B et al. In vivo three-dimensional high resolution cardiac diffusion-weighted MRI: A motion compensated diffusion-prepared balanced steady-state free precession approach. Magn Reson Med 2013; doi 10.1002/mrm.25038
4. Edelman R, Gaa J, Wedeen VJ, et al. In vivo measurement of water diffusion in the human heart. Magn Reson Med 1994;32:423–428.
5. Nielles-Vallespin S, Mekkaoui C, Gatehouse P, et al. In vivo diffusion tensor MRI of the human heart: Reproducibility of breath-hold and navigator-based approaches. Magn Reson Med 2013;70:454–465.
6. Stoeck CT, Kalinowska A, von Deuster C, et al. Dual-phase cardiac diffusion tensor imaging with strain correction. PLoS One 2014;9: e107159.
7. Ferreira P, Kilner PJ, McGill L-A, Nielles-Vallespin S, Scott AD, Spottiswoode BS, et al. In vivo cardiovascular magnetic resonance diffusion tensor imaging shows evidence of abnormal myocardial laminar orientations and mobility in hypertrophic cardiomyopathy. J Cardiovasc Magn Reson. 2014;16(Suppl 1):P338.
8. Tseng WI, Dou J, Reese TG, Wedeen VJ. Imaging myocardial fiber disarray and intramural strain hypokinesis in hypertrophic cardiomyopathy with MRI. J Magn Reson imaging. 2006;23(1):1–8.
9. Von Deuster C, Sammut E, Asner L, Nordsletten D, Lamata P, Stoeck CT, et al. Studying Dynamic Myofiber Aggregate Reorientation in Dilated Cardiomyopathy Using in Vivo Magnetic Resonance Diffusion Tensor Imaging. Circ Cardiovasc Imaging. 2016;9(10).
10. Nielles-Vallespin S, Khalique Z, Ferreira P, de Silva R, Scott A, Kilner P, McGill L, Giannakidis A, Gatehouse P, Ennis D, Aliotta E, Al-Khalil M, Kellman P, Mazilu D, Balaban R, Firmin D, Arai A, Pennell D. Assessment of Myocardial Microstructural Dynamics by In Vivo Diffusion Tensor Cardiac Magnetic Resonance. JACC. 2017;69(6)
11. Wilm B, Gamper U, Henning A, et al. Diffusion-weighted imaging of the entire spinal cord. NMR Biomed. 2009;22(2):174-81
12. Vishnevskiy V, Gass T, Szekely G, Tanner C, Goksel O. Isotropic Total Variation Regularization of Displacements in Parametric Image Registration. IEEE Trans Med Imaging [Internet]. 2016;62(c):1–1
13. McGill L, Ismail T, Nielles-Vallespin S, Ferreira P, Scott A, Roughton M, Kilner P, Ho S, McCarthy K, Gatehouse P, de Silva R, Speier P, Feiweier T, Mekkaoui C, Sosnovik D, Prasad S, Firmin D, Pennell D. Reproducibility of in-vivo diffusion tensor cardiovascular magnetic resonance in hypertrophic cardiomyopathy. JCMR.2012;14
14. Nielles-Vallespin S, Mekkaoui C, Gatehouse P, Reese TG, Keegan J, Ferreira PF, Collins S, Speier P, Feiweier T, de Silva R, Jackowski MP, Pennell DJ, Sosnovik DE, Firmin D. In vivo diffusion tensor MRI of the human heart: reproducibility of breath-hold and navigator-based approaches. Magn Reson Med. 2013;70
15. Tunnicliffe E, Scott A, Ferreira P, Ariga R, McGill L, Nielles-Vallespin S, Neubauer S, Pennell D, Robson M, Firmin D. Intercentre reproducibility of cardiac apparent diffusion coefficient and fractional anisotropy in healthy volunteers. JCMR.2014;16(1)
Figures