4885
Prognostic value of cardiac T1 mapping in Pulmonary Arterial Hypertension1University of Sheffield, Sheffield, United Kingdom, 2Hokkaido University, Sapporo, Japan, 3University of Cambridge, Cambridge, United Kingdom
Synopsis
Native T1 mapping of the myocardium was performed in 223 patients with pulmonary arterial hypertension. Patients with higher right ventricular (RV) insertion point T1 were less likely to survive than patients with lower inter-ventricular insertion point T1, however when assessed in a multivariate Cox regression with other MRI markers of cardiac size and function, inter-ventricular insertion point T1 was not an independent predictor of mortality.
Introduction
T1 mapping is an emerging tool in understanding myocardial changes in cardiac disease. Patients with pulmonary arterial hypertension (PAH) have elevated pulmonary arterial pressure, causing elevated load on, and ultimately failure of the right ventricle. PAH patients have previously been shown to exhibit regional elevation of T1 in the inter-ventricular insertion points [1:3]. It is however, unknown whether T1 elevation in this region adds any additional prognostic value over established functional cardiac MRI markers. The purpose of this work is to establish whether there is prognostic value to myocardial T1 values measured at the inter-ventricular insertion point, septum and left ventricular free wall in patients with PAH.Methods
223 consecutive patients with PAH who underwent 1.5T MRI protocol including 2D pre-contrast MOLLI (acquisition: 3-5-5; flip angle: 35; TR: 3.2ms; TE: 1.41ms: sensitivity encoding factor: 2; FOV: 400mm; slice thickness: 5.1mm), which were registered to correct motion using synthetic images [4]. Short axis cine images were acquired using a multi-slice balanced steady state free precession sequence (T1: 1.6mm; TR: 3.7MS; bandwidth: 125KHz/pixel; matrix: 256x256; FOV: 480mm; temporal phases per cardiac cycle: 20) from which right and left ventricular end diastolic volume, ventricular end systolic volume, ventricular ejection fraction, and mass were calculated. Diastolic septal angle and systolic septal angle were also measured, see Figure 1. Patients underwent CMR at a PH referral central in 2015 and the census for mortality was performed after an average follow up period of 14±4 months.
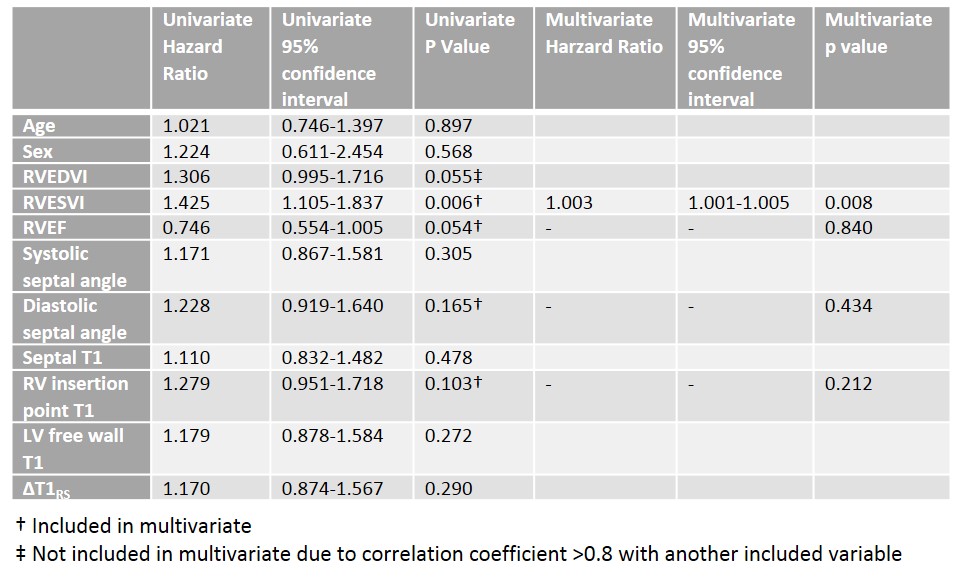
Prognostic value of T1 was assessed using a log-rank test comparing survival in patients with PAH with a T1≤median T1 and T1>median T1 for each anatomical region of interest. A multivariate Cox regression analysis was performed using a forward stepwise approach. All T1 regions and all MRI measures of cardiac size and function that were significant at univariate analysis (p<0.2) were inserted into the multivariate regression.
Results
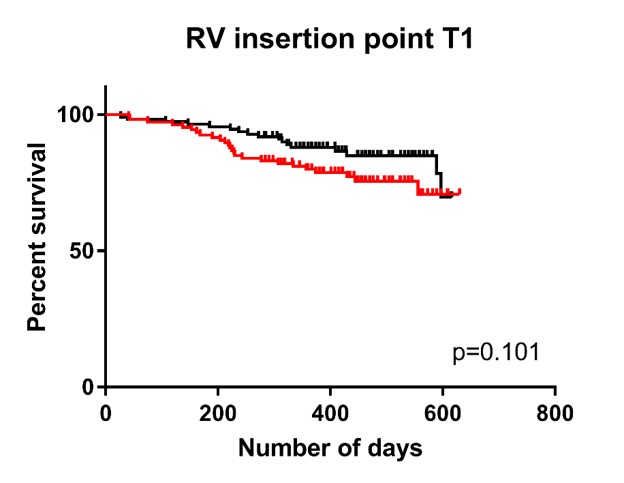
42 patients died within the follow up period. A log-rank test comparing survival in patients with PAH found RV insertion point T1 to be the most significant predictor of patient mortality when dichotomised above and below median value (p=0.101) and a survival plot was produced, see Figure 1. Septal and left ventricular free wall T1 were found not to be significant predictors of survival. Both septal and left ventricular free wall T1 were significant at univariate analysis and included into multivariate Cox regression. However, only right ventricular end systolic volume index was a significant independent predictor of mortality, see Figure 2.Discussion and Conclusion
Although the log-rank test showed patients with higher RV insertion point T1 were less likely to survive than patients with lower RV insertion point T1, RV insertion point T1 was not predictive independent of right ventricular volume at end-systole. The follow up period during this study was relatively short and the majority of patients (85%) were alive at follow up. Therefore, follow up at a later period may be required to provide more definitive evidence whether or not RV insertion point T1 has independent prognostic value.Acknowledgements
No acknowledgement found.References
[1] Roller, F.C., et al., Native T1 mapping and extracellular volume fraction measurement for assessment of right ventricular insertion point and septal fibrosis in chronic thromboembolic pulmonary hypertension. Eur Radiol, 2016.
[2] Spruijt, O.A., et al., Increased native T1-values at the interventricular insertion regions in precapillary pulmonary hypertension. Int J Cardiovasc Imaging, 2016. 32(3): p. 451-9.
[3] Reiter, U., et al., Native myocardial T1 mapping in pulmonary hypertension: correlations with cardiac function and hemodynamics. European radiology, 2017. 27(1): p. 157-166. [4] Saunders, L.C, et al. Abstract 4765: Non-iterative model for synthetic image-based registration of MOLLI cardiac T1 mapping images. ISMRM 2017.
Figures