4883
Native T1 Mapping for Characterization of Acute and Chronic Myocardial Infarction in Swine: Comparison with Contrast-enhanced MRI1Department of Radiology, West China Hospital, Sichuan University, Chengdu, China, 2Department of Radiology, West China Second University Hospital, Sichuan University, Chengdu, China
Synopsis
Native T1 mapping is a novel technique that permits quantification of the T1 relaxation time of myocardial tissue without requiring exogenous contrast agents, it could be used as a reliable alternative to LGE in patients with severe renal insufficiency. The present study was conducted to determine and verify the clinical feasibility of native T1 mapping of AMI and CMI as a replacement for LGE and for the discrimination of AMI from CMI in Bama mini-pigs. In our study, native T1 mapping can accurately determine acute and chronic infarct areas as well as conventional LGE imaging, however, it cannot distinguish acute from chronic myocardial infarction.
Introduction
Late-gadolinium-enhanced (LGE) cardiac MRI is currently one of the most commonly used methods for clinical detection of myocardial infarction (MI), however, it requires the administration of gadolinium-based contrast agent, which is contraindicated in patients with severe kidney dysfunction.1 Native T1 mapping is a novel technique that permits quantification of the T1 relaxation time of myocardial tissue without requiring exogenous contrast agents, it could be used as a reliable alternative to LGE in patients with severe renal insufficiency. In the absence of viable myocardial cells after an ischemic insult, both acute and chronic myocardial infarction (AMI and CMI, respectively) will fail to take up contrast agents and will consequently exhibit delayed enhancement (DE), regardless of differences in ischemic time points.2-4 However, clinical decision-making processes frequently require the differentiation of these two types of myocardial injury.5 A previous study found that the native T1 values of infarcted areas were higher in AMI than CMI.6 However, another study found that T1 mapping could not distinguish AMI from CMI when using simple thresholds.7 Accordingly, we hypothesized that native T1 mapping, performed by measuring the T1 values of hyperintense areas, could potentially differentiate AMI from CMI. Therefore, the present study was conducted to determine and verify the clinical feasibility of native T1 mapping of AMI and CMI as a replacement for LGE and for the discrimination of AMI from CMI.Methods
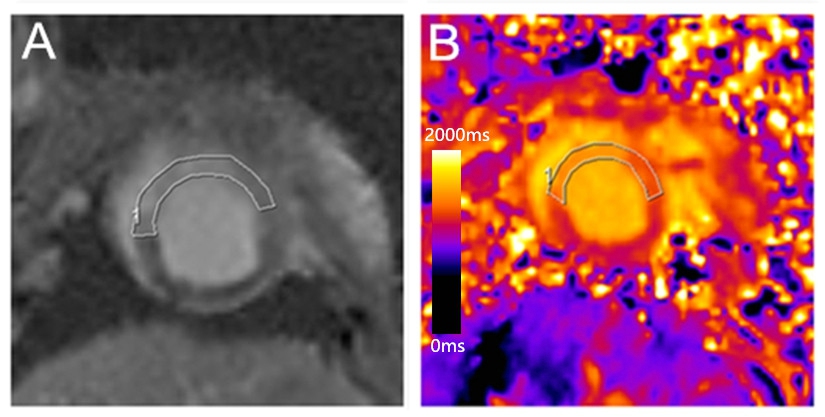
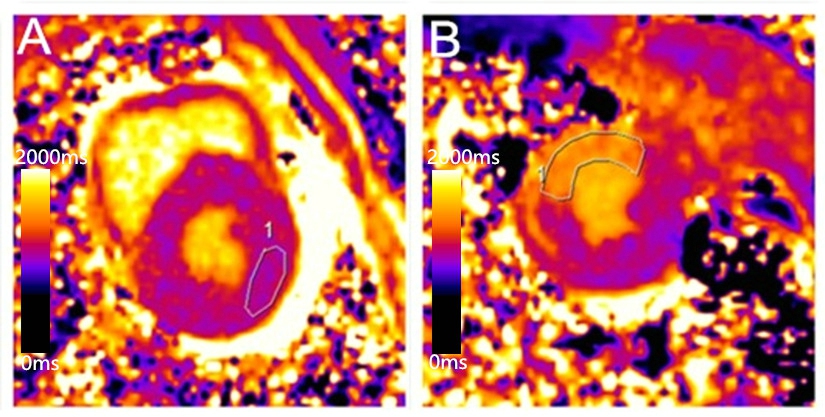
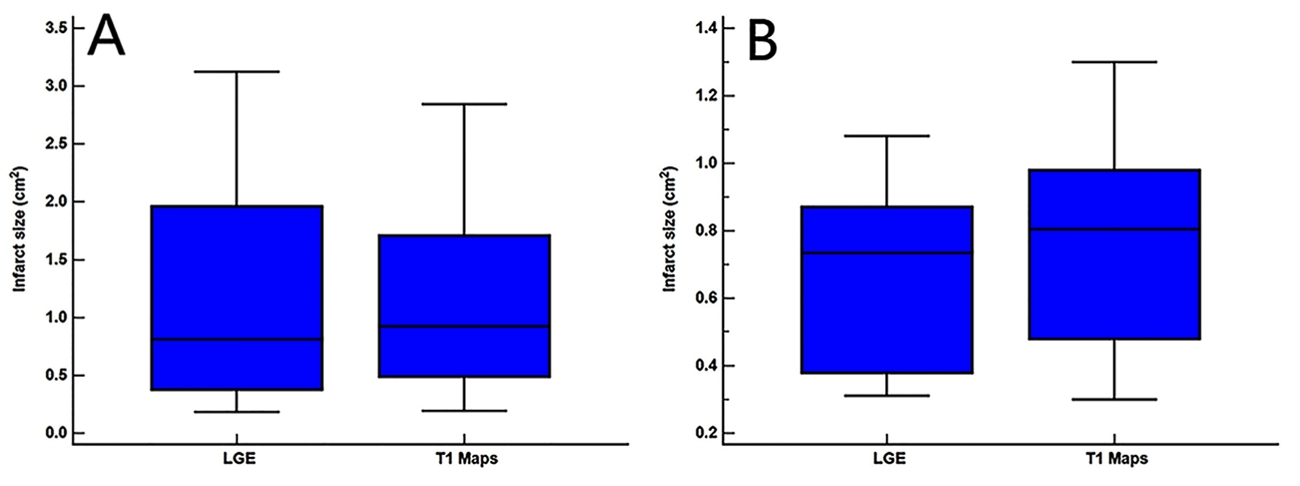
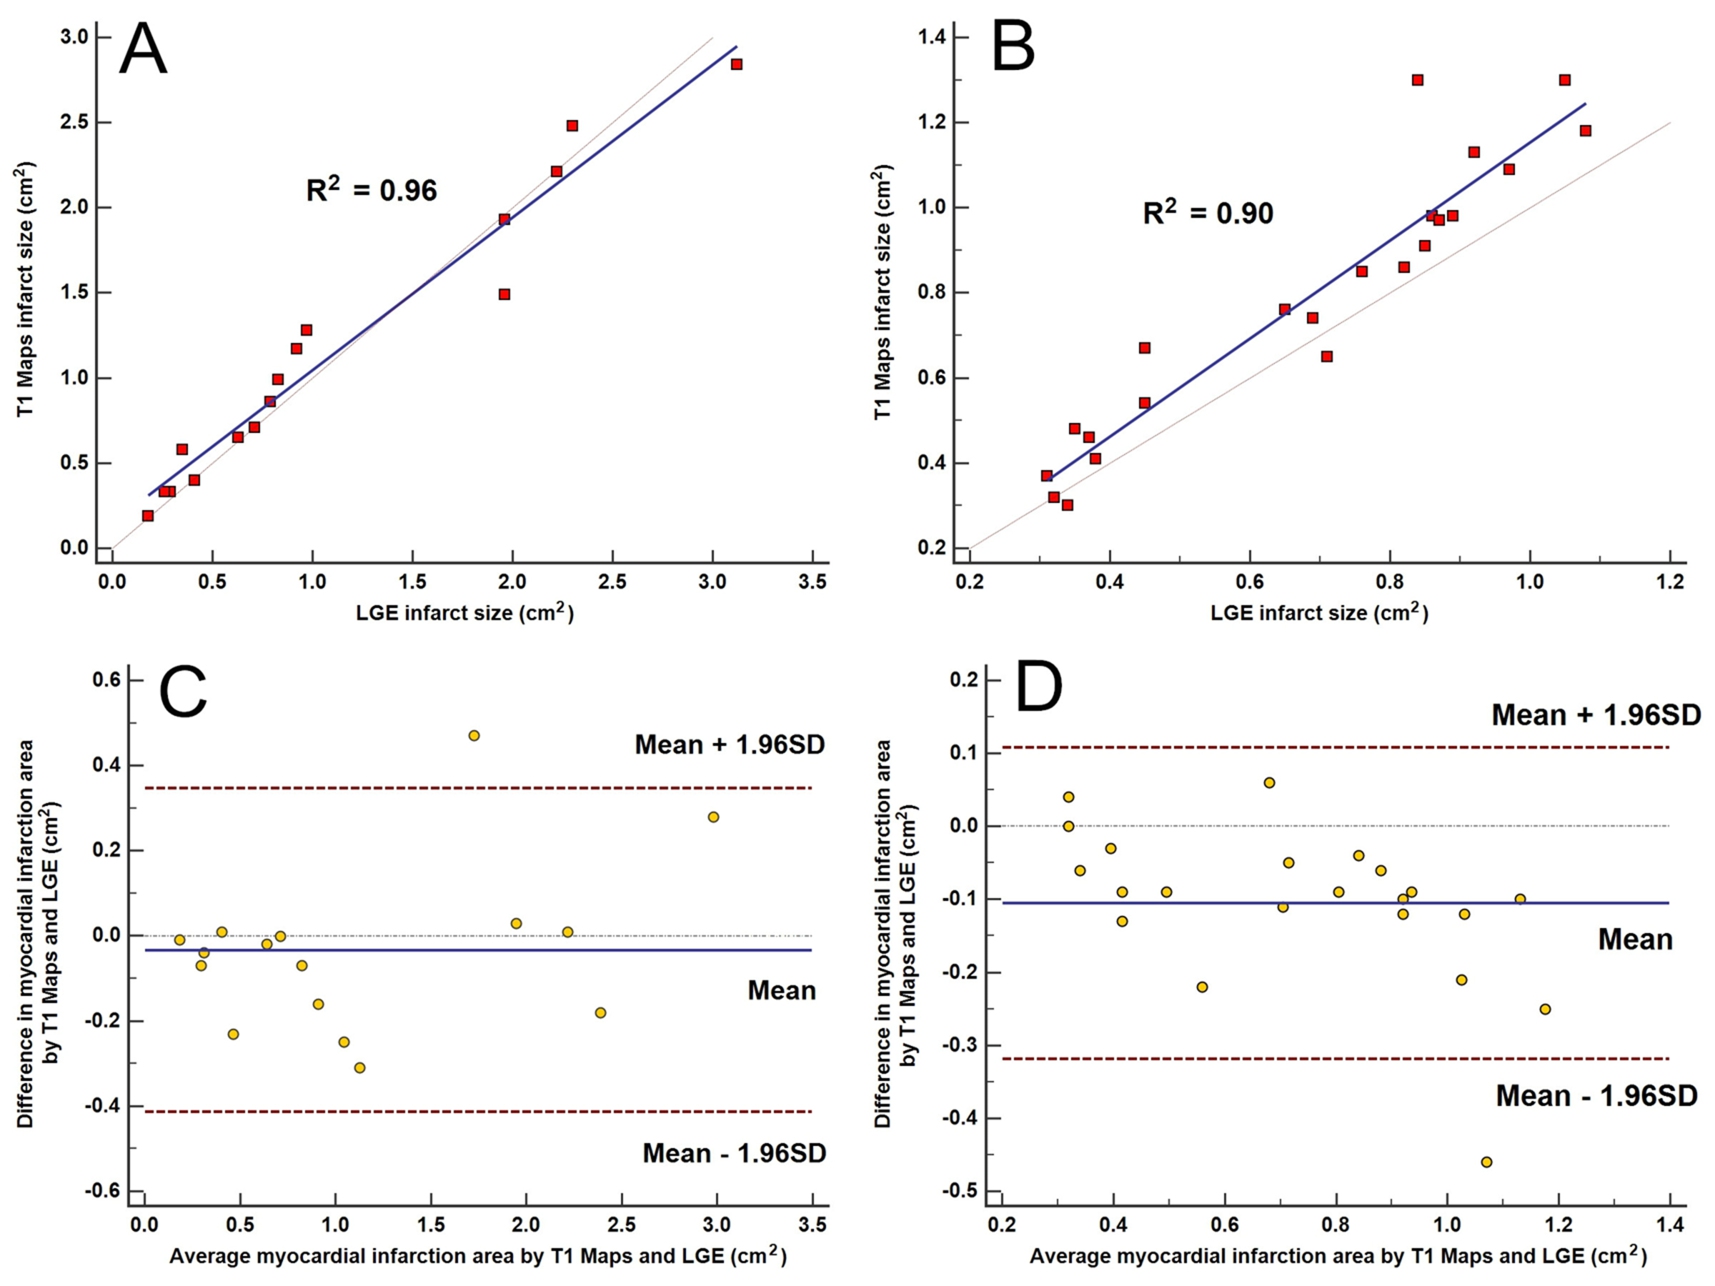
Twelve and fifteen Bama mini-pig models of AMI and CMI underwent cardiac magnetic resonance. The infarct sizes were compared on matching short-axis slices of LGE images and T1 maps, and agreement was determined using linear regression and Bland–Altman analyses. The native T1 values of the infarct and remote myocardium and the T1 signal intensity ratio of these elements (T1 SI ratio) were compared between AMI and CMI models (independent sample t-test). The intraclass correlation coefficient was used to assess inter- and intra-observer variability.Results
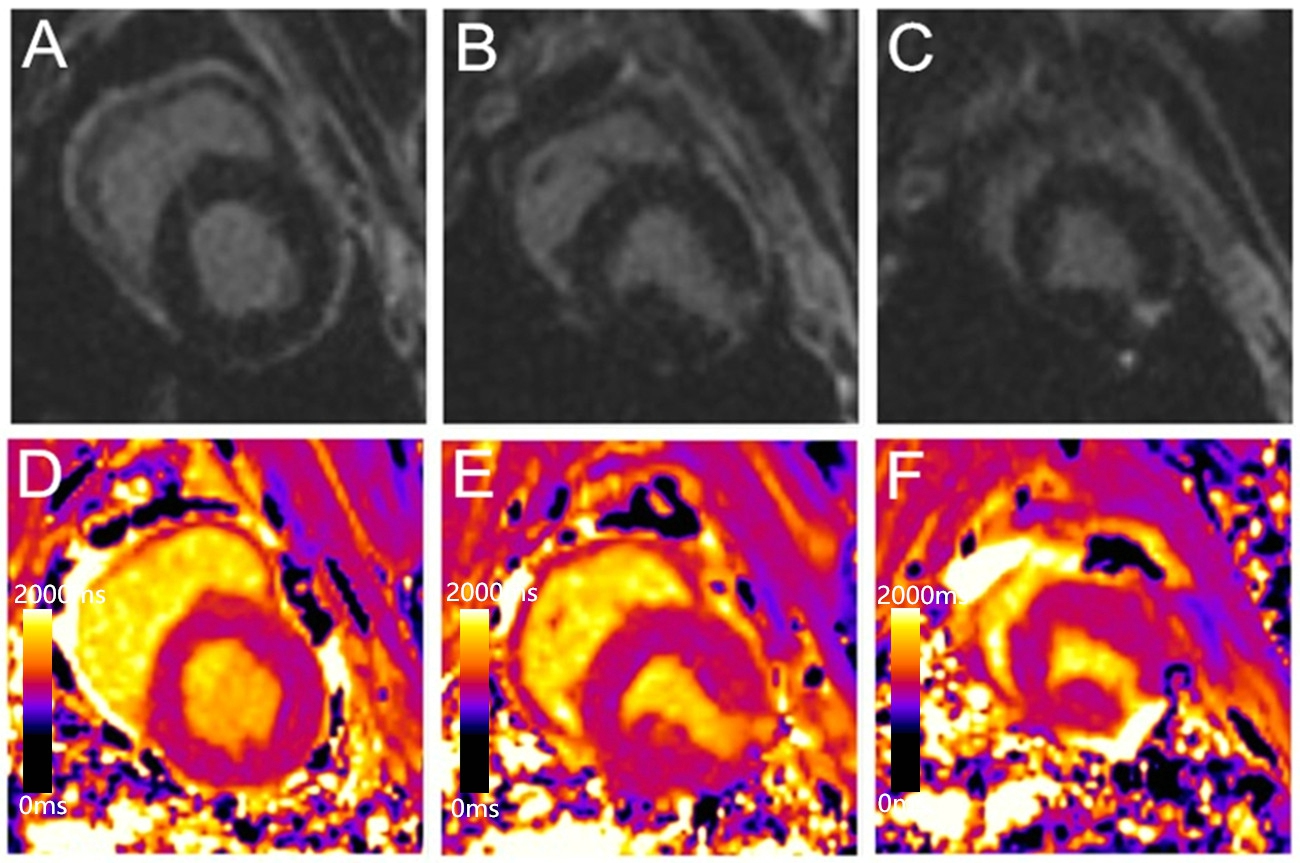
Measured infarct sizes did not differ between native T1 mapping and LGE images (AMI: p = 0.913; CMI: p = 0.233), and good agreement was observed between the two techniques (AMI: bias, −3.38 ± 19.38%; R2 = 0.96; CMI: bias, −10.55 ± 10.90%; R2 = 0.90). Relative to native T1 maps, the mean native infarction myocardium T1 value was approximately 349.88 ms and 294.56 ms higher than those of the remote myocardium in AMI and CMI, respectively. However, the native infarction myocardium T1 values (including mean, max and min values) and T1 SI ratios did not differ significantly between AMI and CMI. Both inter- and intra-observer agreements excellent for AMI and CMI.Discussion
Our results revealed that the infarction sizes on LGE images and T1 maps did not differ significantly in either model group, and the two methods exhibited excellent correlations and agreement in terms of delineating the areas of both AMI and CMI. Furthermore, native T1 mapping yielded excellent inter- and intra-observer agreements in both AMI and CMI models, suggesting that this technique can determine the AMI and CMI areas as accurately as conventional LGE imaging. In acute MI, edematous cardiomyocytes cause a loss of membrane integrity, which leads to communication between the extracellular and intracellular spaces and an increased free water content in the infarcted myocardium;5, 8 this is indicated by increasing T1 values. However, in chronic MI, the elevated T1 values might be attributable to the relatively large extracellular matrix resulting from increased fibrosis.5 In our study, we compared the native T1 values of the infarcted myocardium and the T1 SI ratio between the AMI and the CMI in Bama mini-pig models. However, our results demonstrated that the native T1 analysis could not differentiate AMI from CMI.Conclusion
Our study demonstrated the inability of an analysis that measured the native T1 value of the infarcted myocardium to differentiate AMI from CMI. However, native T1 mapping, which does not require contrast agents, could determine the infarct areas in both AMI and CMI at a level comparable to that of conventional LGE imaging. Accordingly, native T1 mapping could be a reliable and safe alternative to LGE imaging for the characterization of AMI or CMI in a patient for whom contrast agent use is contraindicated.Acknowledgements
The authors declare that they have no competing interests.References
1. Ledneva E, Karie S, Launay-Vacher V, et al. Deray Renal safety of gadolinium-based contrast media in patients with chronic renal insufficiency. Radiology 2009; 250:618-28.
2. Choi KM, Kim RJ, Gubernikoff G, et al. Transmural extent of acute myocardial infarction predicts long-term improvement in contractile function. Circulation 2001; 104:1101-7.
3. Wu E, Judd RM, Vargas JD, et al. Visualisation of presence, location, and transmural extent of healed Q-wave and non-Q-wave myocardial infarction. Lancet 2001; 357:21-8.
4. Mahrholdt H, Wagner A, Holly TA, et al. Reproducibility of chronic infarct size measurement by contrast-enhanced magnetic resonance imaging. Circulation 2002; 106:2322-7.
5. Abdel-Aty H, Zagrosek A, Schulz-Menger J, et al. Delayed enhancement and T2-weighted cardiovascular magnetic resonance imaging differentiate acute from chronic myocardial infarction. Circulation 2004; 109:2411-6.
6. Messroghli DR, Walters K, Plein S, et al. Myocardial T1 mapping: application to patients with acute and chronic myocardial infarction. Magn Reson Med 2007; 58:34-40.
7. von Knobelsdorff-Brenkenhoff F, Prothmann M, Dieringer MA, et al. Current T(1) and T(2) mapping techniques applied with simple thresholds cannot discriminate acute from chronic myocadial infarction on an individual patient basis: a pilot study. BMC Med Imaging 2016; 16:35.
8. Dall'Armellina E, Piechnik SK, Ferreira VM, et al. Cardiovascular magnetic resonance by non contrast T1-mapping allows assessment of severity of injury in acute myocardial infarction. J Cardiovasc Magn Reson 2012; 14:15.
Figures