4877
Clinical validation of the T1blood-based synthetic hematocrit used to calculate the ECV on 3T MRI in patients with type 2 diabetes mellitus and hypertrophic cardiomyopathy1Siemens Healthcare Ltd., Shanghai, China, 2Third Military Medical University, Chongqing, China, 3Southwest Hospital, Chongqing, China
Synopsis
Calculation of the extracellular volume fraction is based on a patient’s hematocrit (Hct), which can be obtained via a clinical blood test or can be estimated synthetically according its linear relationship with the native T1 of the blood. However, the reliability of the synthetic Hct needs to be studied further. We therefore assessed the clinical validation of the synthetic Hct compared with the Hct derived from a blood test in patients with type 2 diabetes mellitus and hypertrophic cardiomyopathy.
Introduction:
Myocardial T1 mapping and the extracellular volume fraction (ECV) have been proven to be sensitive probes for detecting a series of heart diseases such as myocarditis, amyloidosis, iron overload, Fabry’s disease, diffuse fibrosis and others. Recently, a new consensus statement was announced by the Society for Cardiovascular Magnetic Resonance, which confirmed the importance of T1 mapping and ECV in the clinical diagnosis of heart disease. Conventionally, a blood test is needed to obtain a patient’s Hct for the calculation of the ECV, a process that can be cumbersome and costly. Therefore, Treibel et al. [1] proposed an estimation of the Hct by a patient’s native T1 value of the blood. This so-called “synthetic Hct” is highly correlated with 1/T1blood and can be used to replace the conventional Hct in the ECV calculation. The validation has been proven by several researchers, such as Graham J. Fent et al. [2] and Andreas A. Kammerlander et al. [3]. According to their study reports, the synthetic Hct performed well on a 1.5T MR scanner, whereas its performance on a 3T MR scanner has not yet been fully assessed. The aim of this study was to evaluate the clinical accuracy of the synthetic Hct on a 3T MR system with both type 2 diabetes mellitus (T2DM) and hypertrophic cardiomyopathy (HCM) patients.Methods:
A total of 172 subjects with cardiovascular magnetic resonance (CMR) T1 were retrospectively enrolled and randomly split into derivation (n = 91) and validation (n = 81) groups, comprising healthy volunteers (n = 42), T2DM patients (n = 60), HCM patients (n = 64), and six other patients. All the CMR scans were performed on a 3T MAGNETOM Trio MR scanner (Siemens Healthcare, Erlangen, Germany) with a 6-channel body coil combined with 6 channels from the spine coil. The native and post-contrast T1 mapping images were measured using a Modified Look-Locker Inversion recovery (MOLLI) prototype sequence with a 5b(3b)3b and 4b(1b)3b(1b)2b scan protocol, respectively. The conventional venous blood test of each subject was measured on the same day before the MR scan. Correlation of the T1blood with the measured Hct (HCTm) was established for the derivation group and used in both the derivation and validation groups. The relationship between the ECV values derived from both the synthetic Hct (HCTs) and the conventional measured Hct (HCTm) was explored. The differences in the ECV values among the healthy controls, T2DMs, and HCMs were compared. All the CMR images were processed by CVI42 software (Circle Cardiovascular Imaging Inc., Calgary, Alberta, Canada). The Kolmogorov-Smirnov test was used to test the normality of the variables. Statistical significance was defined as P < 0.05.Results:
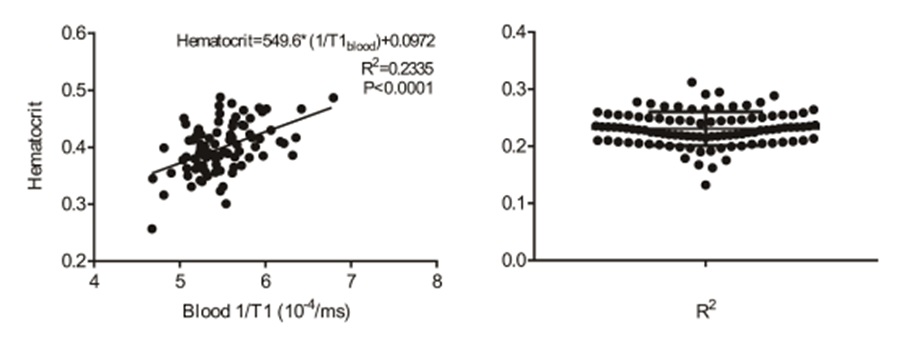
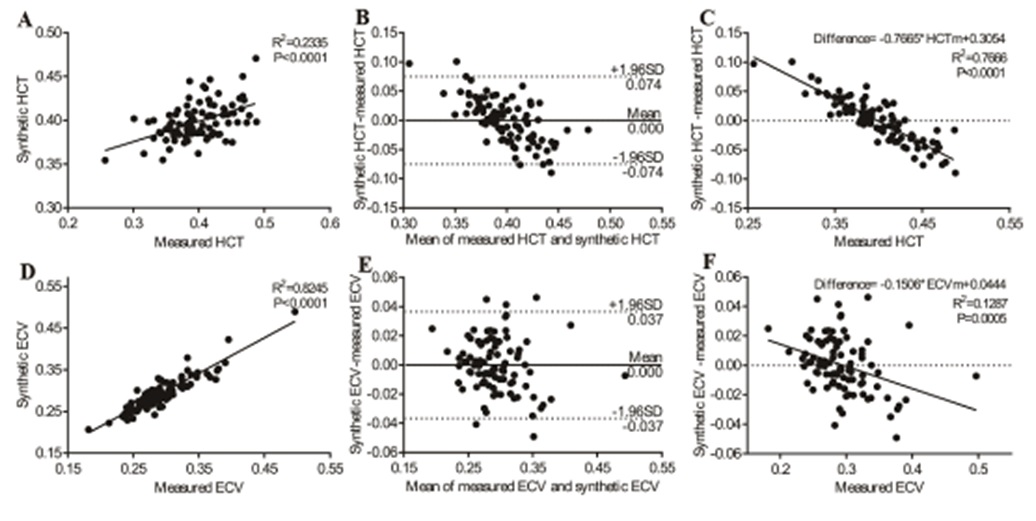
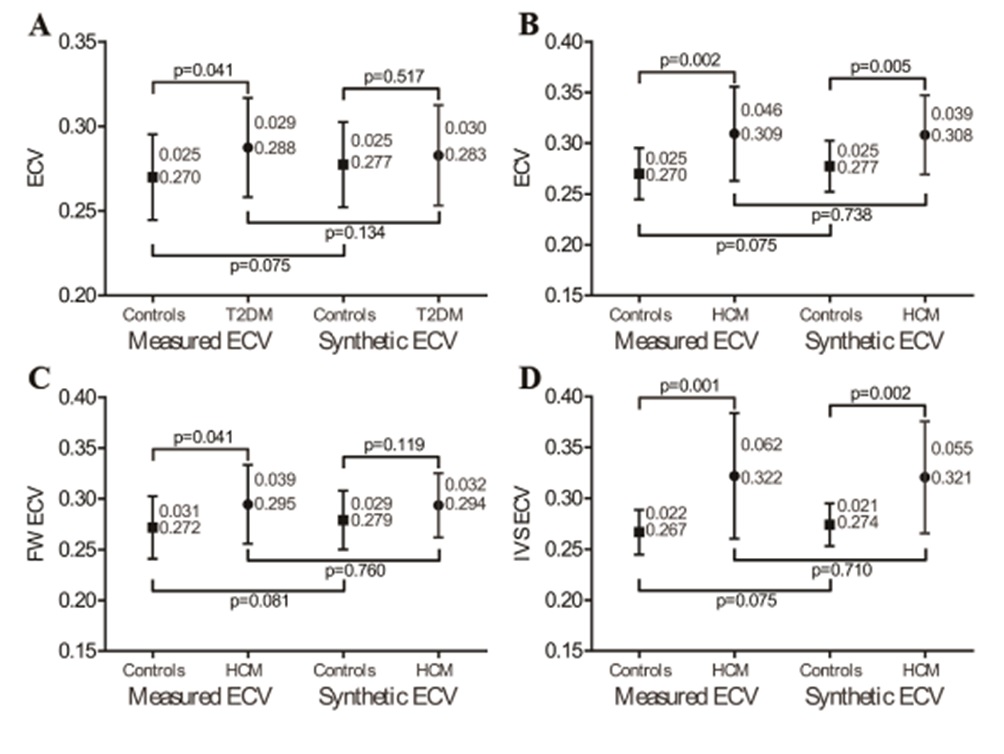
Regression between the HCTm and 1/T1blood was linear (R2 = 0.2335, p < 0.001), and the regression equation was as follows: HCTs = [549.6*(1/T1blood)] + 0.0972 in the derivation group (Figure 1). The conventionally measured ECV (ECVm) was strongly correlated with the synthetic ECV (ECVs) (R2 = 0.8245, p < 0.001) and mildly correlated with the difference between the ECVs and ECVm (R2 = 0.1287, p = 0.005) in the derivation group (Figure 2). Moreover, there was a significant difference in the ECVm value of the mid-ventricle between the T2DMs and the healthy controls (T2DM, 0.288 ± 0.029 vs. healthy controls, 0.270 ± 0.025, p = 0.041), whereas there was no statistically significant difference in the ECVs of the mid-ventricle between the two groups (T2DM, 0.283 ± 0.030 vs. healthy controls, 0.277 ± 0.025, p = 0.517) (Figure 3).Discussion:
Our data showed a linear correlation between the Hct and 1/T1blood on the 3T MR scanner, which is consistent with previous reports. We found that the HCMs were associated with significantly higher ECVs and ECVm of the mid-ventricle in both the derivation and validation groups compared to the healthy controls. Using our center’s normal cut-off of 0.300, the use of ECVs would lead to a 9 ~ 18% / 20 ~ 30% incorrect categorization of patients in the derivation/validation groups.Conclusion:
Synthetic Hct could be a promising alternative in the calculation of the ECV in the CMR routine workflow. However, its validation for specific cardiac diseases needs to be studied further. For patients who have only a subtle elevation in ECV, such as patients with T2DM, the use of the synthetic Hct may lead to an error in the diagnosis.Acknowledgements
No acknowledgement found.References
[1] Thomas A. Treibel, et al., Automatic Measurement of the Myocardial Interstitium – Synthetic Extracellular Volume Quantification Without Hematocrit Sampling, JACC: Cardiovascular Imaging, 2016, 9: 1, http://dx.doi.org/10.1016/j.jcmg.2015.11.008.
[2] Graham J. Fent, et al., Synthetic Myocardial Extracellular Volume Fraction, JACC: Cardiovascular Imaging, 2017, doi: 10.1016/j.jcmg.2016.12.007.
[3] Andreas A. Kammerlander, et al., Extracellular volume quantification by cardiac magnetic resonance imaging without hematocrit sampling, Wien Klin Wochenschr, 2017, https://doi.org/10.1007/s00508-017-1267-y.
Figures