4874
Myocardial fibrosis evaluated by diffusion weighted imaging and and its relationship to three-dimensional global contractile function in patients with hypertrophic cardiomyopathy1Radiology, Ren Ji Hospital, School of Medicine,Shanghai Jiao Tong University, Shanghai, China, 2Philips Healthcare,shanghai, China, Shanghai, China, 3Clinical Application, Circle Cardiovascular Imaging, Calgary, Canada
Synopsis
The prognostic value of the apparent diffusion coefficient (ADC) for diffuse myocardial fibrosis and its relationship to the contractile function is still not investigated. A total of 45 HCM patients and 20 controls underwent a 3.0-T cardiac magnetic resonance imaging (CMRI), including cine, T1 mapping, and DWI. ADC values in the ECV ≥ 29.6% group were significantly increased compared to the ECV < 29.6% group. ADC values were linearly associated with 3D LV GCS, GLS, GCSR, GLSR and GRSR. Impairment of contractile function in HCM is predominantly associated with the contrast-free ADC value.
Abstract
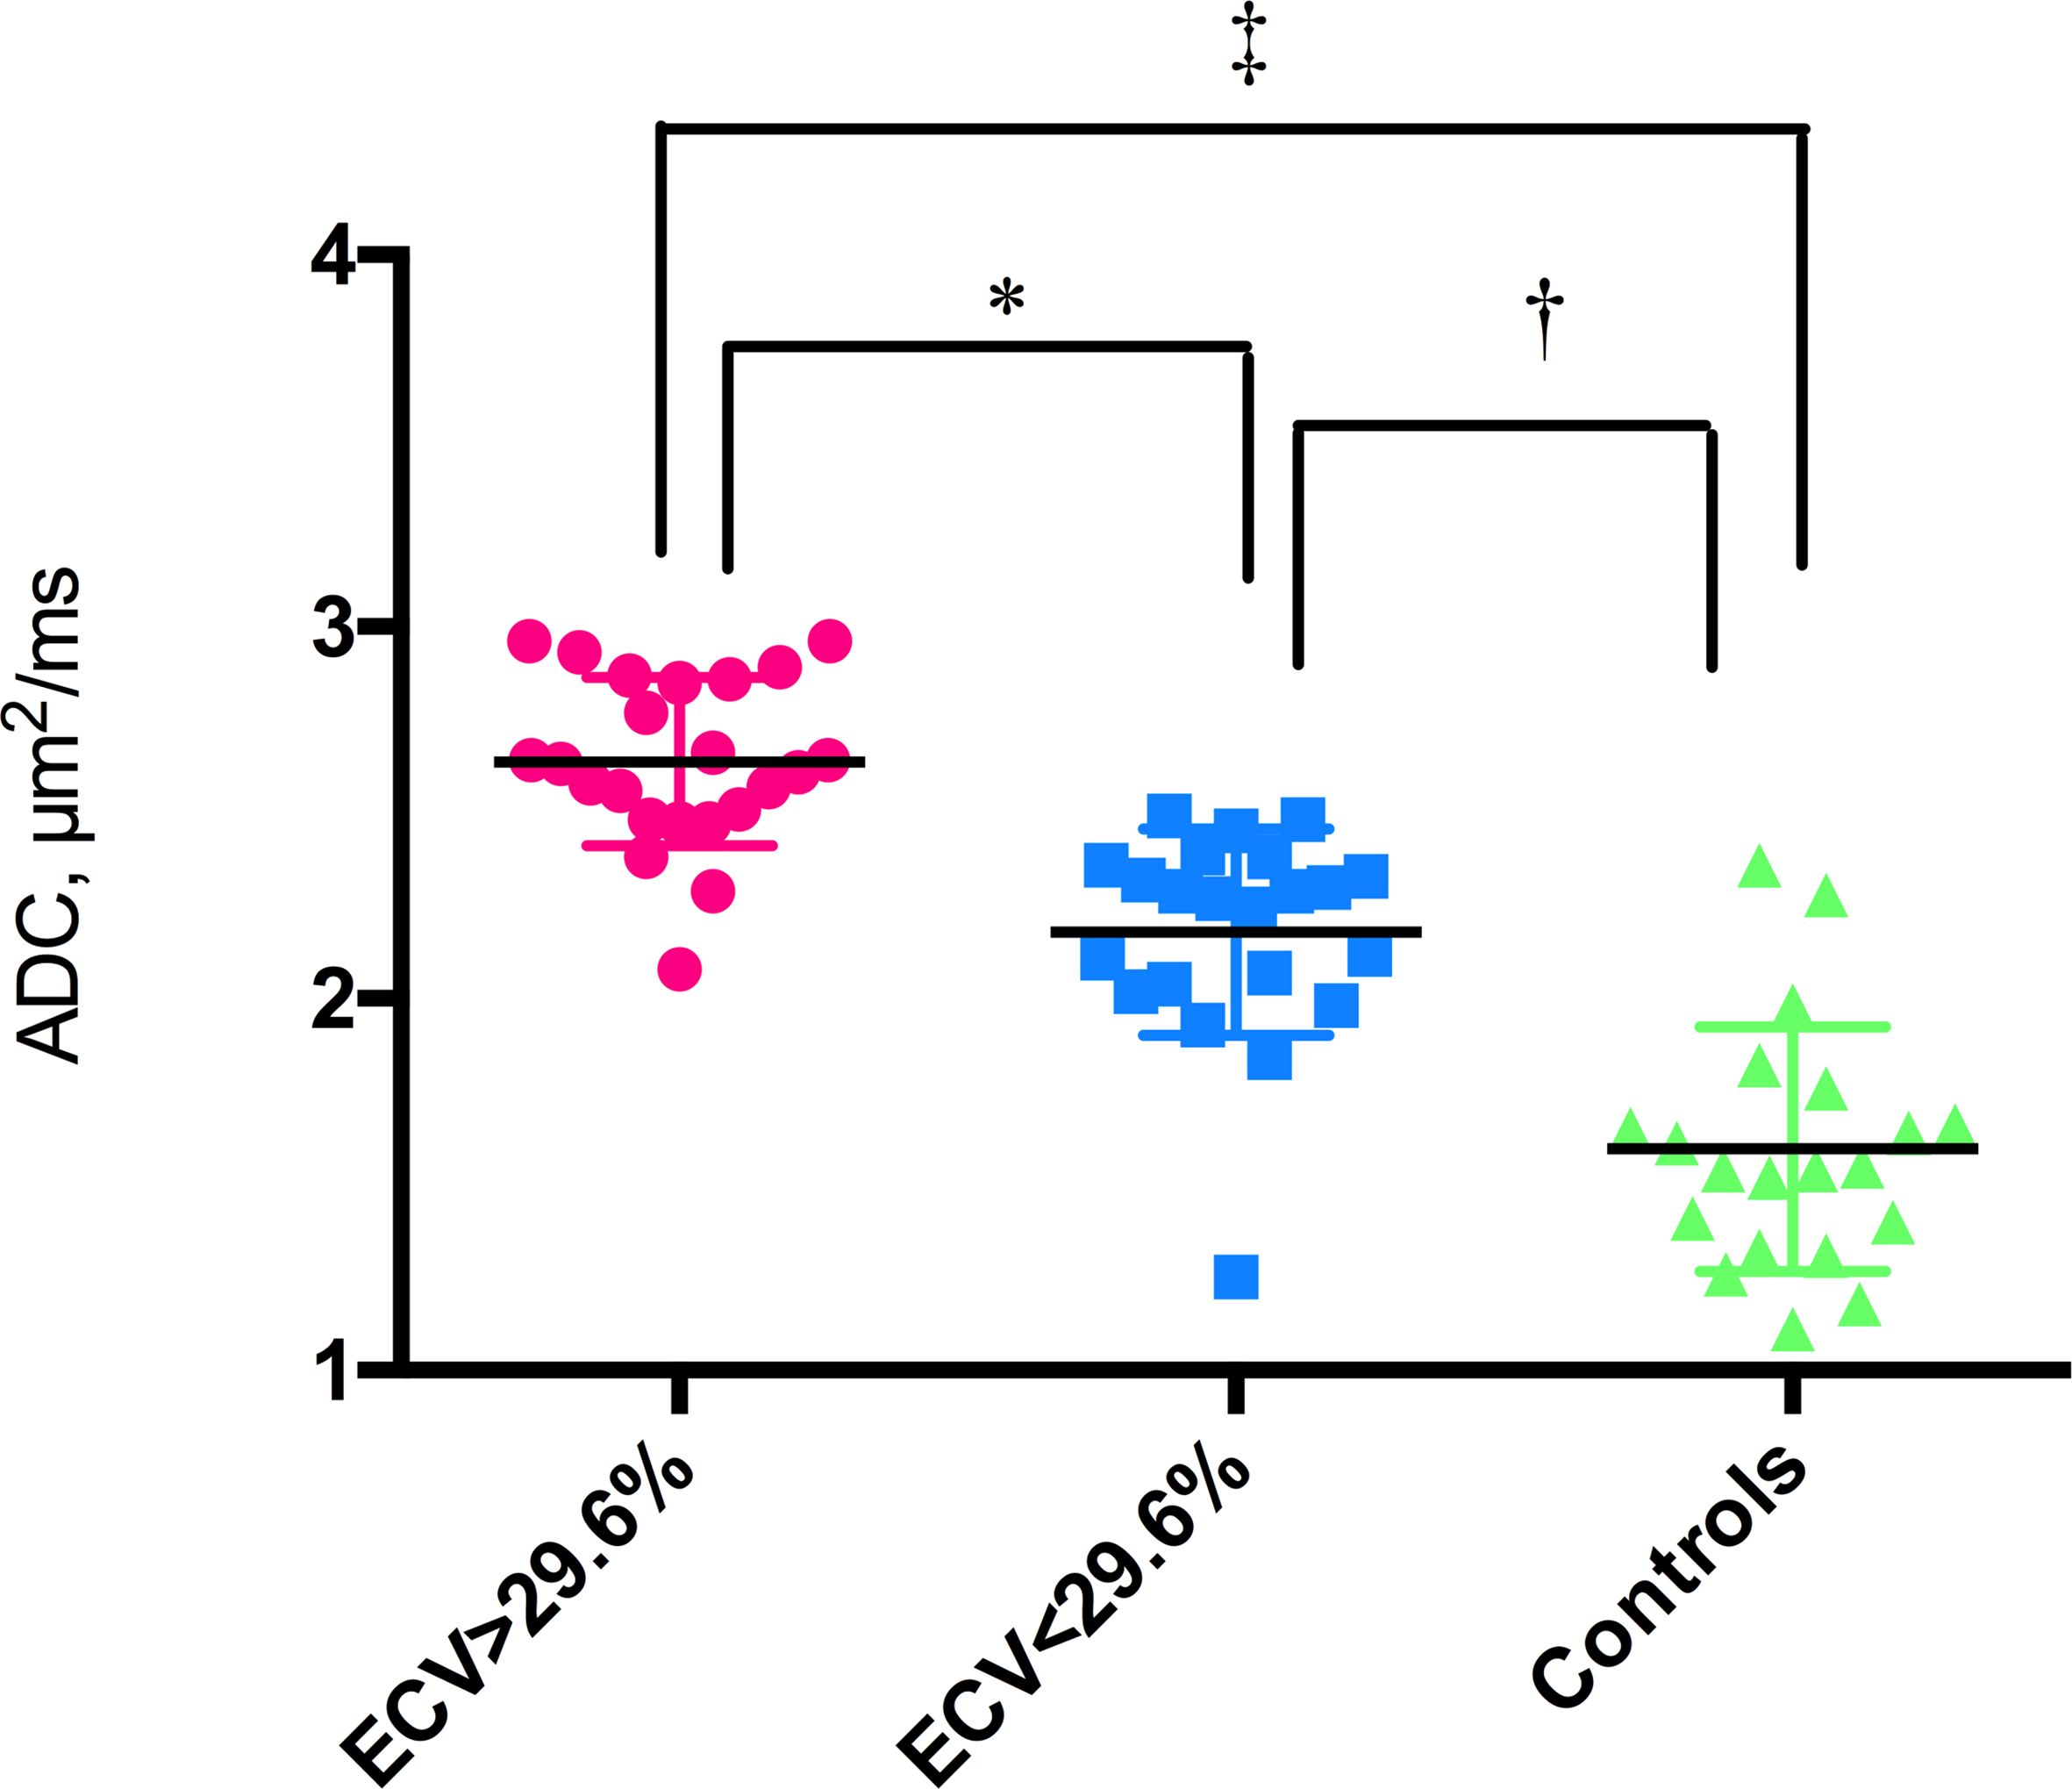
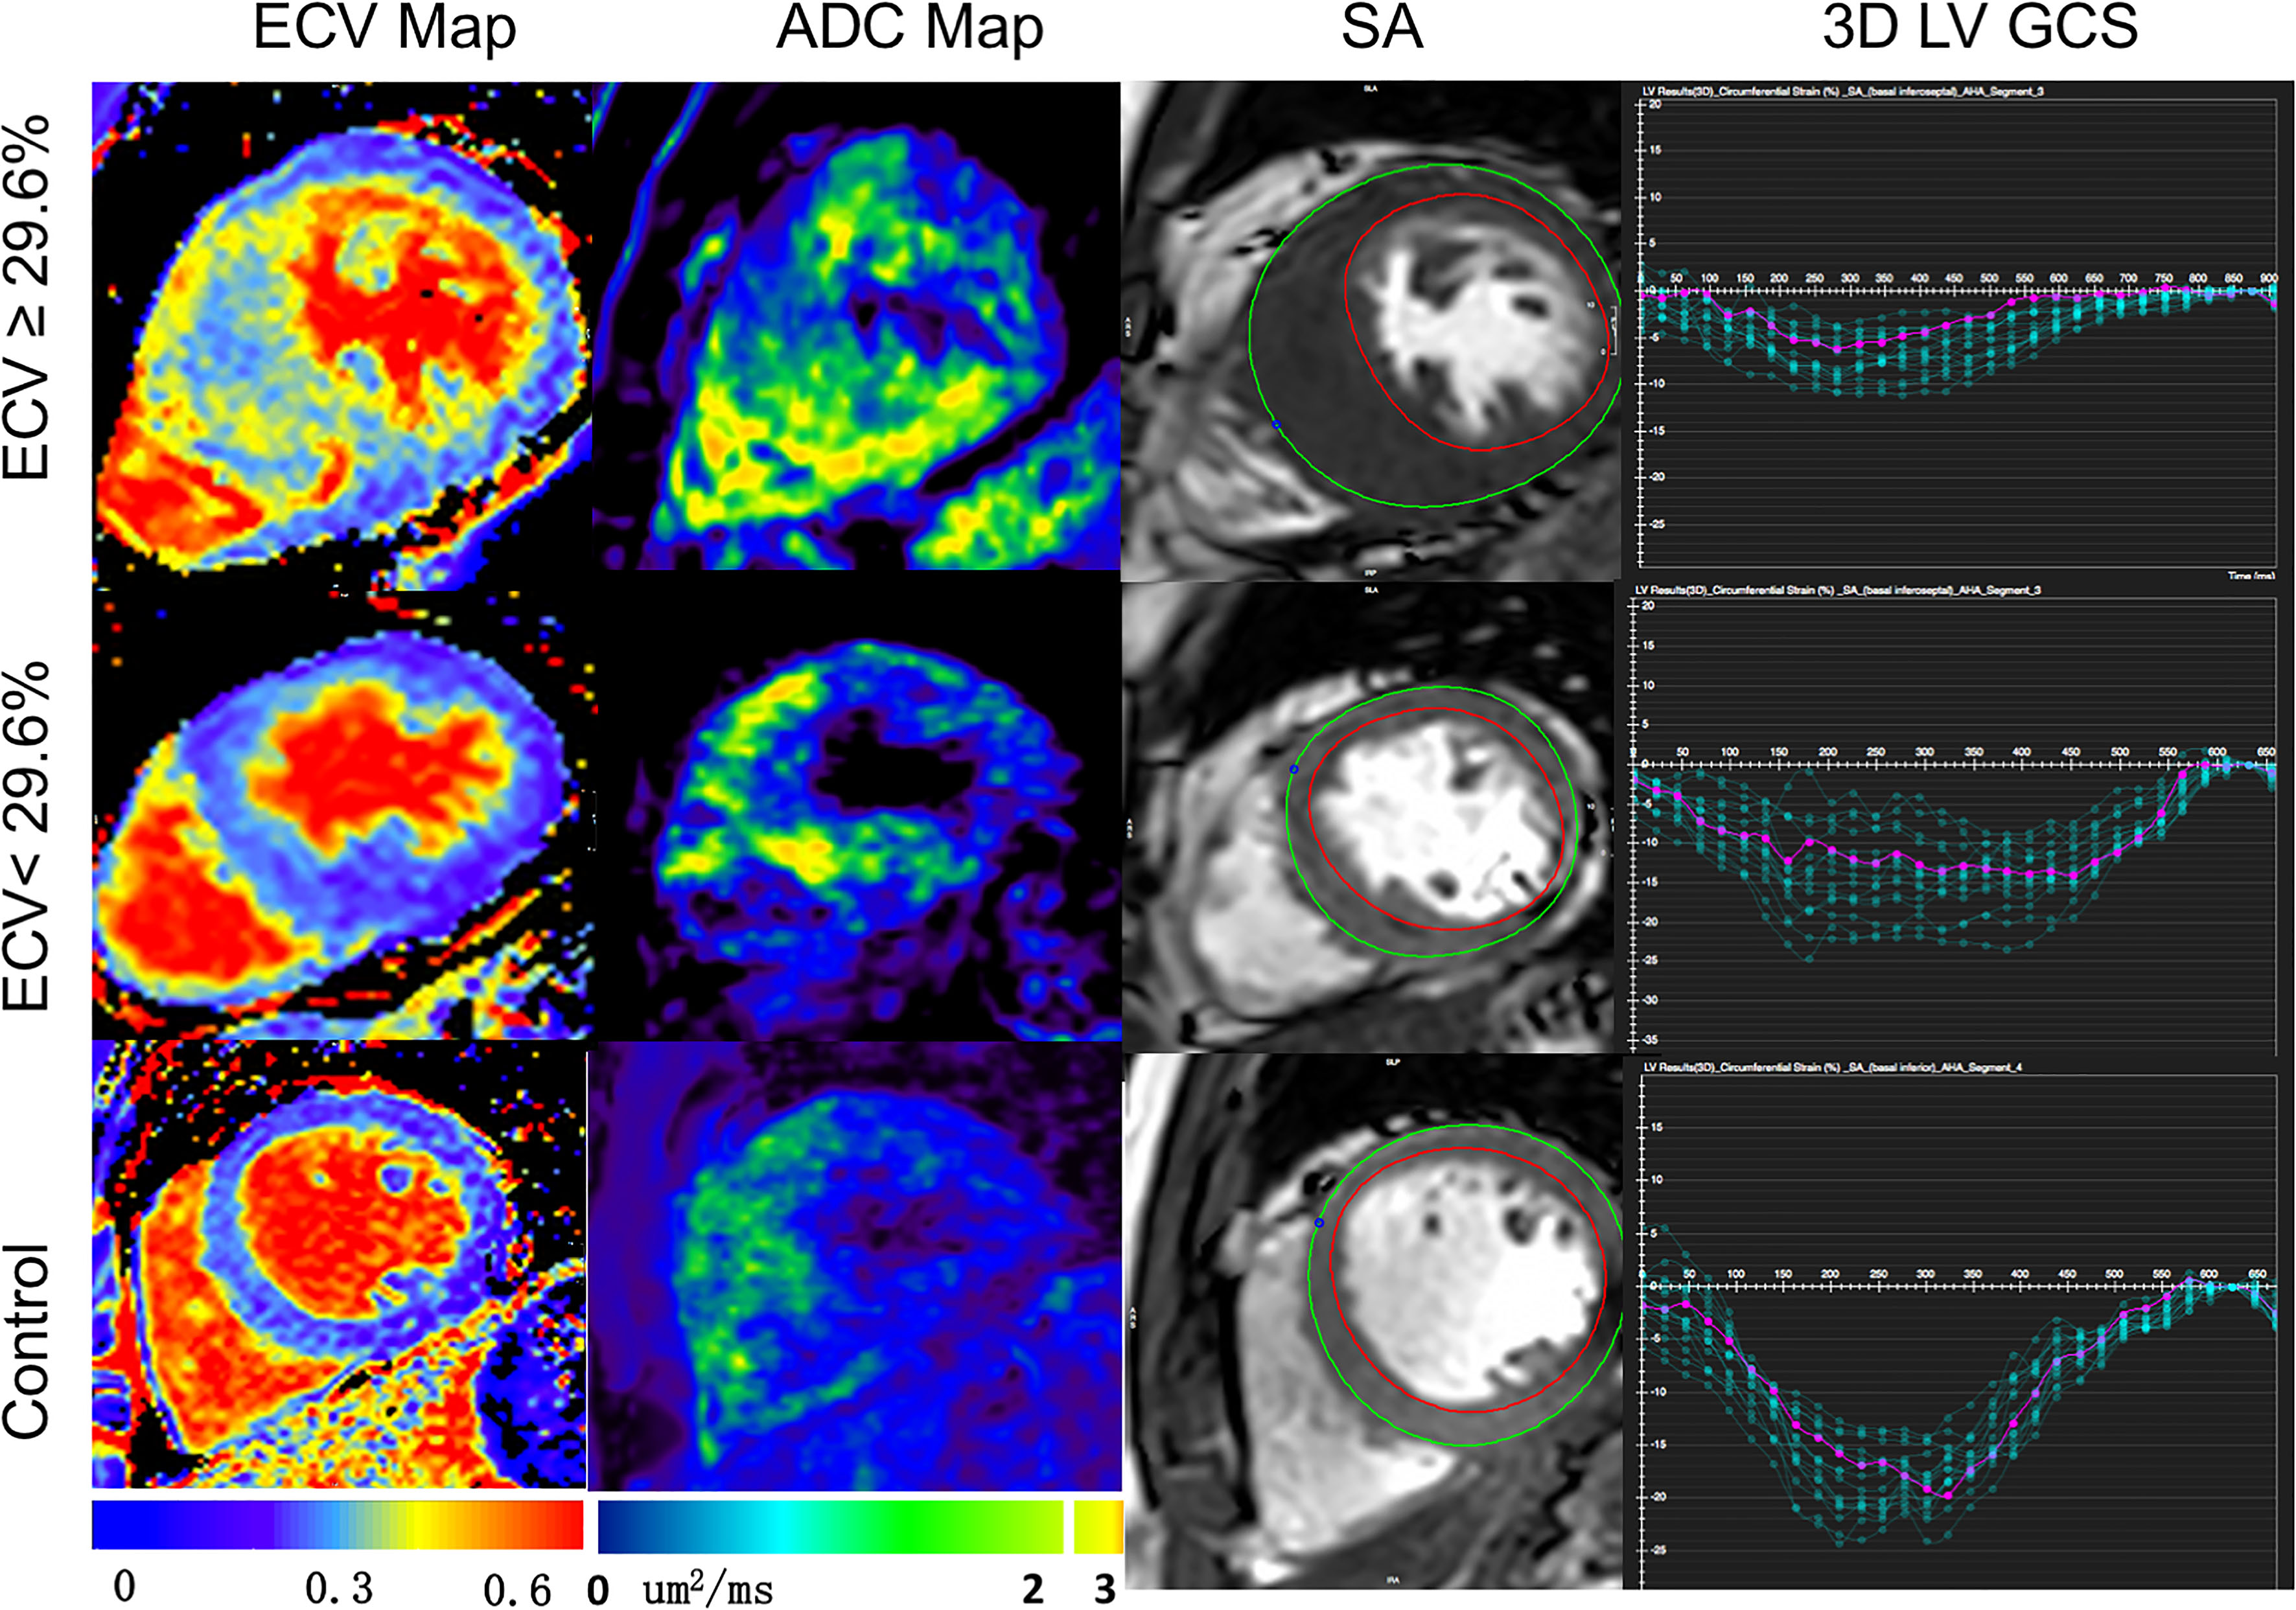
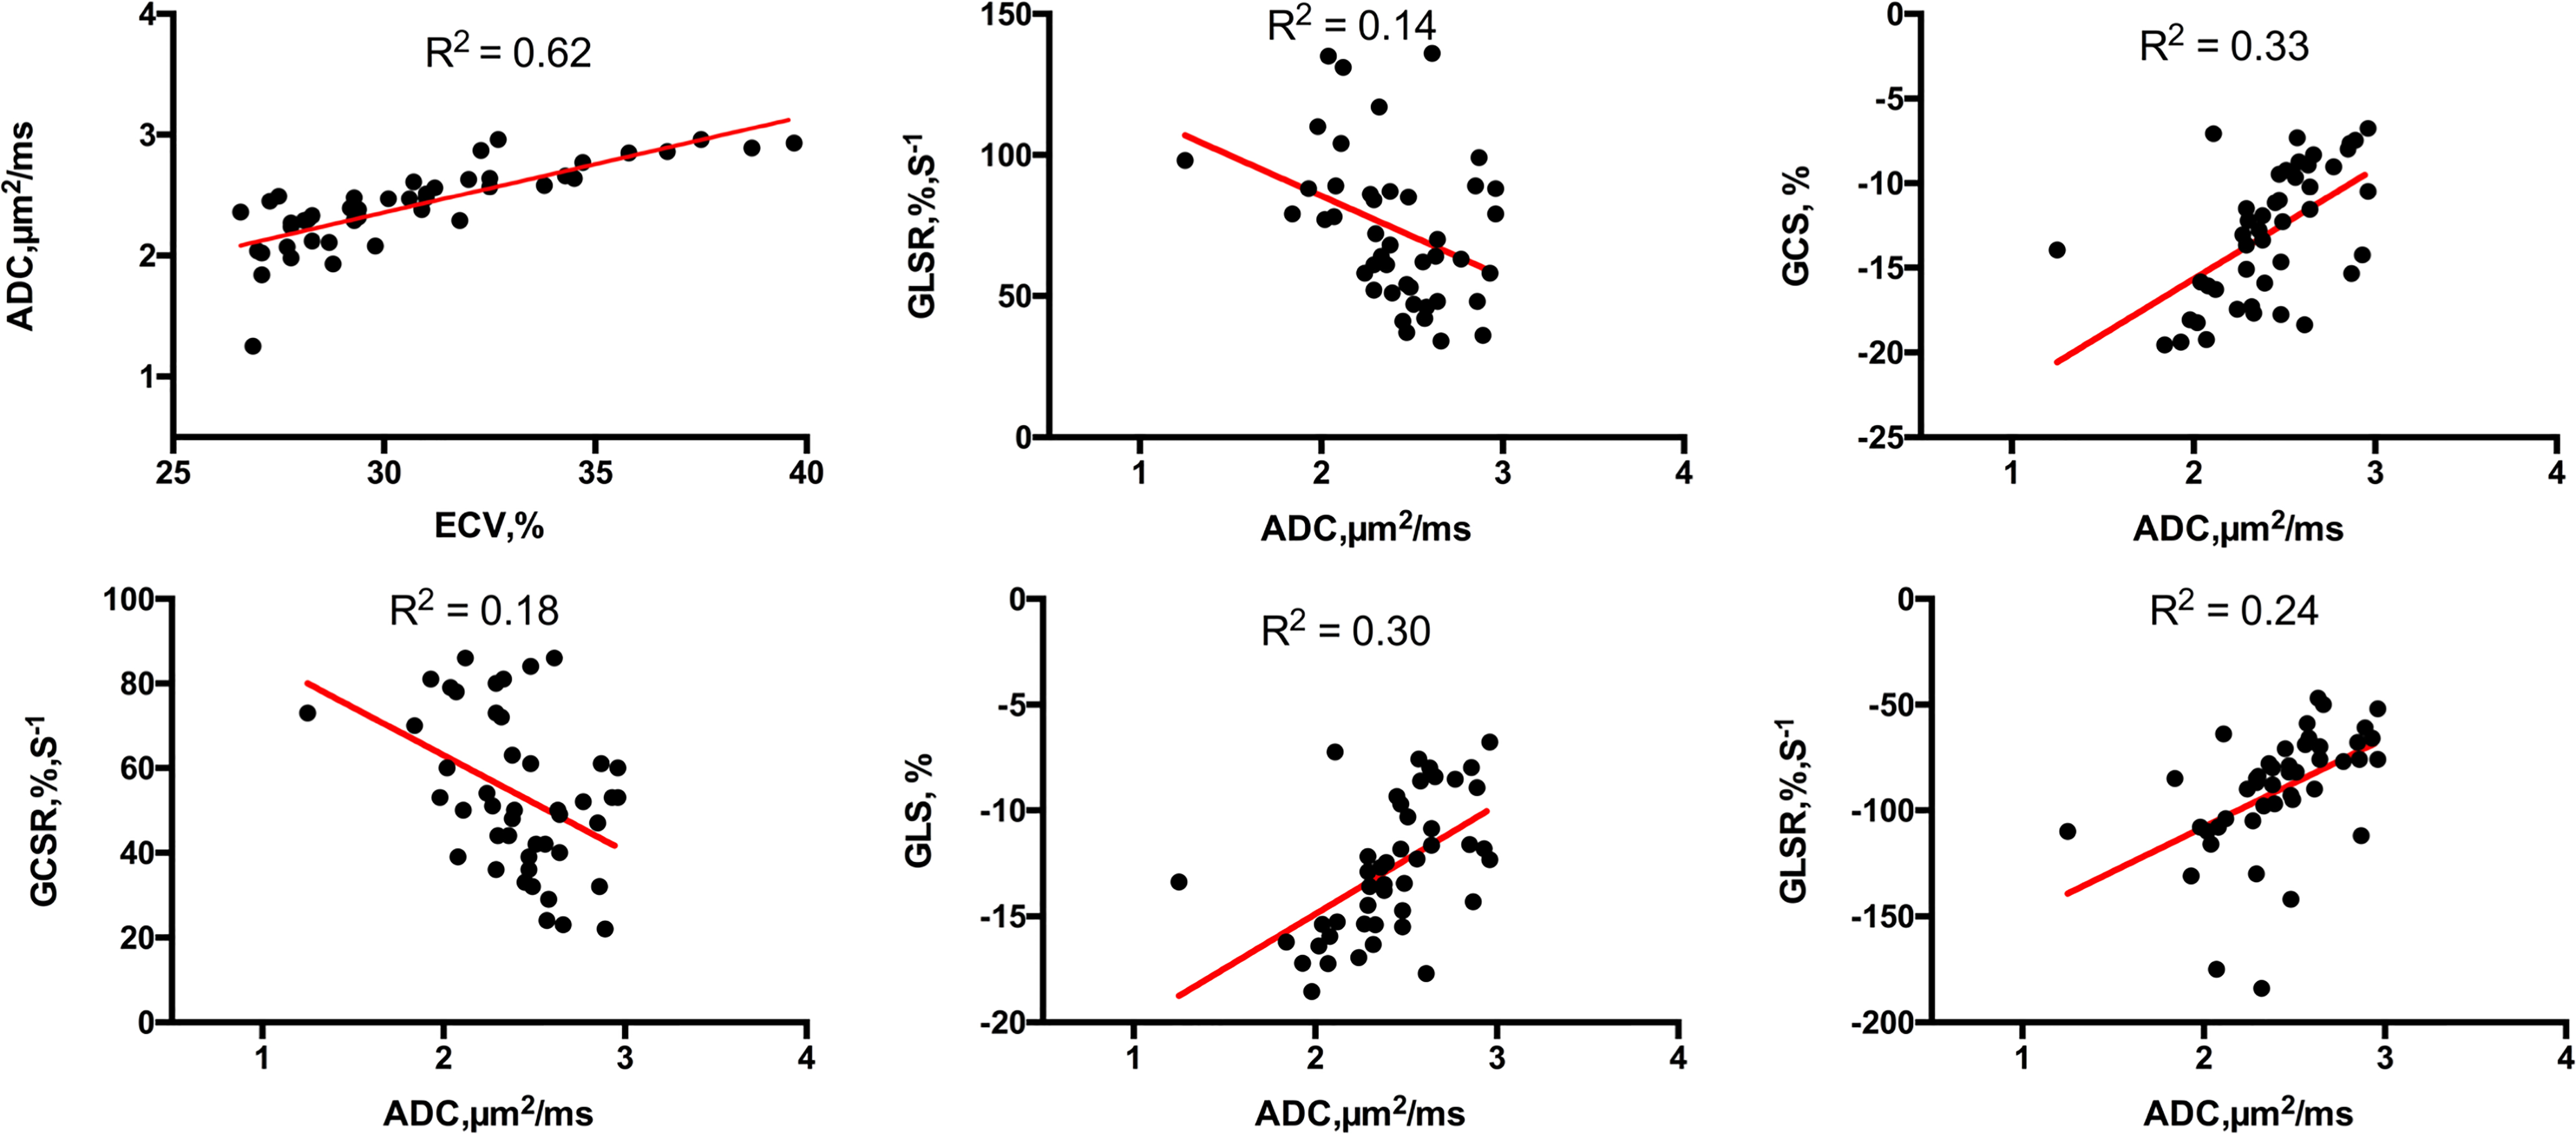
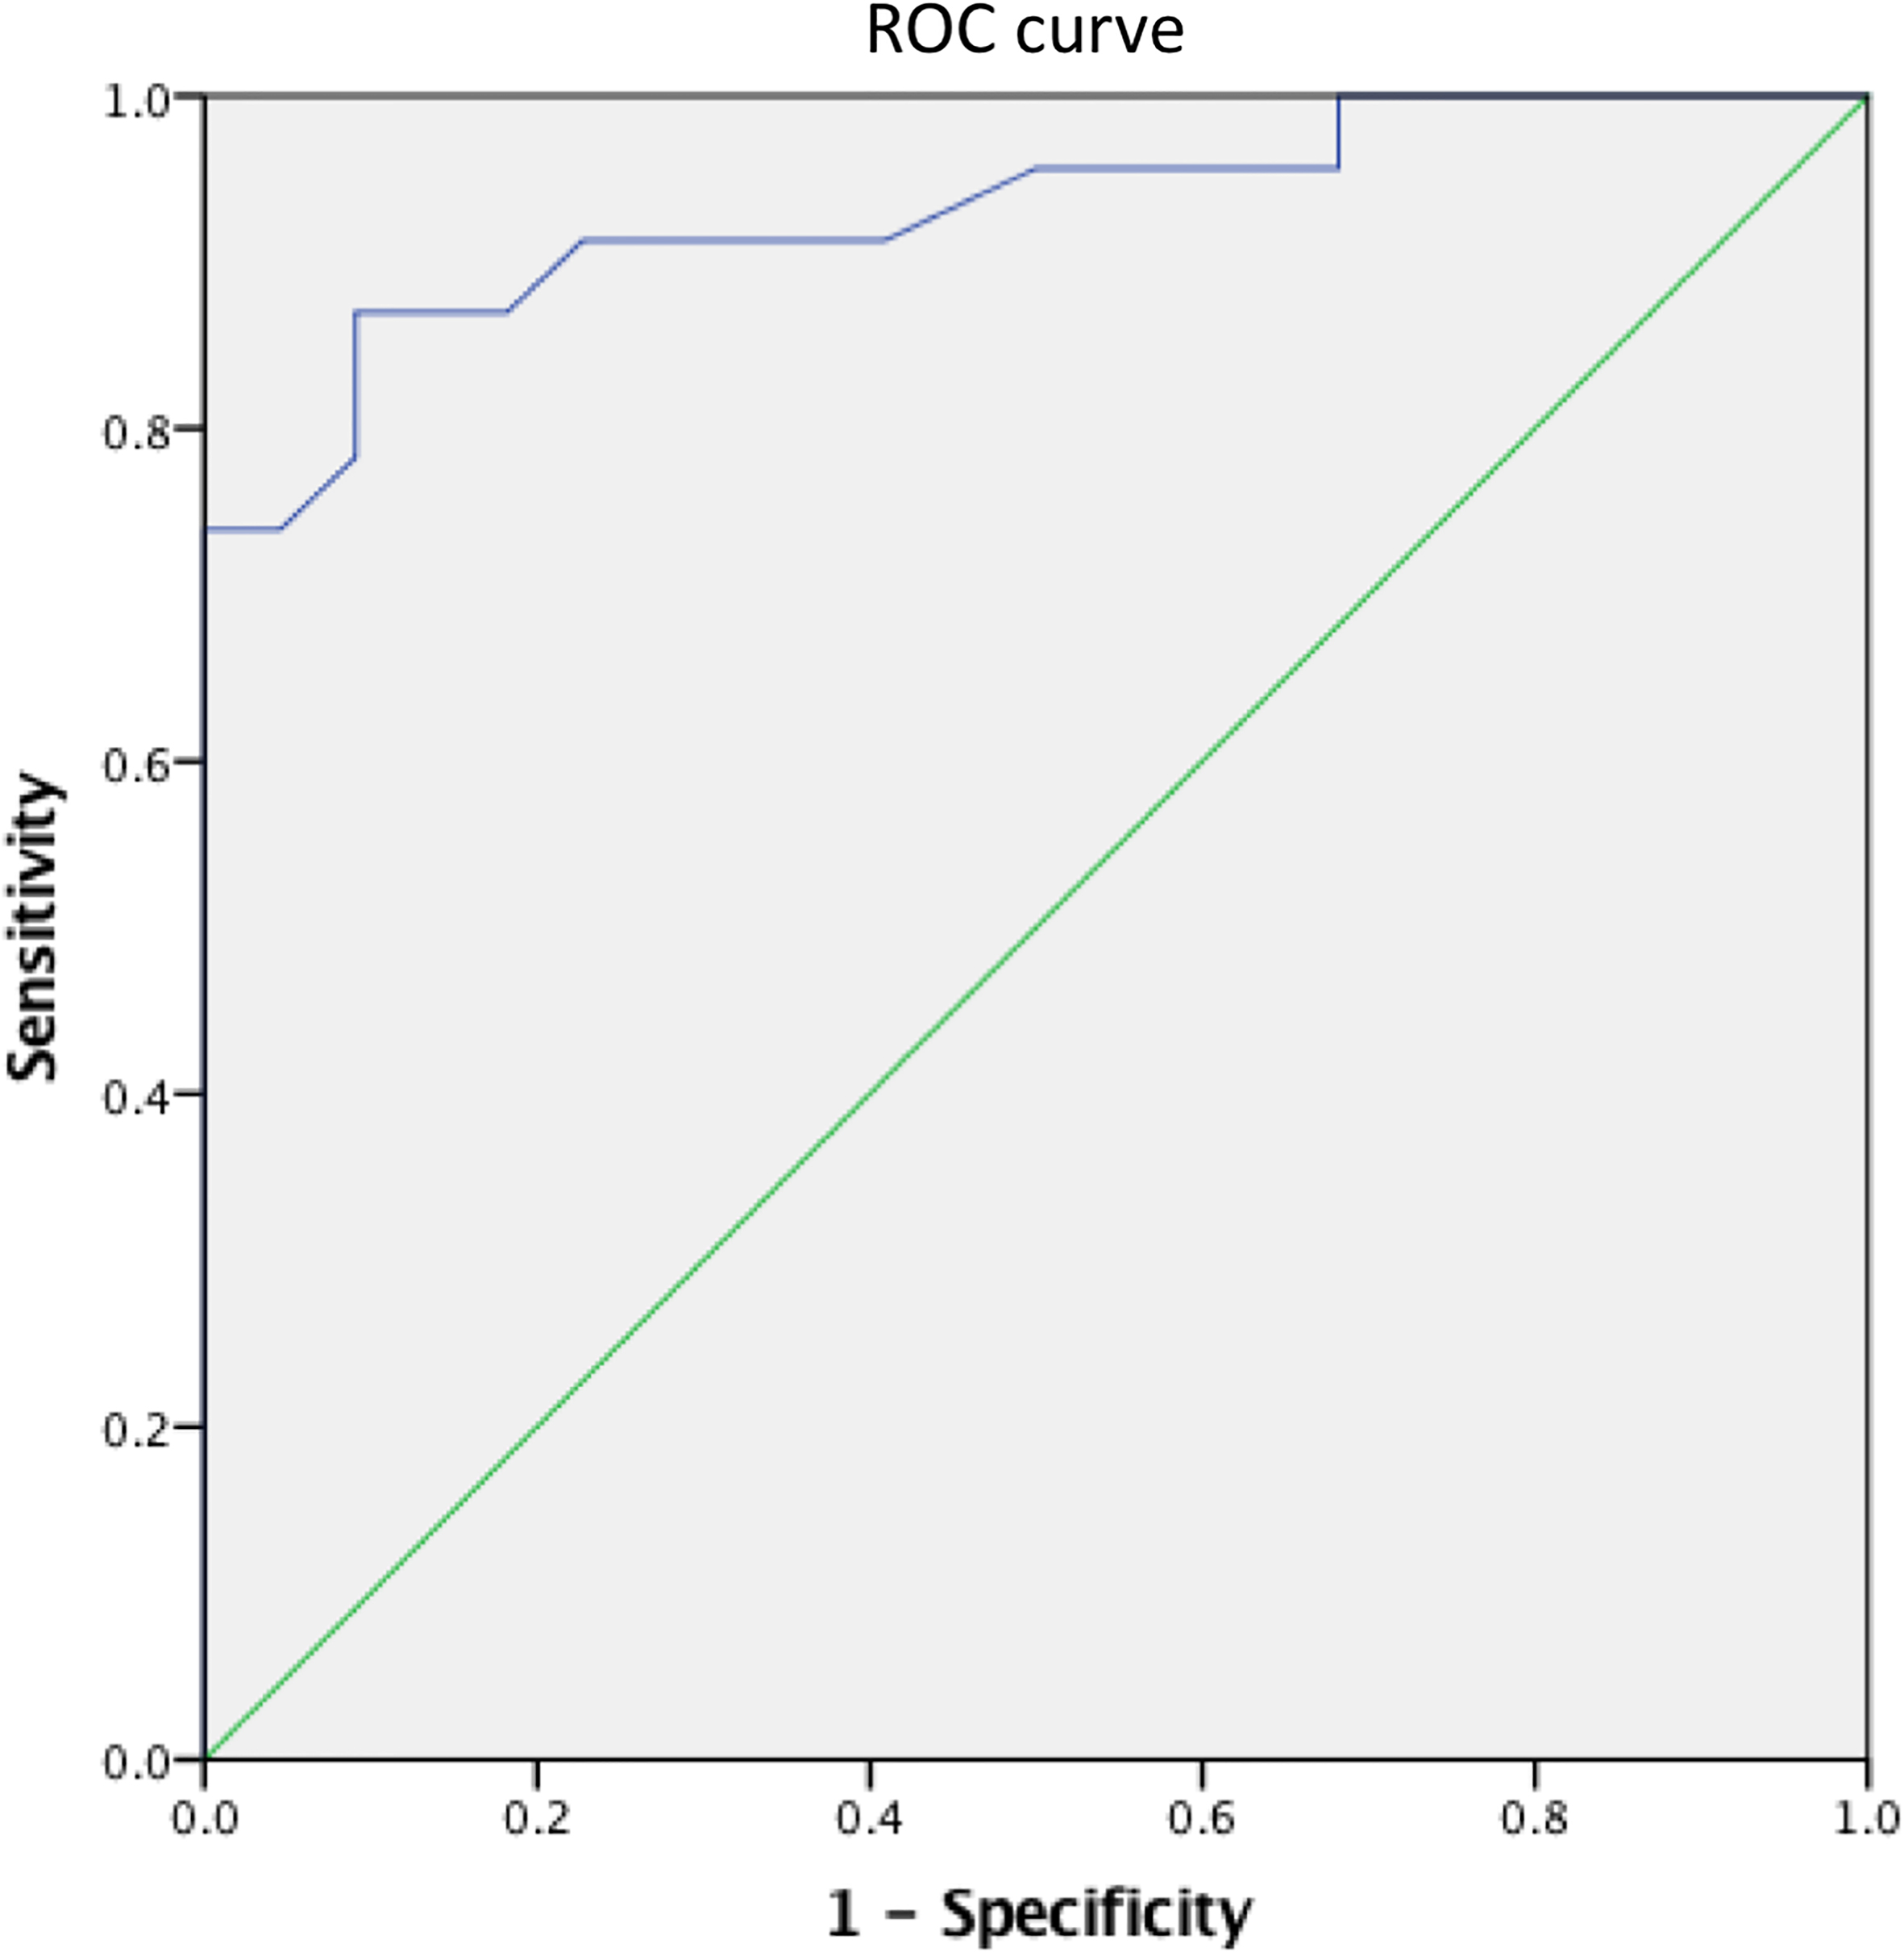
INTRODUCTION: Hypertrophic cardiomyopathy (HCM) is a hereditary disorder resulting in cardiac sarcomere protein gene mutations, which usually presents as otherwise unexplained left ventricular hypertrophy(1-4).Currently, myocardial extracellular volume (ECV) has been repeatedly histologically validated for quantification of diffuse myocardial fibrosis, and can be acquired noninvasively with T1 mapping before and after gadolinium administration(5-9).Diffusion weighted imaging (DWI) has been histologically validated in detecting regions of myocardial fibrosis in MI scar tissue(10) and diffuse myocardial fibrosis in the failing heart(11). Despite this sensitivity, its prognostic value for diffuse myocardial fibrosis and its relationship to the contractile function is still not investigated. We explore the prognostic value of the apparent diffusion coefficient (ADC) for detecting diffuse myocardial fibrosis and its relationship to dysfunction of global contractile function in hypertrophic cardiomyopathy (HCM). METHODS: A total of 45 HCM patients (25 male; 52 ±10 years) and 20 controls without previous cardiovascular diseases (9 male; 50 ± 6 years) underwent a 3.0-T cardiac magnetic resonance imaging (CMRI). The CMRI sequences included cine, T1 mapping, and DWI. The mean T1 value, ADC, extracellular volume (ECV) and three-dimensional (3D) tissue tracking for global strain (S) and strain rate (SR) were determined for each subject. RESULTS: The value of ECV was 23.6 ± 3.0% for control. ECV ≥ 29.6% and ECV < 29.6% groups were classified based on the ECV values (+2SD) of control subjects. ADC values in the ECV ≥ 29.6% group were significantly increased compared to the ECV < 29.6% group, (2.63 ± 0.23 μm2/ms vs. 2.18 ± 0.28 μm2/ms). ADC values were linearly associated with ECV values (R2 = 0.62) in HCM patients. Using the ECV values as the gold standard for the receiver operating characteristic (ROC), the area under the curve (AUC) was 0.93, 95% Confidence interval (CI) was 0.855 to 1.000 and the cut off value was 2.01 μm2/ms, sensitivity was 91.11% and specificity was 100%. The 3D LV GCS, GLS, GRS, GCSR, GLSR and GRSR in the ECV ≥ 29.6% group were significantly impaired compared to the ECV < 29.6% group. ADC values were linearly associated with 3D LV GCS, GLS, GCSR, GLSR and GRSR (R2 = 0.33, R2 = 0.30, R2 = 0.18, R2 = 0.14, R2 = 0.24, respectively). DISCUSSION: In this study, we demonstrated that ADC values were capable of not only detecting diffuse fibrosis, but also of characterizing the development of myocardial fibrosis in HCM patients. Moreover, we found that increased ADC values were linearly associated with the impaired deformation function in HCM patients. ADC values play a role in interpreting the underlying changes within the intracellular spaces of the myocardium. Recently, the potential of DWI to identify myocardial fibrosis in clinical configurations has been investigated. Pop et al and Nguyen et al demonstrated histological validation of the ADC value for detecting the replacement fibrosis in infarcted swine heart and showed that the ADC values were capable of detecting fibrosis defined by LGE with high sensitivity and specificity, respectively(10,12). Interestingly, the ADC values in the ECV < 29.6% group were higher than the cut off value derived from the ROC curve. The potential mechanisms that lead from sarcomere dysfunction to overt hypertrophy may be multi-factored and include impaired calcium cycling, interstitial fibrosis, myocardial oedema and microvascular dysfunction(13). All 3D LV global strain and strain rate values were significantly reduced in the ECV≥29.6% group, compared to the ECV<29.6% group, which suggests that diffuse myocardial fibrosis may result in the dysfunction of myocardial deformation. Previously, Swoboda et al(14) demonstrated that LV segment strain in an ECV abnormal group of HCM patients was significantly impaired. Additionally, Bogarapu et al(15) reported the utility of the 3D LV strain and strain rate derived from CMRI feature tracking in identifying myocardial fibrosis defined by LGE. In this study, 3D LV GCS, GLS, GCSR, GLSR and GRSR values were associated with increasing ADC values. Previously, we showed that increased values of the ADC were linearly associated with impaired end systolic circumferential global strain and end diastolic circumferential global strain rate in HTN patients(16). A possible mechanism linking the ADC value to decreased systolic strain in such patients is as follows: increased extracellular matrix deposition leads to increased LV stiffness, which decreased the end-diastolic muscle fibre length, and through the Frank-Starling mechanism, leads to decreased cardiac muscle contraction and LV systolic strain. CONCLUSION: Impairment of contractile function in HCM is predominantly associated with the contrast-free ADC value, which is a feasible alternative to ECV for the identification of myocardial fibrosis in patients with HCM.Acknowledgements
Supported by National Natural Science Foundation of China (Youth Program No.81401403), Shanghai Municipal Commission of Health and Family Planning excellent young talent program(No. 2017YQ031) and Shanghai Jiao Tong University Medical engineering cross fund (YG2014MS48).References
1. Gersh BJ, Maron BJ, Bonow RO, et al. 2011 ACCF/AHA guideline for the diagnosis and treatment of hypertrophic cardiomyopathy: a report of the American College of Cardiology Foundation/American Heart Association Task Force on Practice Guidelines. Circulation 2011;124(24):e783-831.
2. Elliott PM, Anastasakis A, Borger MA, et al. 2014 ESC Guidelines on diagnosis and management of hypertrophic cardiomyopathy: the Task Force for the Diagnosis and Management of Hypertrophic Cardiomyopathy of the European Society of Cardiology (ESC). European heart journal 2014;35(39):2733-2779.
3. Maron MS, Maron BJ, Harrigan C, et al. Hypertrophic cardiomyopathy phenotype revisited after 50 years with cardiovascular magnetic resonance. Journal of the American College of Cardiology 2009;54(3):220-228.
4. Urbano-Moral JA, Rowin EJ, Maron MS, Crean A, Pandian NG. Investigation of global and regional myocardial mechanics with 3-dimensional speckle tracking echocardiography and relations to hypertrophy and fibrosis in hypertrophic cardiomyopathy. Circ Cardiovasc Imaging 2014;7(1):11-19.
5. Zeng M, Qiao Y, Wen Z, et al. The Association between Diffuse Myocardial Fibrosis on Cardiac Magnetic Resonance T1 Mapping and Myocardial Dysfunction in Diabetic Rabbits. Scientific reports 2017;7:44937. 6. de Meester de Ravenstein C, Bouzin C, Lazam S, et al. Histological Validation of measurement of diffuse interstitial myocardial fibrosis by myocardial extravascular volume fraction from Modified Look-Locker imaging (MOLLI) T1 mapping at 3 T. Journal of cardiovascular magnetic resonance : official journal of the Society for Cardiovascular Magnetic Resonance 2015;17:48.
7. Miller CA, Naish JH, Bishop P, et al. Comprehensive validation of cardiovascular magnetic resonance techniques for the assessment of myocardial extracellular volume. Circulation Cardiovascular imaging 2013;6(3):373-383.
8. Flett AS, Hayward MP, Ashworth MT, et al. Equilibrium contrast cardiovascular magnetic resonance for the measurement of diffuse myocardial fibrosis: preliminary validation in humans. Circulation 2010;122(2):138-144.
9. White SK, Sado DM, Fontana M, et al. T1 mapping for myocardial extracellular volume measurement by CMR: bolus only versus primed infusion technique. JACC Cardiovascular imaging 2013;6(9):955-962.
10. Nguyen C, Fan Z, Xie Y, et al. In vivo contrast free chronic myocardial infarction characterization using diffusion-weighted cardiovascular magnetic resonance. Journal of cardiovascular magnetic resonance : official journal of the Society for Cardiovascular Magnetic Resonance 2014;16:68.
11. Abdullah OM, Drakos SG, Diakos NA, et al. Characterization of diffuse fibrosis in the failing human heart via diffusion tensor imaging and quantitative histological validation. NMR in biomedicine 2014;27(11):1378-1386.
12. Pop M, Ghugre NR, Ramanan V, et al. Quantification of fibrosis in infarcted swine hearts by ex vivo late gadolinium-enhancement and diffusion-weighted MRI methods. Physics in medicine and biology 2013;58(15):5009-5028.
13. Watkins H, Ashrafian H, McKenna WJ. The genetics of hypertrophic cardiomyopathy: Teare redux. Heart (British Cardiac Society) 2008;94(10):1264-1268.
14. Bogarapu S, Puchalski MD, Everitt MD, Williams RV, Weng HY, Menon SC. Novel Cardiac Magnetic Resonance Feature Tracking (CMR-FT) Analysis for Detection of Myocardial Fibrosis in Pediatric Hypertrophic Cardiomyopathy. Pediatric cardiology 2016;37(4):663-673.
15. Swoboda PP, McDiarmid AK, Erhayiem B, et al. Effect of cellular and extracellular pathology assessed by T1 mapping on regional contractile function in hypertrophic cardiomyopathy. Journal of cardiovascular magnetic resonance : official journal of the Society for Cardiovascular Magnetic Resonance 2017;19(1):16. 16. Wu LM, Wu R, Ou YR, et al. Fibrosis quantification in Hypertensive Heart Disease with LVH and Non-LVH: Findings from T1 mapping and Contrast-free Cardiac Diffusion-weighted imaging. Scientific reports 2017;7(1):559.
Figures