4872
3D Whole-Ventricle, Free-Breathing, Non-ECG, Myocardial T1 and ECV Mapping with CMR Multitasking1Biomedical Imaging Research Institute, Cedars-Sinai Medical Center, Los Angeles, CA, United States, 2Department of Bioengineering, UCLA, Los Angeles, CA, United States, 3Siemens Healthineers, Los Angeles, CA, United States
Synopsis
Myocardial fibrosis is a common pathological feature in cardiovascular diseases and can be detected with T1 and extracellular volume fraction (ECV) mapping. 3D methods are desirable to fully characterize the entire left ventricle. Typical T1 mapping methods require long scan times with respiratory navigators or repeated breath-holds which lead to patient discomfort or noncompliance. In this study, we perform 3D T1 and ECV mapping with CMR Multitasking to achieve whole-ventricle coverage in a free-breathing, non-ECG scan, producing comparable ECV to a conventional breath-hold, ECG-gated technique.
Introduction
Myocardial fibrosis is a common pathological feature of many cardiovascular diseases.1 T1 mapping provides quantitative information which can be used to characterize myocardial tissue and assess the presence or extent of fibrosis. Myocardial T1 mapping is commonly performed by collecting multiple ECG-triggered T1-weighted images at different times after inversion recovery (IR) or saturation recovery pulses, and then fitting the series of acquired images to a T1 recovery curve. Extracellular volume (ECV) can also be calculated by performing T1 mapping both before and after contrast agent administration. Both native T1 and ECV values have been shown to correlate with histological measures of myocardial fibrosis in various cardiomyopathies.2 Whole-ventricle coverage is desired to fully characterize diffuse diseases, making 3D mapping methods attractive.3 However, current 3D cardiac T1 mapping techniques utilize respiratory navigators (resulting in long unpredictable scan times) or multiple breath-holds (with potential patient noncompliance and misregistration). We developed 3D CMR Multitasking, a free-breathing, continuous acquisition technique using a low-rank tensor (LRT) imaging framework for whole-ventricle T1 mapping to eliminate these limitations.4Methods
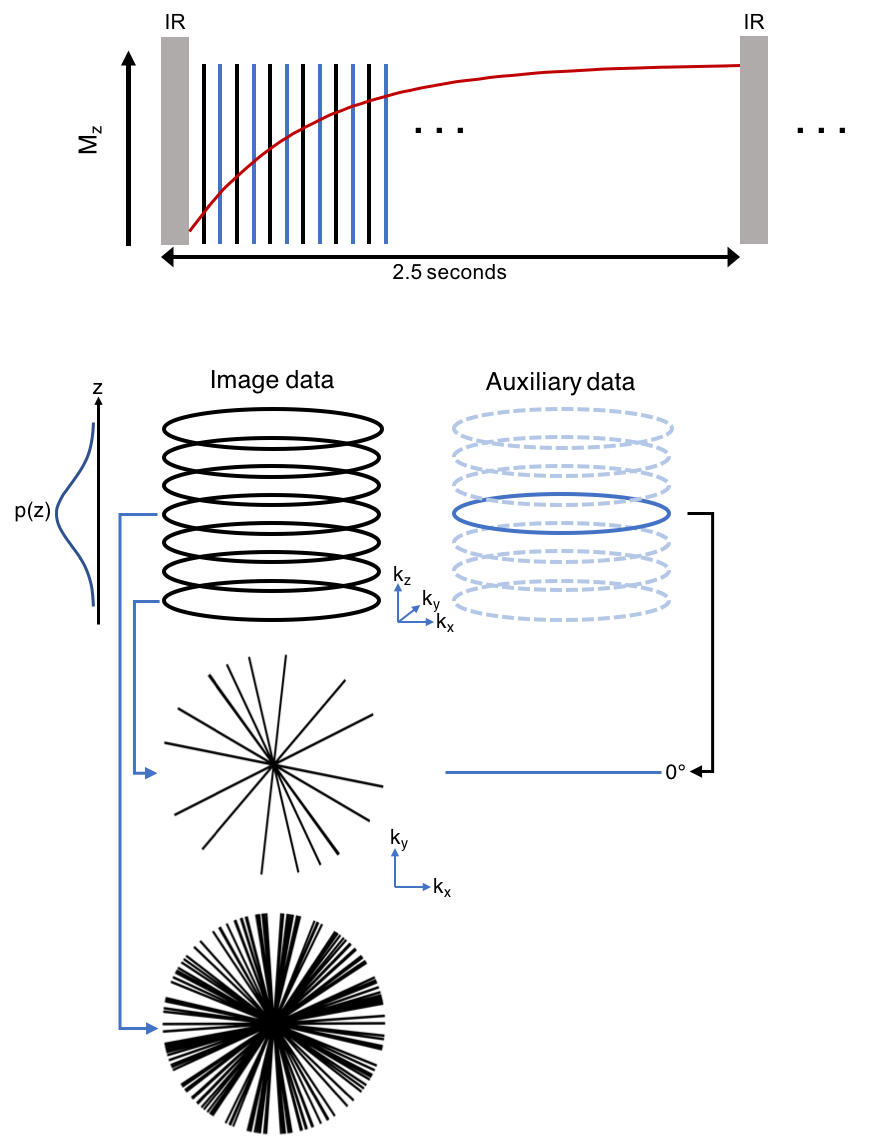
Sequence: Multitasking T1 mapping utilizes a prototype 3D stack-of-stars trajectory modified to collect high-temporal-resolution auxiliary data interleaved with high-spatial-resolution image data, shown in Figure 1. Odd-numbered readouts are image data incremented by the golden angle, with partition sampling determined by a variable density random Gaussian distribution; even-numbered readouts are auxiliary data 0° radial spokes at the center partition. The continuous acquisition applies IR pulses followed by small-angle FLASH readouts to sample the entire T1 recovery period until the next IR pulse with no gap. Sequence parameters include: fixed scan time of 9:52 min, 2.5 seconds between IRs, TE/TR = 2.8/6.1 ms, flip angle 5°, 20 partitions, slice thickness = 4.0 mm, in-plane resolution = 1.7x1.7 mm2.
Reconstruction: Real-time low-rank matrix images5, $$$I(x,y,z,t)$$$, with 3 spatial dimensions and one time dimension were first reconstructed from the image data and auxiliary data and used for cardiac and respiratory motion binning. The image data was binned into a 4-way tensor with dimensions indexing k-space location, cardiac motion ($$$t_c$$$), respiratory motion ($$$t_r$$$), and inversion time for T1 recovery ($$$t_{T1}$$$). Next, LRT reconstruction was performed using an explicit tensor subspace constraint estimated from the auxiliary data and a dictionary of Bloch-equation–derived T1 curves. The resulting six-dimensional image, $$$I(x,y,z,t_c,t_r,t_{T1})$$$, contains 3D images at 402 inversion times ($$$t_{T1}$$$ range: 3.6-2,476 ms) with 20 cardiac and 6 respiratory phases. Pixel-wise T1 maps were determined by fitting to the FLASH-IR signal model at an end-expiration respiratory phase and a diastolic cardiac phase.
Healthy human study: Eight healthy subjects (5 female, age 32 ± 9) were scanned at 3T (Siemens Verio) with 3D Multitasking T1 mapping as well as a 1.7x1.7x8.0 mm3 breath-hold, ECG-gated, 5(3)3 MOLLI.6 Both methods were acquired in a short axis orientation with Multitasking covering the whole left ventricle and MOLLI acquired in a single mid-ventricle slice. In a subset of four subjects, 3D Multitasking T1 mapping was also acquired 10-15 minutes after contrast injection. In this subset, ECV was calculated using native and post T1 maps and hematocrit measured from a blood sample taken immediately prior to imaging. Methods were compared by measuring T1 and ECV for an ROI in the septum.
Results and Discussion
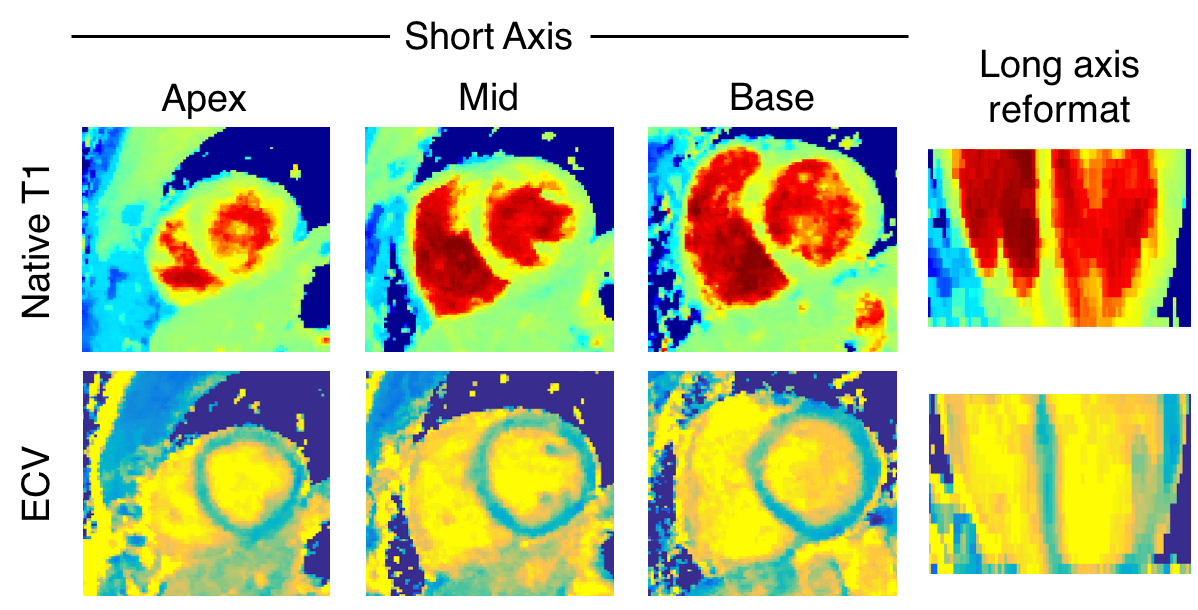
Figure 2 shows native T1 and ECV maps in a mid-ventricle short-axis slice and a long-axis reformat from the 3D Multitasking T1 mapping and a short-axis slice from MOLLI in one healthy subject. Native T1 and ECV values from 3D Multitasking T1 mapping and MOLLI are shown in Figure 3. T1 and ECV values from both methods are within normal ranges previously reported for 3T7 and are consistent throughout the ventricle. There is a 10.6% bias between 3D Multitasking and MOLLI native T1 values, which is potentially caused by the different steady-state behavior of blood flowing through the myocardium for different excitation schemes: a continuous-acquisition 3D volumetric FLASH excitation (Multitasking) versus less-frequent 2D slice-selective TrueFISP excitation (MOLLI). However, this bias was removed by the ECV calculation: no significant differences are seen in ECV between the two methods.
Conclusion
We have demonstrated a 3D free-breathing, non-ECG, T1 mapping technique to produce whole-ventricle T1 and ECV maps. The proposed 3D Multitasking T1 mapping method shows promise as a 3D T1 mapping technique with no dependence on ECG triggering or breath holds.Acknowledgements
No acknowledgement found.References
1. Schelbert Radiology 2016;278(3)
2. Schelbert Circ Cardiovasc Imaging 2017;10(6)
3. Messroghli JCMR 2017;19(1)
4. Shaw ISMRM 2017;0039
5. Christodoulou IEEE Trans Biomed Eng. 2013;60(11)
6. Xue MRM 2013;69(5)
7. Kawel-Boehm JCMR 2015;17(1)
Figures
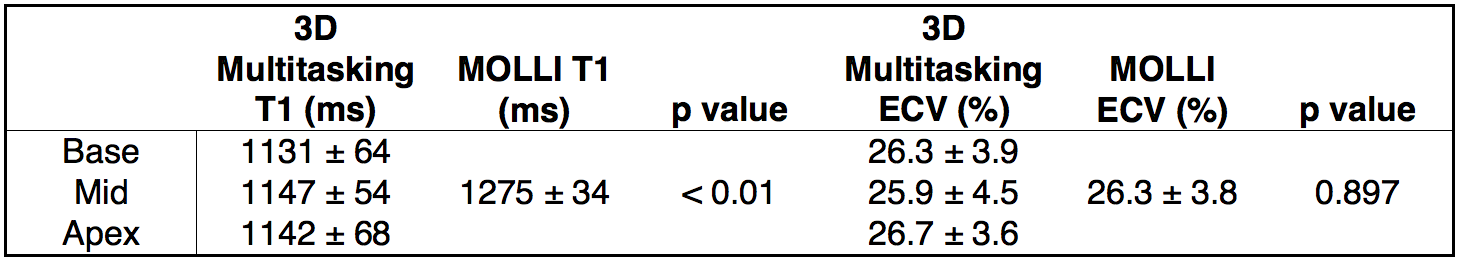
Native T1 and ECV values (mean ± standard deviation) measured in the septum and averaged over all subjects.