4866
MRI Texture Analysis based on 3D tumor measurement in the identification and prognosis of Gliomas with IDH1 Mutations1The First Affiliated Hospital of Dalian Medical University, Dalian, China, 2Life science, GE Healthcare, Shenyang, China
Synopsis
The 2016 World Health Organization Classification of Tumors of the Central NervousSystem(CNS) used molecular parameters in addition to histology to define manytumor entities, thus formulating a concept for how CNS tumor diagnosis should bestructured in the molecular era.IDH1 is an important molecular marker which has important clinical significance. The prognosis of gliomas with IDH1 mutation is better than those without one. In general,IDH1is detected by pathological biopsy. In this study, gliomas with or without IDH1 mutation was distinguished by using non-invasive MRI texture analysis based on 3D tumor measurement, and then the relationship between MRI texture parameters with survival rate was further assessed.
Objective
To evaluate the accuracy of texture analysis to differentiate gliomas with and without IDH1 mutation on T1WI, T2WI and contrasted T1WI MRI sequences based on entire region of gliomasand evaluate the correlation between the different texture features and the survival rate.Materials and Methods
38 patients were retrospectively selected, 17 IDH1 mutant (IDH1+; 10 males, 7 females, mean age=42.35±10.27 years) and 21 IDH wild-type (IDH1-; 10 males, 11 females, mean age=56.95±10.94 years). And all tumors were histo-pathologically confirmed. The preoperative MRI sequences and the survival rate were collected. The Region of interest(ROIs) containing the entire tumor and edema were manually delimited on all axial slices using Omni-Kinetics software.The histogram and all its parameters were obtained from the 3D ROI of T1WI, T2WI and contrasted T1WI MRI sequences. All parameters were compared between groups. The survival curve was made by Kaplan-Meier and compared by Log-Rank test. The correlation between texture parameters and Survival period was analyzed by Spearman analysis. That included progression free survival(PFS) and overall survival(OS).Receiver operating characteristic (ROC) curve was used to assess the statistical characteristics of the different texture features. P<0.05 was consider statistically significant.Results
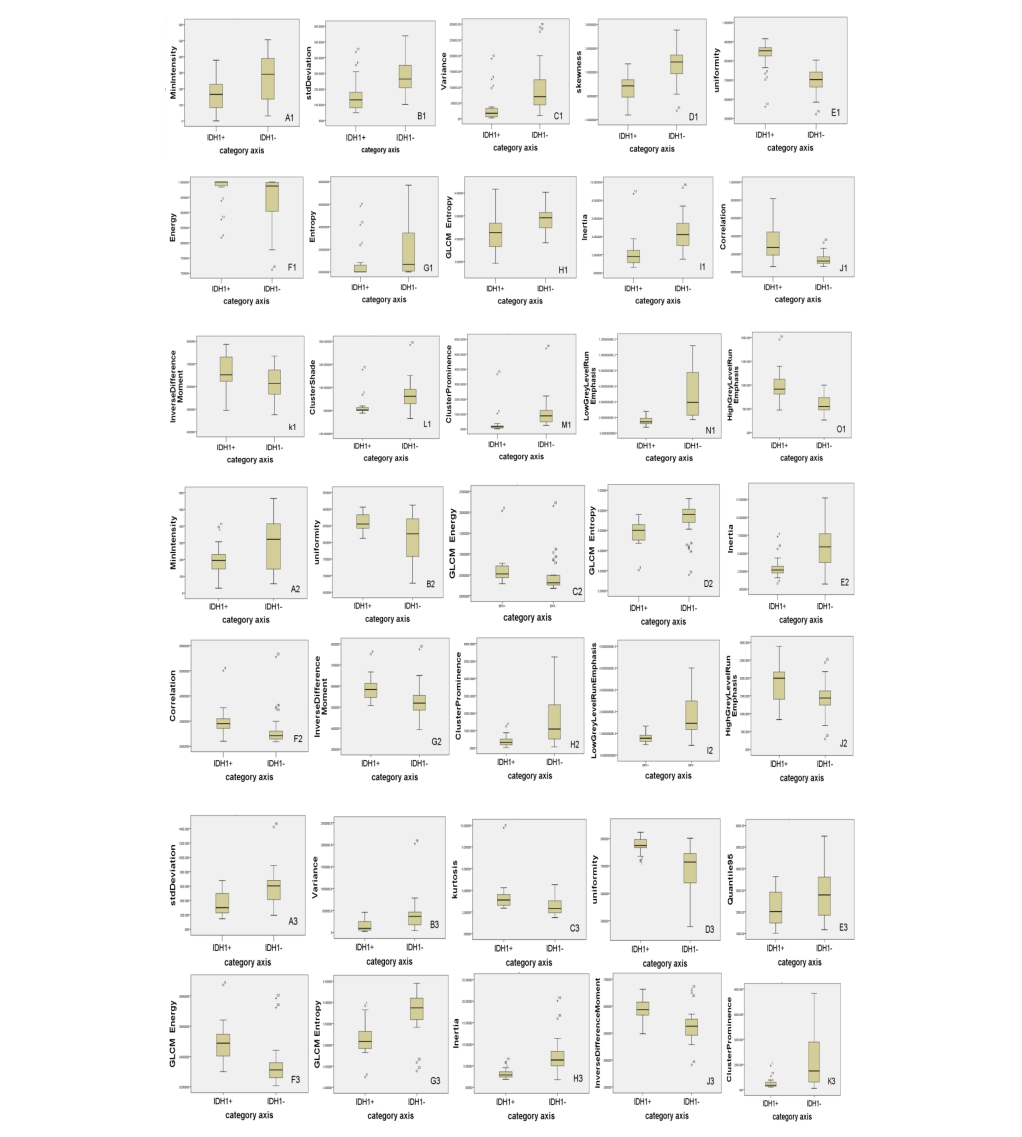
In contrasted T1WI parameters, minIntensity, standard deviation, variance, skewness, entropy, GLCM entropy, inertia, cluster shade, cluster prominence and low grey level run emphasis(LGLRE) were higher for IDH1+ than IDH1-, however uniformity, energy, correlation and high grey level run emphasis(HGLRE) were lower (all P<0.05).On the T1WI parameters, compared with IDH1+, the IDH1- recorded higher value of parameters: minIntensity, GLCM entropy, inertia, cluster prominence and LGLRE and lower values of parameters: uniformity, GLCM Energy, correlation, inverse difference moment and HGLRE(all P<0.05). On the T2WI parameters, standard deviation, variance, quantile 95, GLCM entropy, inertia and cluster prominence of IDH1- were higher. However, kurtosis, uniformity, GLCM energy, correlation, inverse difference moment lower than IDH1+(all P<0.05,Figure1-2). According to ROC analysis, LGLRE was recorded with the highest AUC values both on no-contrasted T1WI (AUC=0.922, cutoff value= 0.00095, specificity of 88.2% and sensitivity of 98.2%) and contrasted T1WI (AUC=0.913, cutoff value=0.003, specificity of 100% and sensitivity of 66.7%). In the T2WI Inertia (cutoff value=4.59, AUC=0.868) was consider the best parameter to differentiate the two groups with a sensitivity of 85.7% and specificity of 88.2%(Figure3). The median values of OS and PFS in group IDH1+(13.0±5.3 months,8.0±6.0 months) were higher than IDH1-(8.0±2.4 months,6.0±1.4 months), but there was no statistical difference (P>0.05). In contrasted T1WI, skewness, cluster shade, cluster prominence have negative correlation with PFS(r=-0.428, -0.454, -0.344, P=0.013, 0.008,0.050) and OS (r=-0.501, -0.476, -0.381, P=0.003, 0.004, 0.026). In T2WI, skewness and cluster shade have also correlation with PFS (r=-0.410, -0.473, P=0.018, 0.005) (Figure4-5).Discussion
IDH1 mutations mainly occur in WHO II and III gliomas, but the mutation rate is low in glioblastoma[1]. In this study, the group IDH1-mutant included: 9 WHO II and 8 WHO III glioma;14 glioblastoma and 7 WHO III glioma were IDH1-. Gliomas of IDH1- have a higher level, of cell polymorphism and nuclear atypia, increased cell division activity and microvascular hyperplasia with necrosis, which is label of high invasiveness. For all three sequences, GLCM Entropy, Inertia and Cluster Prominence was higher in IDH1-, indicating that the more heterogenicity of IDH1-than IDH+. And the lower uniformity of IDH1- is due to multiple cystic,necrotic areas and the uneven signals in IDH1-. Studies have shown that among various types of gliomas, the prognosis of IDH1-mutant gliomas was better, and the survival time and progression free survival are both prolonged[2-4]. In this study, the median values of OS and PFS in IDH1+ were higher than IDH1-. IDH1+ showed better prognosis, but there was no statistical difference. It may be due to the smaller sample size and shorter follow-up time of some patients. And a lot of representative tumor heterogeneity parameters has good correlation with OS and PFS, such as skewness and cluster shade. These results indicate that texture analysis is helpful in predicting the survival of patients with gliomas.Conclusion
MRI texture analysis may be a new noninvasive method for the identification of IDH1 mutation which has a significant correlation with the survival period. This provides an objective basis to use non-invasive technology to predict the survival rate or period.Acknowledgements
No acknowledgement found.References
[1]Liu XY, Gerges N, Korshunov A, Sabha N, Khuong-Quang DA, Fontebasso AM et al. Frequent ATRX mutations and loss of expression in adult diffuse astrocytic tumors carrying IDH1/IDH2 and TP53 mutations. Acta neuropathologica 2012; 124: 615-625.
[2]Qi ST, Yu L, Lu YT, Ou YH, Li ZY, Wu LX etal. IDH mutations occur frequently in Chinese glioma patients and predict longer survival but not response to concomitant chemoradiotherapy in anaplastic gliomas. Oncology reports 2011; 26: 1479-1485.
[3]Sabha N, Knobbe CB, Maganti M, Al Omar S, Bernstein M, CairnsR et al. Analysis of IDH mutation, 1p/19q deletion, and PTEN lossdelineates prognosis in clinical low-grade diffuse gliomas. Neuro-oncology 2014; 16: 914-923.
[4]Gleize V, Alentorn A, Connen de Kerillis L, Labussiere M, Nadaradjane AA, Mundwiller E et al. CIC inactivating mutations identify aggressive subset of 1p19q codeleted gliomas. Annals of neurology 2015; 78: 355-374.
Figures

e1-e6: male, 60 years old, anaplastic astrocytoma,WHOIII, without IDH1 mutation. e1-e3 are the contrasted T1WI, T2WI, T1WI signal images. e4-e6 are the contrasted T1WI, T2WI, T1WI signal histogram.All three sequences histogram of IDH1- group were rightward, the voxel value distribution in the high value area, and the curve flat.
f1-f6: male,31 years old,Oligodendrocytes,WHOII, with IDH1 mutation. f1-f3 are the contrasted T1WI, T2WI, T1WI signal images. f4-f6 are the contrasted T1WI, T2WI, T1WI signal histogram. All three sequences histogram of IDH1+ group histogram were leftward, the voxel value distribution in the low value area, and high tip curve.

ROC curve of the contrasted T1WI, T2WI, T1WI signal respectively.
a1:In the contrasted T1WI texture parameters, LGLRE was most optimal parameters(cutoff value=0.003, AUC=0.913) , with the sensitivity of 66.7% and specificity of 100%.
a2:In the T1WI parameter, LGLRE was most optimal parameters(cutoff value=0.00095,AUC=0.922) with 98.2% and specificity of 88.2%.
a3:In the T2WI parameter, the Inertia(cutoff value=4.59, AUC=0.868) was consider as the best parameters with the sensitivity of 85.7% and specificity of 88.2%
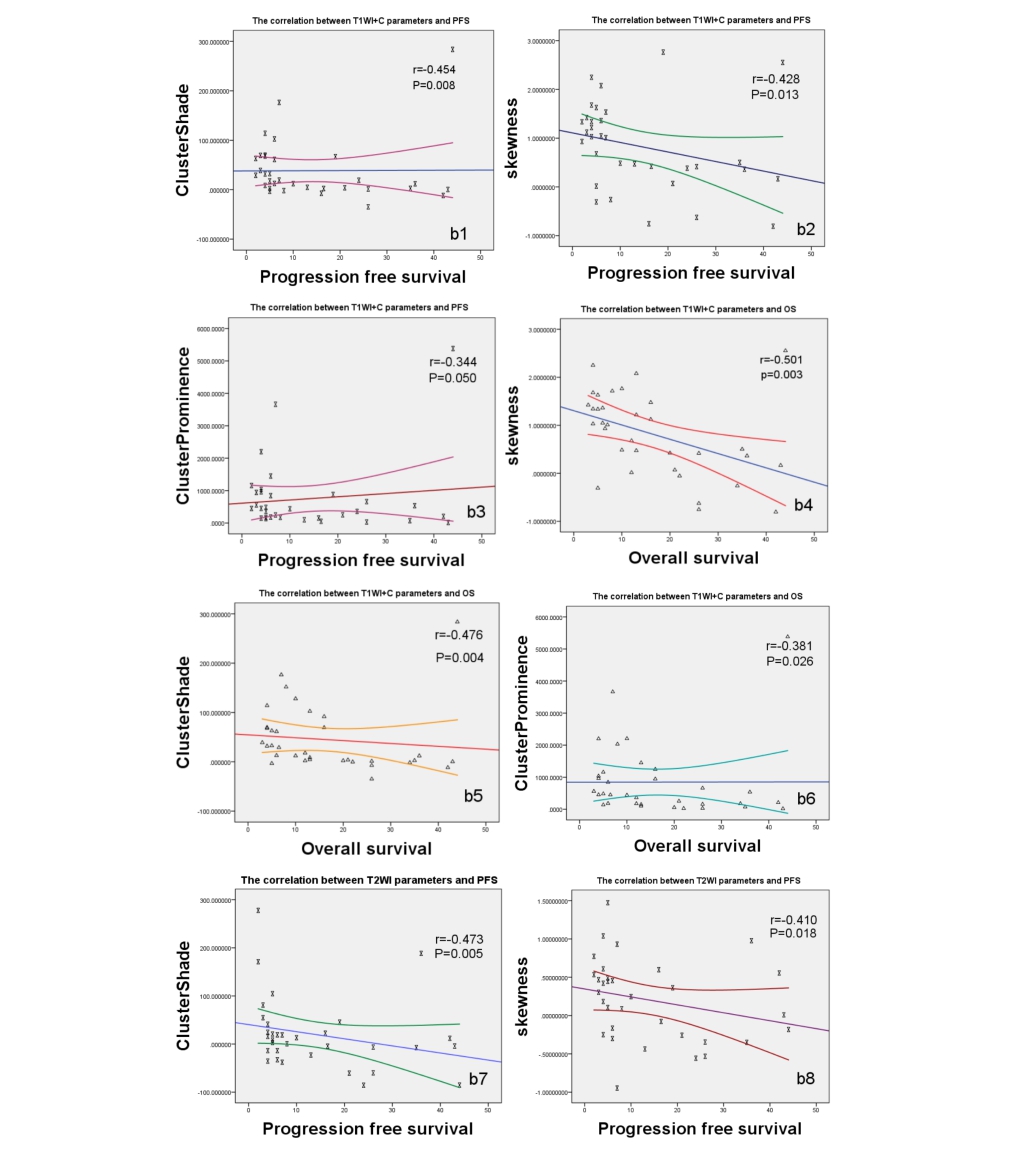
scatter diagram of correlation between parameters and PFS,OS.
In contrasted T1WI, cluster shade, skewness, cluster prominence have negative correlation with PFS(r=-0.454(b1),-0.428 (b2), -0.344(b3), P=0.008,0.013, 0.050) and OS (r= -0.476(b5),-0.501(b4), -0.381(b6), P=0.004, 0.003, 0.026).
In T2WI,cluster shade and skewness have also correlation with PFS (r= -0.473(b7),-0.410(b8), P= 0.005,0.018)
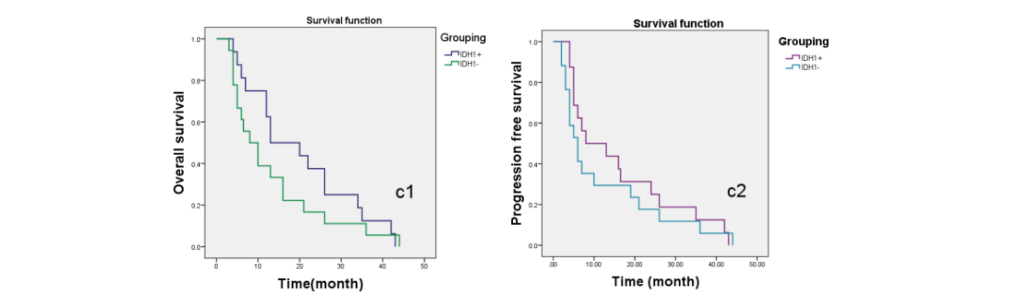
overall survival curve and progression free survival curve.
The median values of OS and PFS in group IDH1+(13.0±5.3 months , 8.0±6.0 months) were higher than IDH1-(8.0±2.4 months,6.0±1.4 months)