4862
Predicting efficacy of a novel immune stimulator in an animal model of glioblastoma with ferumoxytol cell tracking MRI1Radiology, University of Calgary, Calgary, AB, Canada, 2Clinical Neuroscience, University of Calgary, Calgary, AB, Canada
Synopsis
Treatment of malignant gliomas with immunotherapy has become an important area of exploration. However, one of the major problems in glioma immunotherapy is the lack of sensitive imaging techniques to differentiate tumor progression (detrimental) from pseudoprogression (beneficial, caused by stimulated macrophages). We hypothesized that tracking macrophages is a sensitive way to detect immunotherapy treatment response. We used a novel drug that stimulates the innate immune system and showed that ferumoxytol based cell tracking MRI is a sensitive way to detect monocyte infiltration and predict tumor growth. Ferumoxytol is used clinically, so this method has high potential for clinical translation
Purpose
We hypothesized that monocyte tracking using ultrasmall iron oxide nanoparticles (USPIO) can be a very sensitive method to predict therapeutic response in glioblastoma multiforme (GBM), an aggressive brain cancer with a terrible prognosis. The poor prognosis is thought to be caused by stem-like cells called brain tumor initiating cells (BTIC) (1), which are chemoradioresistant (2). It has been shown that monocytes can be stimulated to suppress BTICs (3). To test new immunotherapy drugs, we need an imaging method for detecting migration of cells to the tumor. Using T2* mapping in combination with a USPIO, we show that this method can be used to detect immune cell infiltration into the tumor, which could be predictive of future tumor growth.Methods
MRI was performed with a 9.4T MRI (Buker) and a helium cooled cryocoil. An anatomical FLASH (TR/TE/α = 1000ms/6.5ms/60o, voxel size = 0.075 x 0.075 x 0.25 mm) and a 3D multiecho gradient echo (MEGE) sequence (TR/TE/α = 100ms/3.1, 7.1, 11.1, 15.1, 19.1 ms/15o, voxel size = 0.100mm isotropic) were used. We implanted 25,000 mouse BTICs into the right striatum of 8-10 week old syngeneic C57BL/6 mice (5). Drug (n=8) or vehicle (n=5) treatment was started 14 days after tumor implantation. After two weeks of treatment, MRI was undertaken. Then ferumoxytol (30mg/kg, 100 uL) was injected in the tail vein and MRI was repeated 24 hours post injection. The animals continued to be treated, and the anatomical FLASH sequence was repeated 7 days later.Results
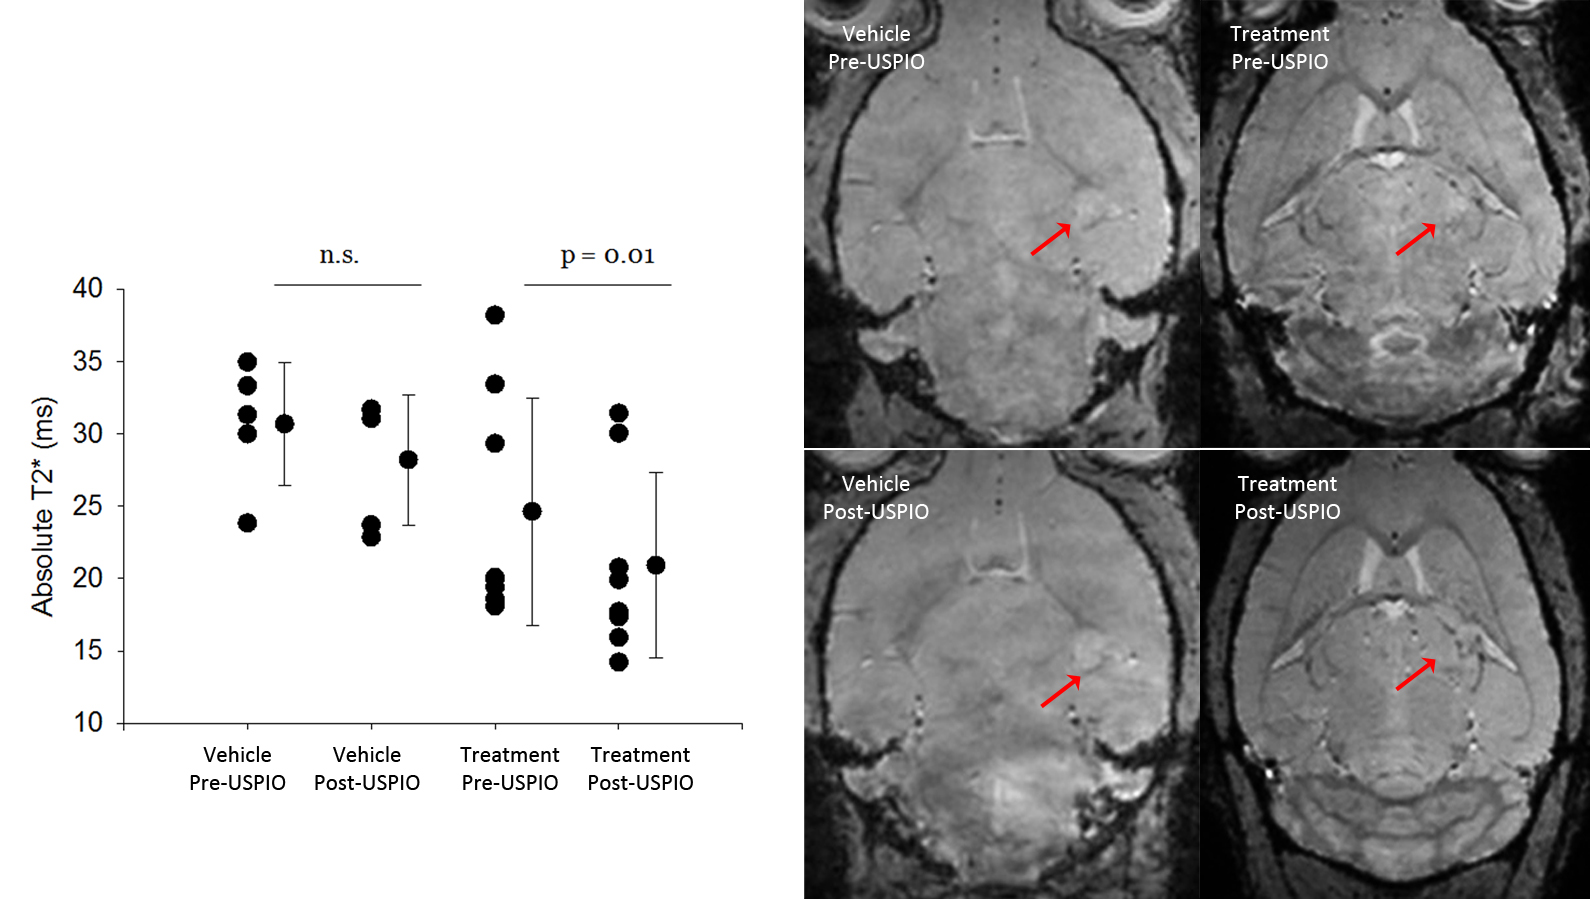
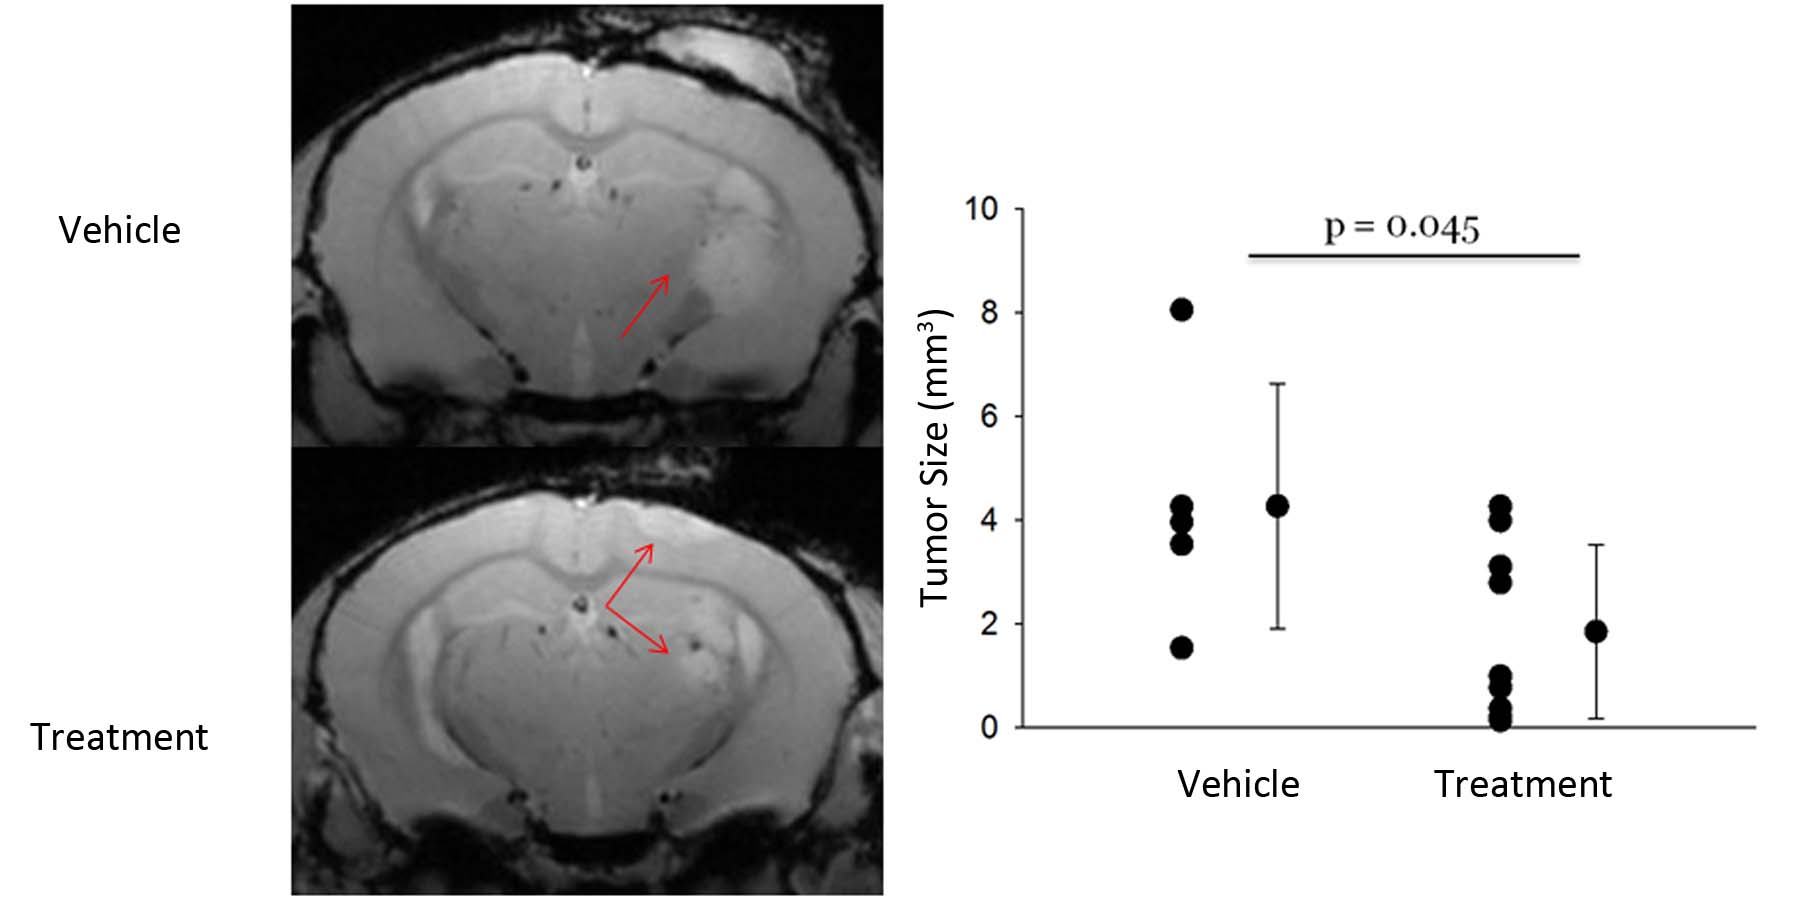
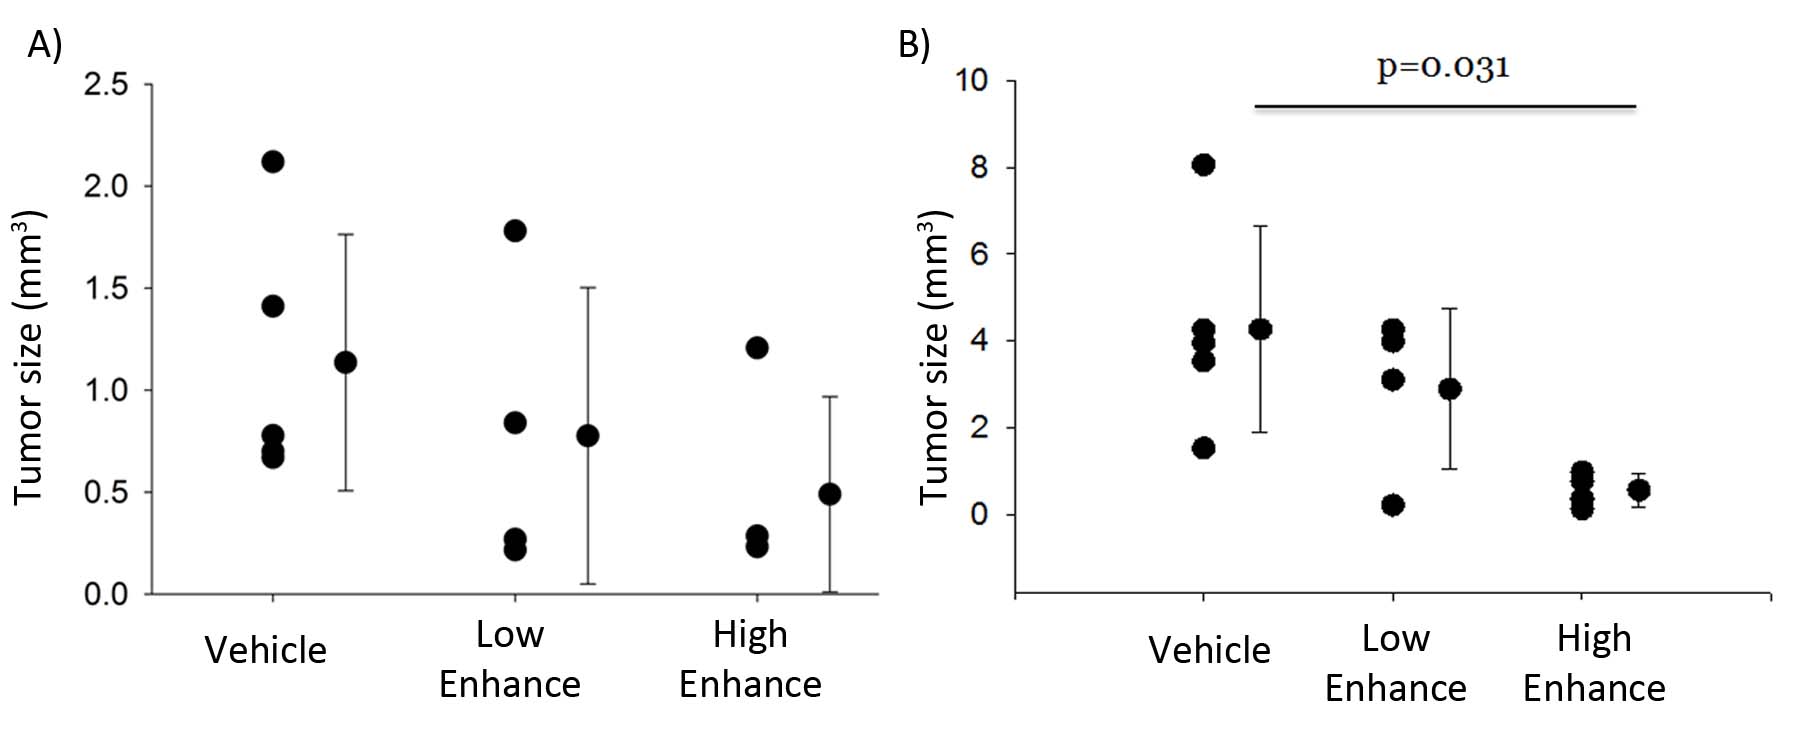
In the drug treated animals, there was a greater darkening on the T2*w image and a significant reduction in T2* within the tumor of the treated animals (p=0.01), but not vehicle controls (p>0.05, Figure 1). There were no significant difference in tumor size between the drug and vehicle treated animals after 14 days treatment. After 21 days of treatment, the drug significantly reduced tumor growth (p<0.05; Figure 2). We then divided the animals in the drug group based on whether they showed large or small T2* changes after 14 days of treatment and examined their tumor size a week later. Compared to vehicles, there were no significant differences in tumor size in animals with low T2* changes (low monocyte infiltration). However, animals with large changes on T2* (and more monocyte infiltration) has significantly smaller tumor compared to vehicles (p<0.05, ANOVA with post-hoc tukey’s test).Discussion
Treatment with the monocyte stimulating drug significantly reduced the tumor size, suggesting that the drug provide excellent tumor control. The significant decrease in T2* in the tumor after ferumoxytol injection is consistent with our pilot findings showing stimulated monocytes are engulfing the ferumoxytol and infiltrating into the tumor (4). By labeling monocytes using ferumoxytol enhanced MRI, we could detect the efficacy of the treatment and predict which animals were likely going to respond to therapy. Ferumoxytol is a safe agent that has been extensively used in the patient population and is clinically approved to treat anemia.Conclusion
We used a drug that stimulates innate immunity to reduce tumor growth in vivo and showed that USPIO based cell tracking could be used to detect infiltration of stimulated monocytes to brain tumors and predict treatment response. This is the first time of which we are aware, where the result of USPIO imaging after immunotherapy was predictive of the tumor response to the therapy. This MRI monocyte tracking method shows excellent promise as a technique for translation to human studies to detect the efficacy of drugs that stimulate the innate immune system to control brain cancer.Acknowledgements
This study was funded by Alberta Innovates Health Solutions - Alberta Cancer Foundation Collaborative Research Initiative Opportunities grant, Brain Canada Platform grant and Alberta Innovates Health Solutions MD-PhD studentship.References
1. Singh, S.K., et al., Identification of human brain tumour initiating cells. Nature, 2004. 432(7015): p. 396-401.
2. Hardee, M.E., et al., Resistance of glioblastoma-initiating cells to radiation mediated by the tumor microenvironment can be abolished by inhibiting transforming growth factor-beta. Cancer Res, 2012. 72(16): p. 4119-29.
3. Sarkar, S., et al., Therapeutic activation of macrophages and microglia to suppress brain tumor-initiating cells. Nat Neurosci, 2013. 17(1): p. 46-55.
4. Yang, R., et al., MRI monitoring of monocytes to detect immune stimulating treatment response in brain tumor. Neuro Oncol, 2016.
Figures