4860
Advanced MRI and MRS precursors to progression in Grade II and III Glioma1Radiology and Biomedical Imaging, University of California San Francisco, San Francisco, CA, United States, 2Radiation Oncology, University of California San Francisco, San Francisco, CA, United States, 3Neurological Surgery, University of California San Francisco, San Francisco, CA, United States
Synopsis
The goal of this project is to identify serial advanced imaging markers that reveal tumor progression in grade II and III gliomas prior to the Response Assessment in Neuro-Oncology Criteria (RANO) criteria for progression. Serial advanced imaging demonstrated significant changes associated with tumor activity prior to the clinical determination of tumor progression. In diffusion imaging, there were declines in nFA, and an increase in nADC in the contrast enhancing lesions. In spectroscopic imaging, there were declines in nNAA and nCRE, and increases in nCho, nLIP and nLAC.
Introduction
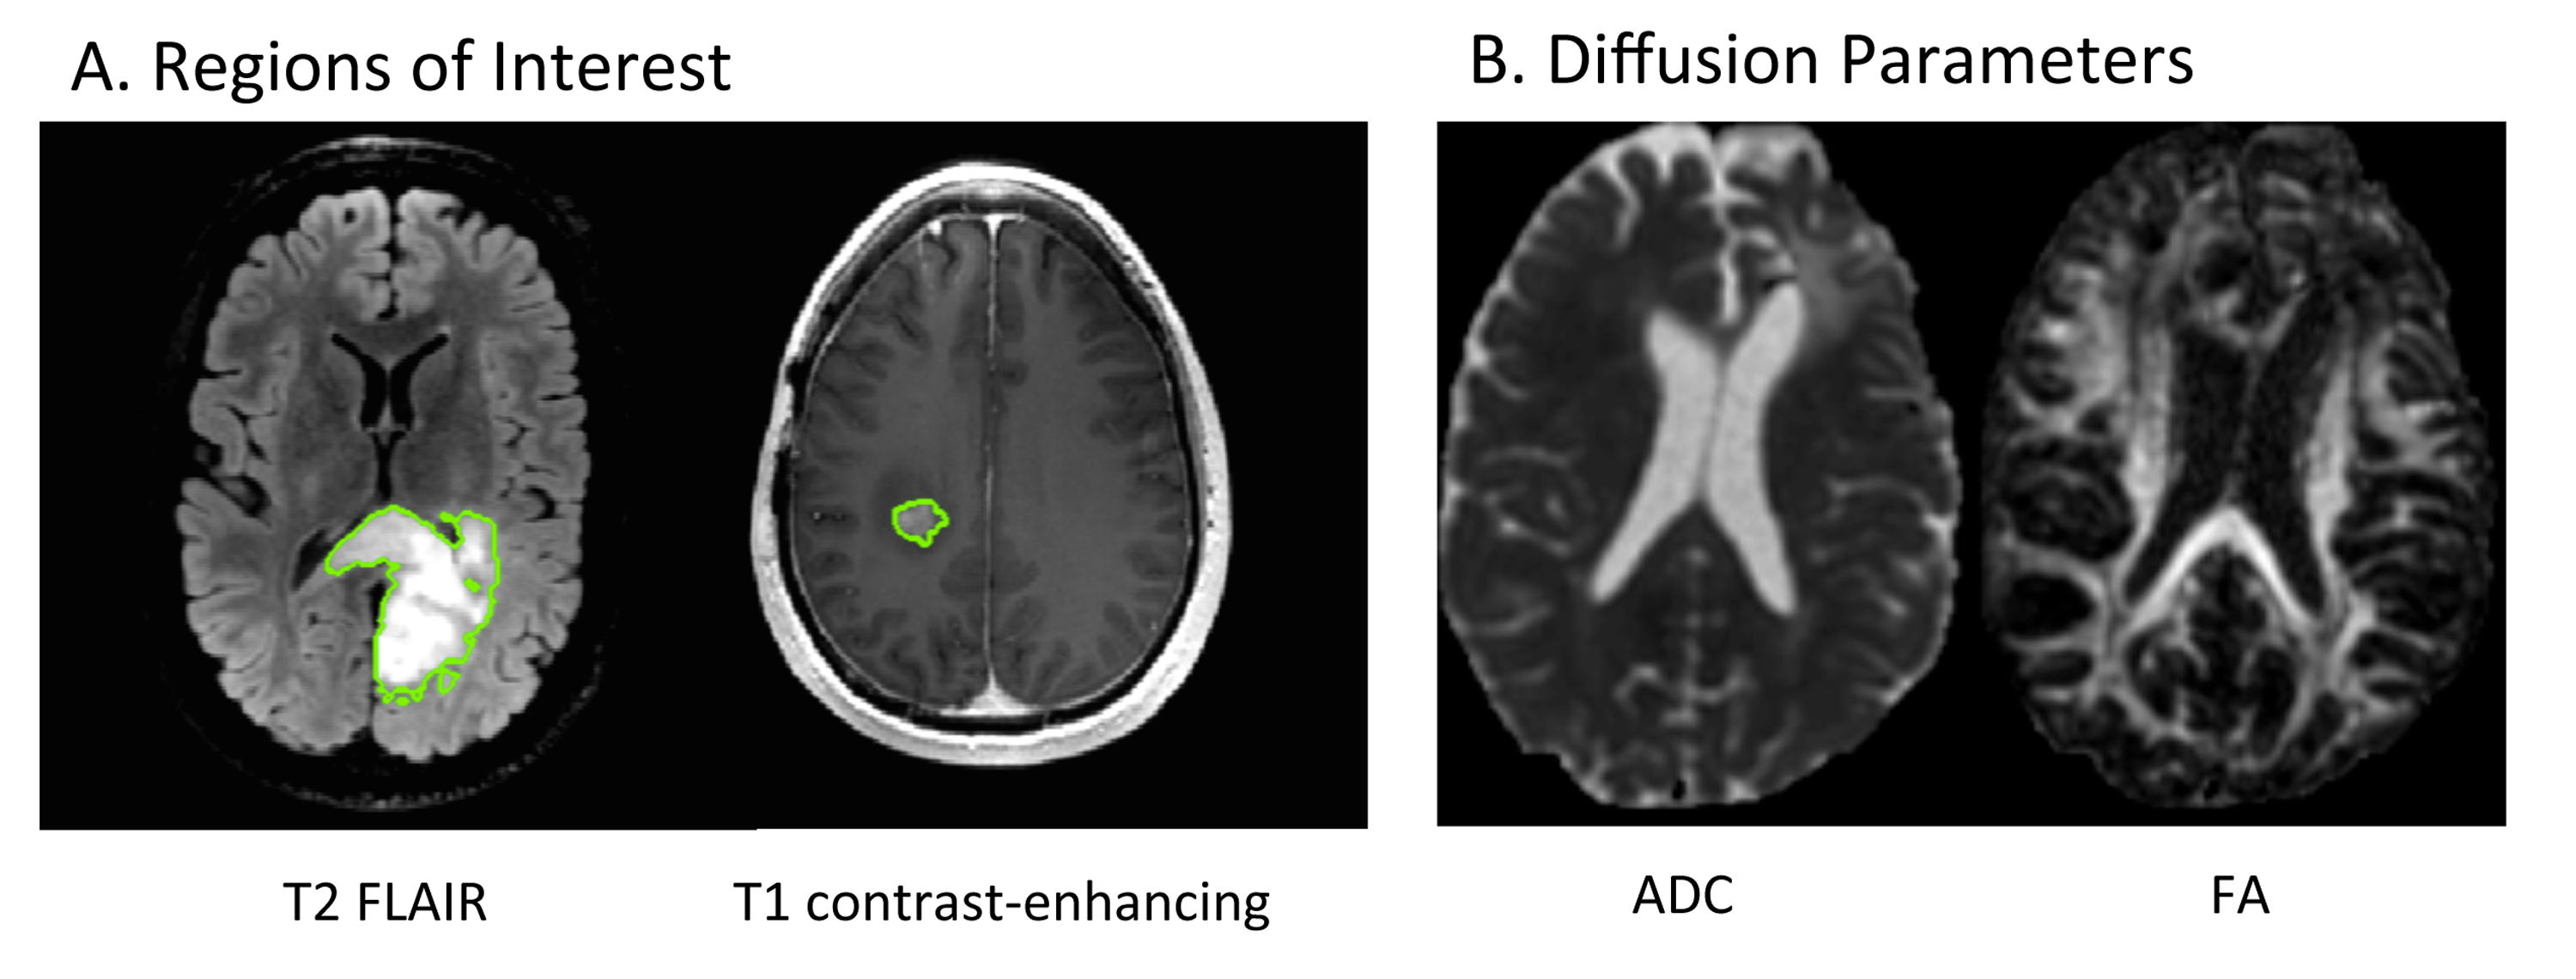
After initial diagnosis and treatment, patients with lower grade (II and III) gliomas typically have several years of tumor stability with residual T2 FLAIR abnormalities on standard clinical imaging. Subtle progressive changes in residual T2 FLAIR abnormalities can be caused by gliosis, edema, or progressive tumor. Early treatment of tumor progression is critical to overall survival. The goal of this project is to identify serial advanced imaging markers that reveal tumor progression prior to the onset of new T1 contrast-enhancement or the expansion of FLAIR abnormality that reaches the Response Assessment in Neuro-Oncology Criteria (RANO)1 criteria for progression.Methods
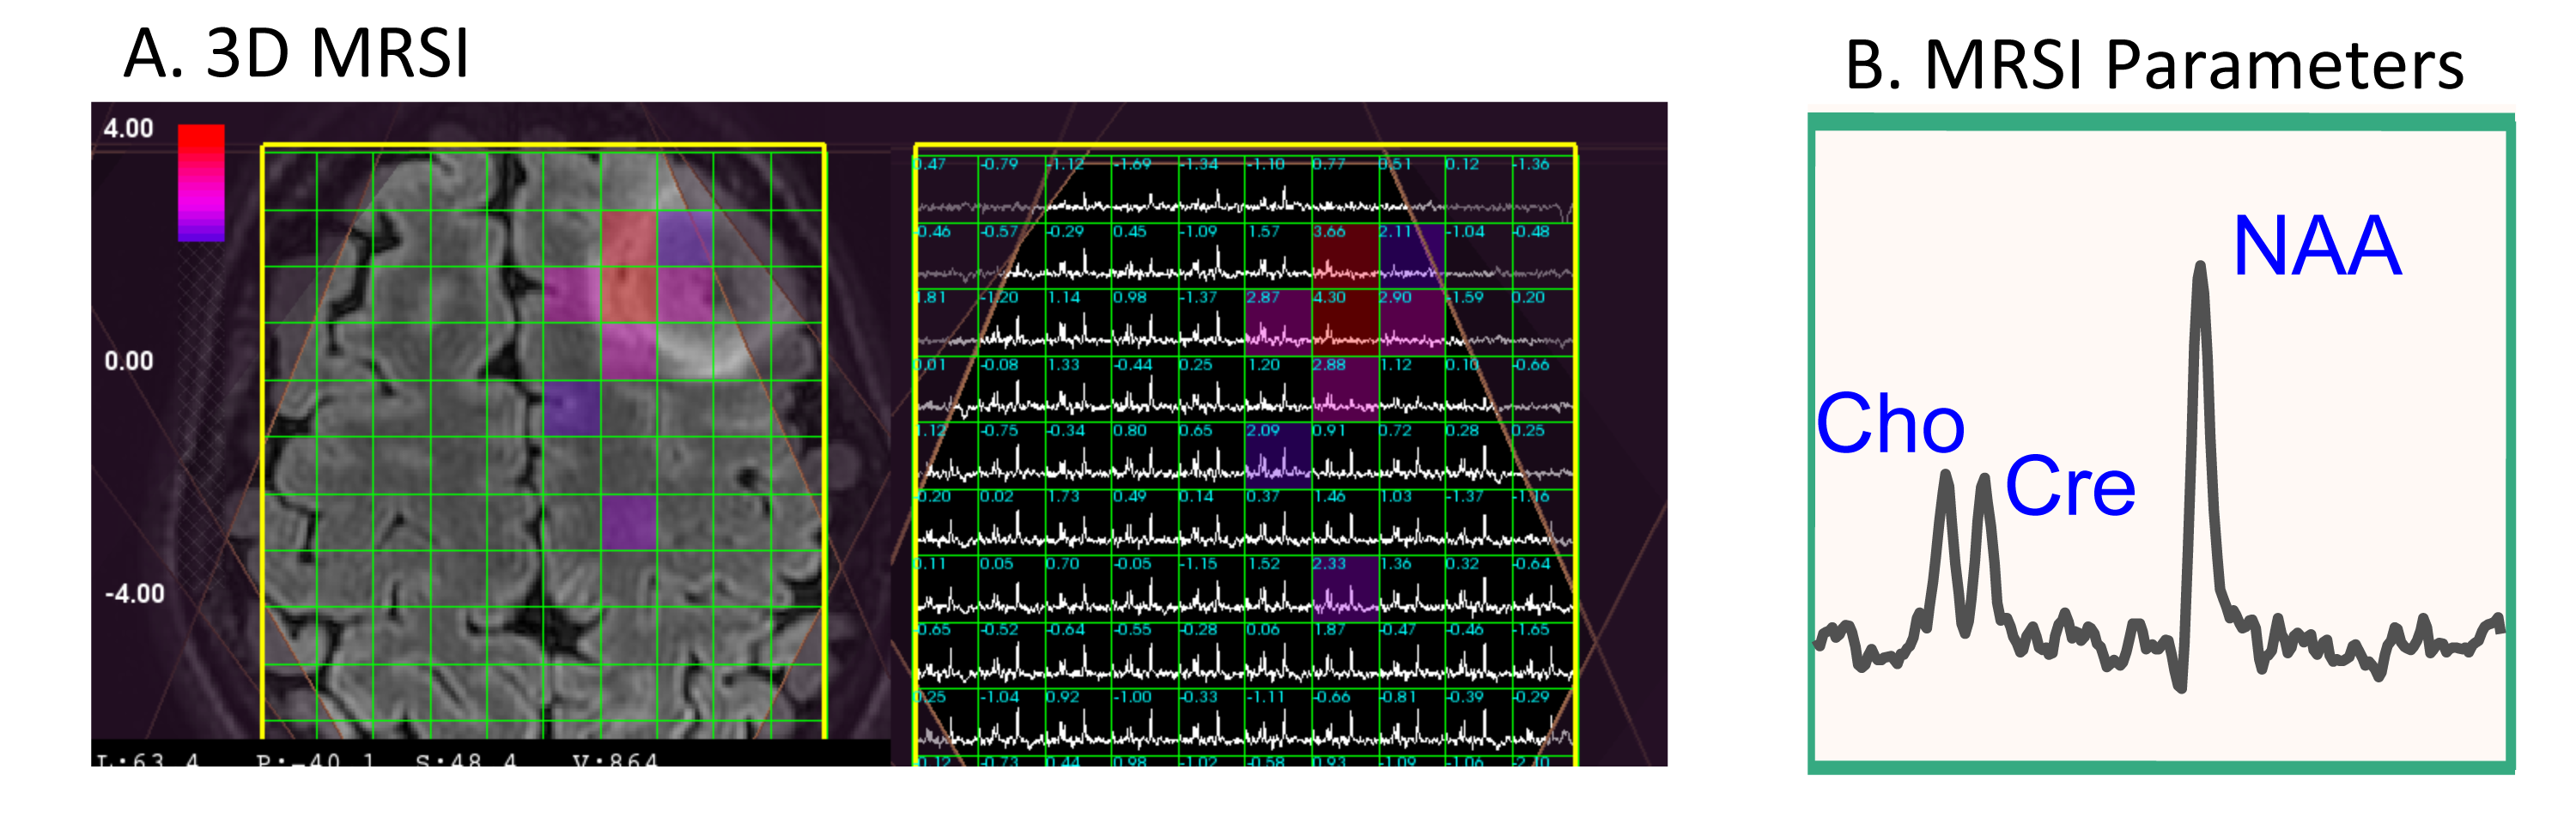
Twenty-three lower grade glioma patients were identified with tumor progression during their participation in research with serial advanced MR imaging and spectroscopy at standard of care timepoints (2-6 months). Progression was determined by the patient’s neuro-oncologist, in consultation with a radiologist, and if necessary, the other members of the UCSF Brain Tumor Board. The average number of scans acquired prior to progression was 4 (range = 12-3). WHO 2016 diagnosis, grade, IDH mutation status, and co-deletion of 1p19q were determined by standard pathology and immunohistochemistry and FISH assessment of tumor tissue samples. Table 1 describes the patient population. Patients underwent a 3T GE MR exam with an 8 or 32 channel head coil. The MRI examination included T1-weighted IRSPGR, T2-weighted 3D FSE and/or XETA T2 FLAIR, and 6 directional axial Diffusion Weighted Imaging with b=1000s/mm2. Fifteen patients had Dynamic Contrast-Enhanced perfusion imaging (DCE), and 11 patients had Lactate-edited 3D MR spectroscopy (MRSI) with PRESS volume localization.
The results of each MR scan were analyzed using the methodology previously developed and published in our laboratory. Regions of Interest (ROIs) were defined for the entire T2 FLAIR lesion, and when present, the contrast-enhancing (CE) T1 lesion. Maps of the apparent diffusion coefficient (ADC) and fractional anisotropy (FA) were calculated as described previously2. Kps (transfer coefficient) and fBV (fractional blood volume) were calculated for DCE3. The 3D 1H-MRSI datasets were combined and processed as described previously4, and then normalized Peak Heights were quantified for the parameters nNAA, nCho, nCre, nLac, nLip, Cho/Naa index, Cho/Cre index. We determined the imaging parameters with significant changes within the T2 FLAIR and CE ROIs leading up to the time of progression using repeated-measures analyses of variance.
Results
Nine patients had oligodendrogliomas (7 grade II, 2 grade III). Seven patients had IDH-mutated astrocytomas (5 grade II, 2 grade III). Two patients has astrocytomas NOS (2 grade II), and 5 patients had gliomas NOS (4 grade II, 1 grade III). Five patients were receiving Temozolimide, 15 patients were receiving Everolimus, and 3 patients were under surveillance.
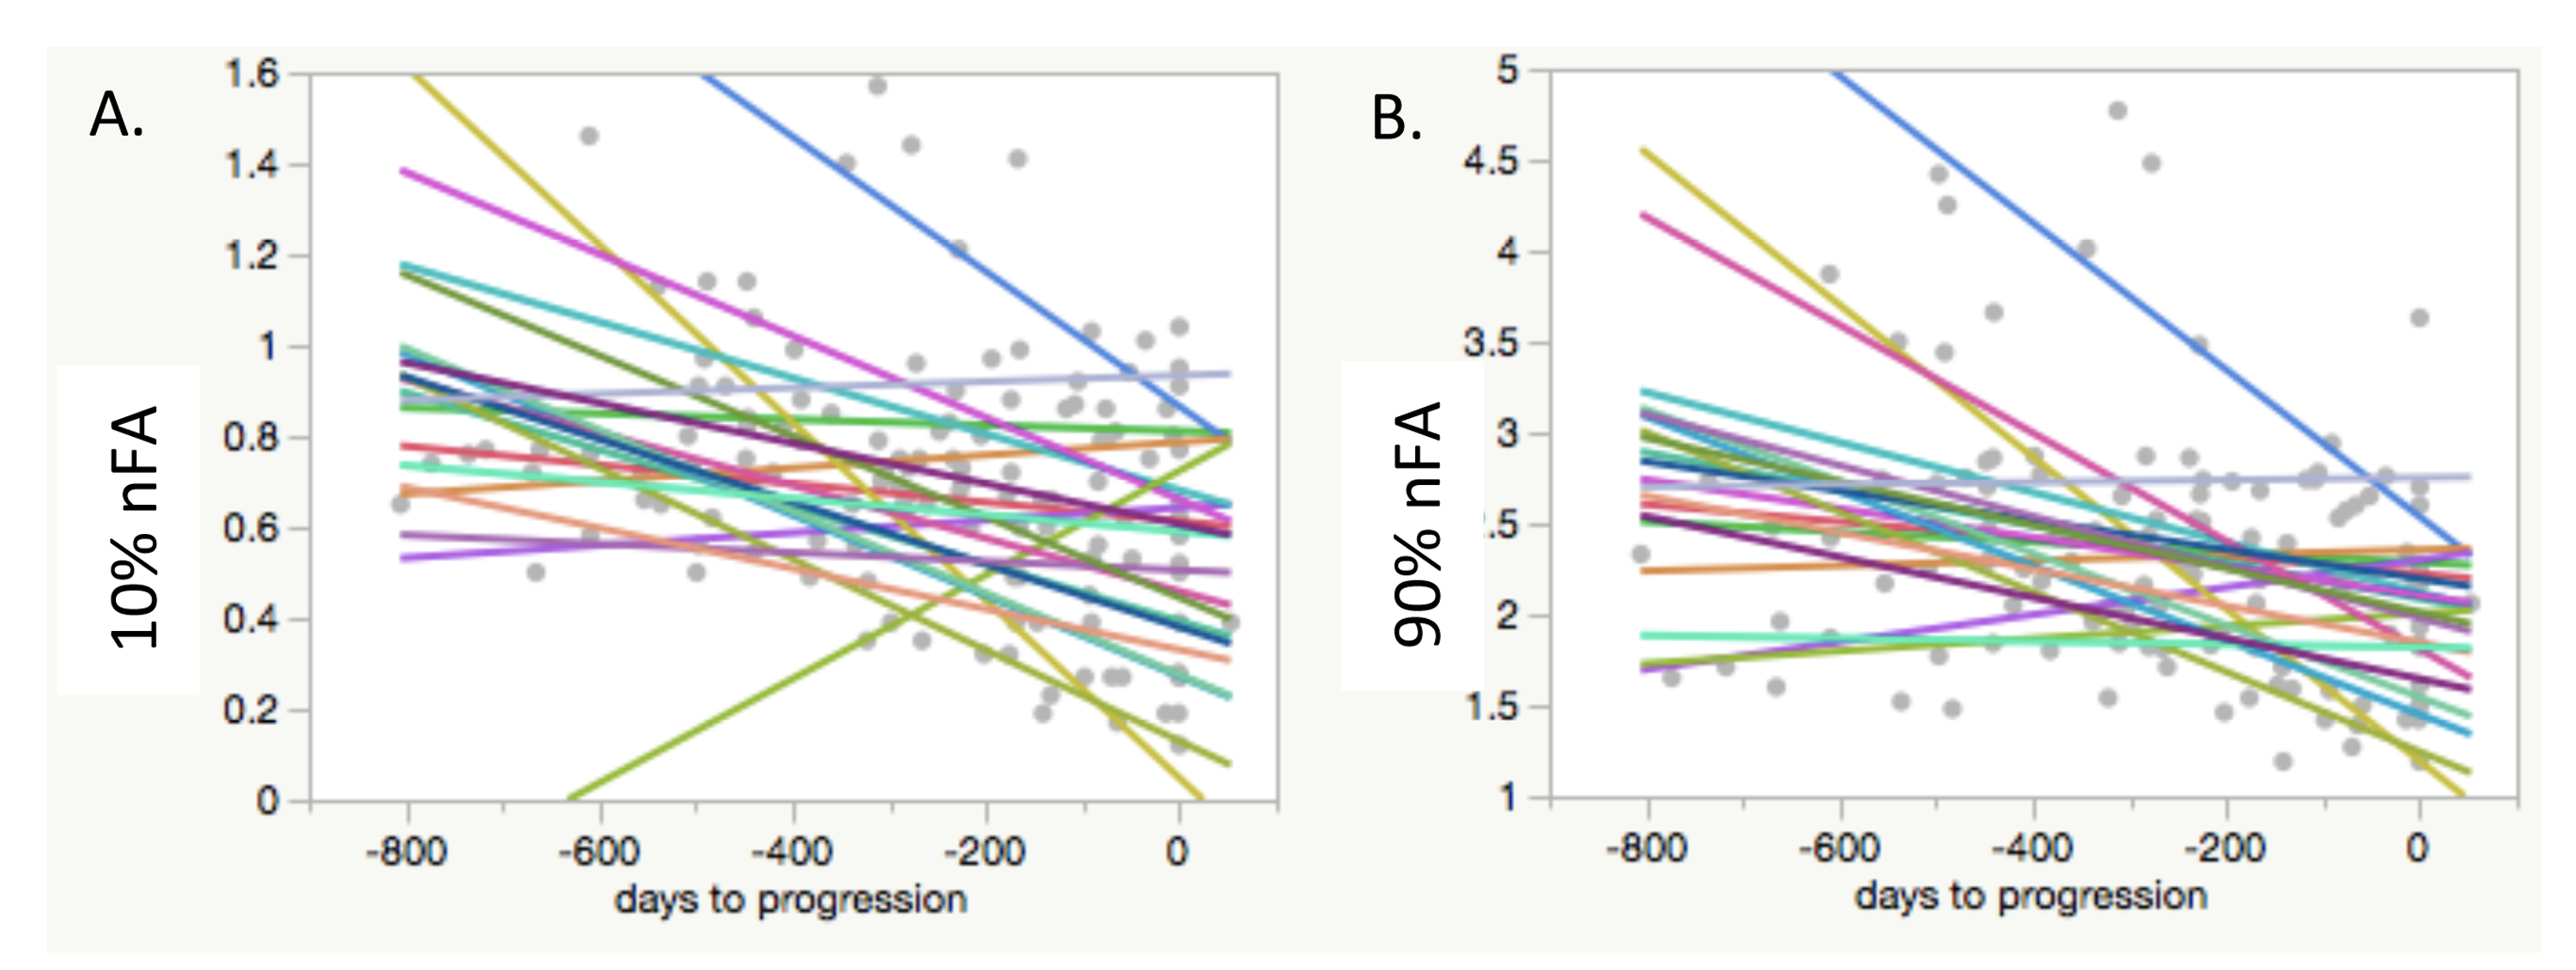
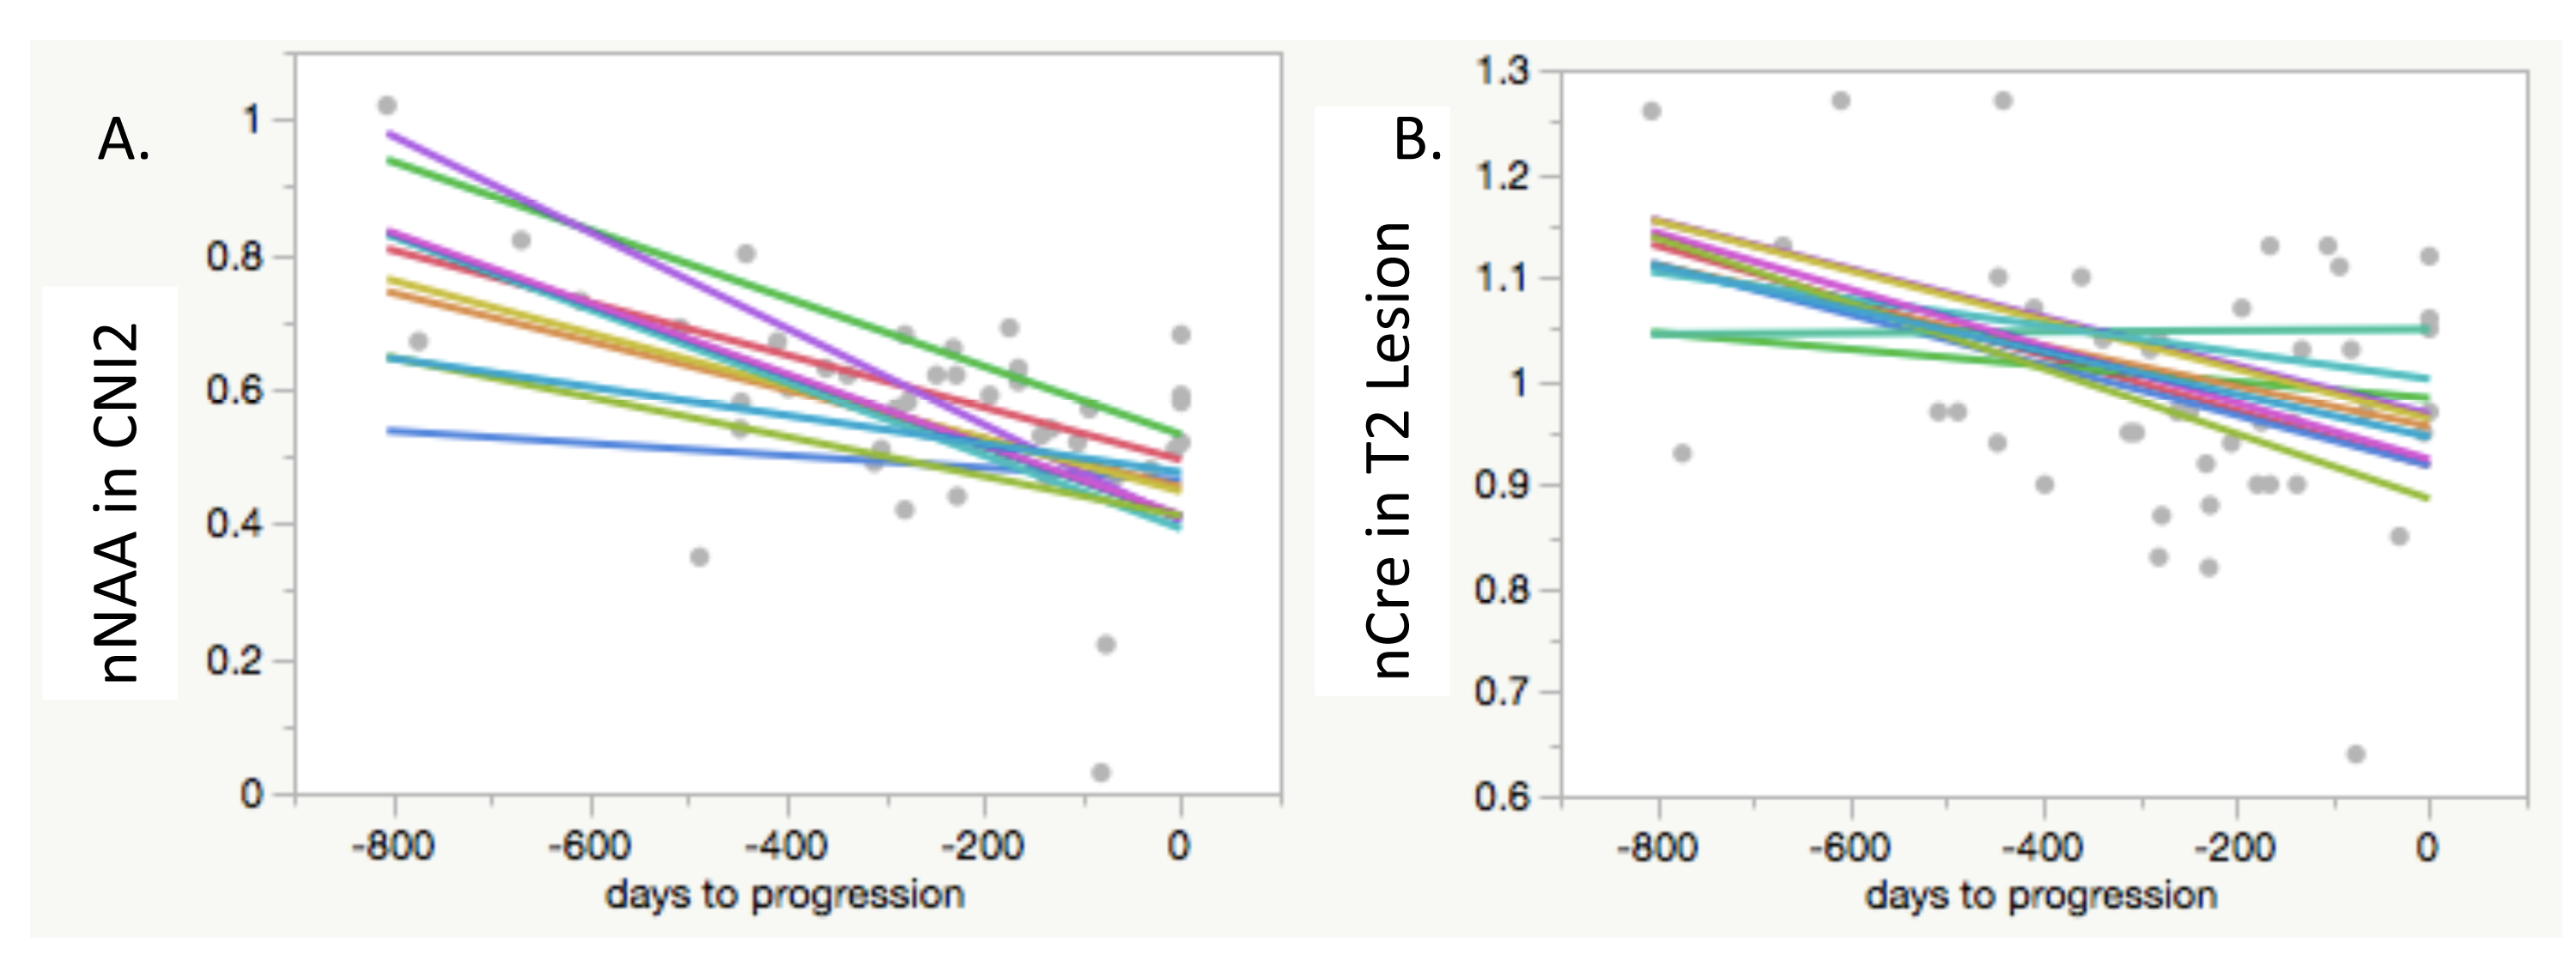
Across time to progression, within the T2 FLAIR lesion, there were significant declines in median nFA, 10% nFA, 90% nFA, nNAA median peak height in voxels with Cho/Naa index above 2 (CNI2), with trends toward a decline in nCRE median peak height (in all voxels within the T2 Lesion), and increases in median nADC within the CE lesion (for those patients with contrast enhancement). When looking only at the last 4 timepoints leading up to progression, within the T2 FLAIR lesion, there were significant declines in 10% nFA and nNAA in CNI2 (median peak height), and increases in nKPS, nCho in CNI2 (median peak height), nLip in CNI2 (median peak height), nLip (sum), with a trend towards an increase in nLac in CNI2 (median peak height). Within the CE lesion, prior to progression, there was a significant decline in 10% nFA.
Discussion
This study identified serial advanced imaging markers that demonstrated significant changes associated with tumor activity prior to the clinical determination of tumor progression in 23 grade II and III glioma patients. In diffusion imaging, there were declines in nFA, and increases in nADC in the contrast-enhancing lesions. In spectroscopic imaging, there were declines in nNAA and nCRE, and increases in nCho, nLIP and nLAC. Further analyses will investigate the sensitivity and selectivity with which progression can be predicted with these imaging markers.Acknowledgements
Funding was provided by SPORE (P50 CA097257), Novartis, Roche, and the Dabbiere Family.References
1. Wen PY, Macdonald DR, Reardon DA et al. Updated response assessment criteria for high-grade gliomas: response assessment in neuro-oncology working group. J. Clin. Oncol. 2010 (11): 1963-72.
2. Li, Y. et al. Serial analysis of imaging parameters in patients with newly diagnosed glioblastoma multiforme. Neuro Oncol, 2011. 13(5): p. 546-57.
3. Wahl M., et al. Probing the phosphatidylinositol 3-kinase/mammalian target of rapamycin pathway in gliomas: A phase 2 study of everolimus for recurrent adult low-grade gliomas. Cancer, 2017 doi: 10.1002/cncr.30909
4. Nelson, S.J. et al. Serial analysis of 3D H-1 MRSI for patients with newly diagnosed GBM treated with combination therapy that includes bevacizumab. J Neurooncol, 2016. 130(1): p. 171-179.
Figures