4859
Lactate-weighted Chemical Exchange Saturation Transfer (Lactate-CEST) Imaging in Glioma Patients at 7 Tesla1Radiology, German Cancer Research Center, Heidelberg, Germany, 2Medical Physics in Radiology, German Cancer Research Center, Heidelberg, Germany, 3Neuroradiology, University Hospital Heidelberg, Heidelberg, Germany, 4Neurology, University Hospital Heidelberg, Heidelberg, Germany, 5Neurosurgery, University Hospital Heidelberg, Heidelberg, Germany
Synopsis
Non-invasive imaging of lactate is of enormous significance, particularly in oncologic diseases or metabolic disorders. In this work, we applied Lactate-weighted Chemical Exchange Saturation Transfer (Lactate-CEST) magnetic resonance imaging (MRI) at 7 Tesla (7T) to newly-diagnosed glioma patients. Lactate-CEST MRI revealed increased levels of lactate production in brain tumors of patients with glioma and could therefore serve as an additional imaging biomarker in diagnostic oncology with implications for biopsy targeting, patient therapy and response monitoring.
Introduction
Cancer cells exhibit up-regulated lactate dehydrogenase (LDH) resulting in increased levels of lactate production in tumors (Warburg effect)1. Consequently, non-invasive imaging of lactate is of enormous significance, particularly in oncologic diseases or metabolic disorders2. The ability of Lactate-weighted Chemical Exchange Saturation Transfer (Lactate-CEST) magnetic resonance imaging (MRI) to measure LDH activity in vivo was recently demonstrated by DeBrosse et al. in human skeletal muscle2. In this work, we applied Lactate-CEST MRI at 7 Tesla (7T) to newly-diagnosed glioma patients in order to assess the methods potential to detect areas of increased lactate production in brain tumors.Methods
Ten patients (5 female, 5 male) with newly diagnosed and histologically proven glioma (8 patients with glioblastoma WHO grade IV and 2 patients with glioma WHO grade II) were enrolled in this prospective institutional review board-approved study after written informed consent was obtained. Lactate-CEST MRI was performed at a 7T whole-body scanner (Magnetom 7T; Siemens Healthcare, Erlangen, Germany) employing a centric-reordered 2D-GRE-CEST sequence (three slices with resolution of 1.71x1.72x5 mm3) and a 24-channel head coil for reception. Pre-saturation consisted of 10 Gaussian–shaped pulses (pulse length: tp = 90 ms, duty cycle: DC= 80%, and saturation power B1 = 1.1 µT) applied at 31 equidistant frequency offsets in the range from -1.5 to 1.5 ppm with an additional M0-scan at -300 ppm. The WASABI approach was used to correct for B0 field inhomogeneities3. Magnetization transfer asymmetry (MTRasym) calculation, defined as MTRasym= Z(Δω = -0.6 ppm) - Z(Δω = +0.6 ppm), yields a lactate-weighted MRI contrast comparable to deBrosse et al2. T1-weighted gadolinium contrast-enhanced (T1gdce) images were obtained along the clinical 3T protocol and used for data segmentation. High resolution T2-weighted images (matrix= 512 x 400, resolution=0.4 x 0.4 x 2 mm3, TR=12340 ms, TE=54 ms) were additionally acquired at 7T MRI. Data registration and segmentation was performed using the MITK software4. Three regions of interest (ROI) were selected on T1-gdce images for quantitative analysis: solid tumor, necrosis, and contralateral normal appearing white matter (CLNAWM). Mean signal intensities in the investigated ROIs of all patients were illustrated as boxplots and compared for statistical significant differences using the Wilcoxon rank-sum test after normality testing (Shapiro-Wilk-test) failed.Results
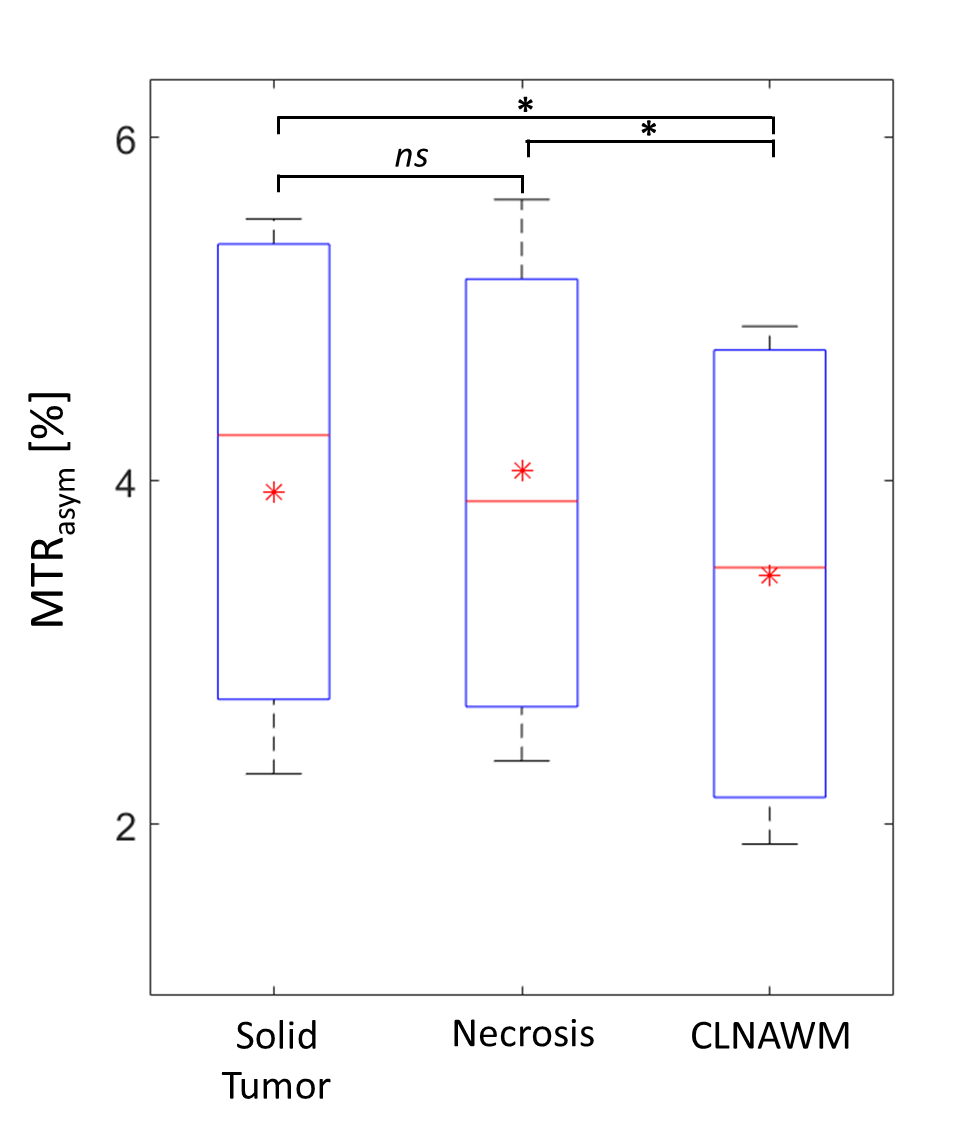
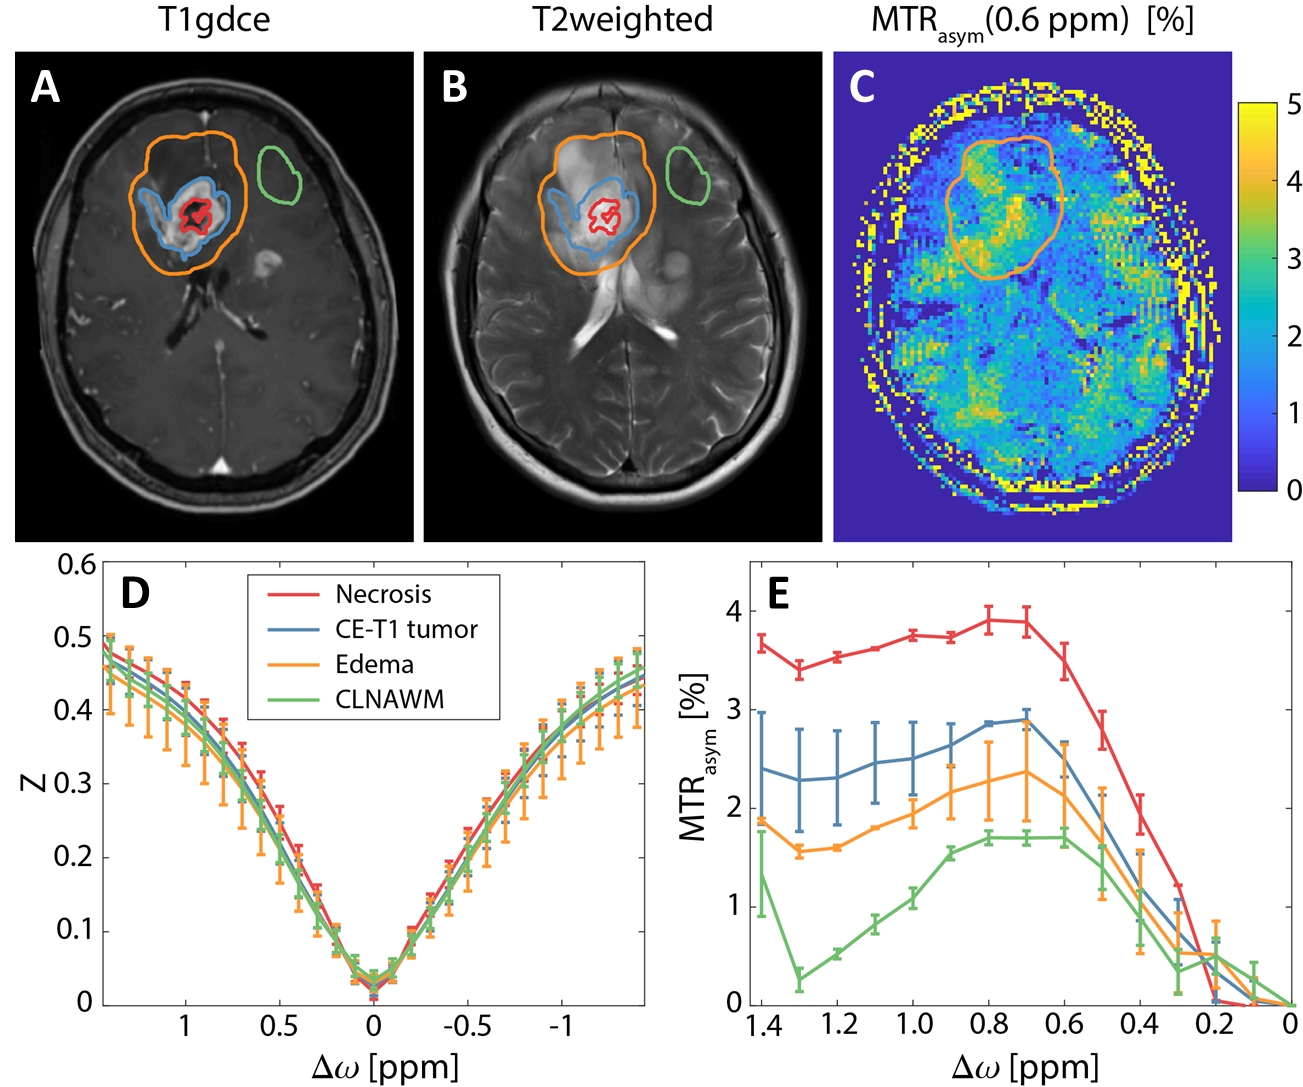
Lactate values were significantly increased both in solid (3.94 ± 1.22) and necrotic (4.06 ± 1.29) tumor regions compared to CLNAWM (3.45 ± 1.21) overall patients (p<0.05) (Figure 1). There were no statistically significant differences between the solid tumor and necrosis (p>0.05). Figure 2 shows the lactate-weighted CEST MR imaging of one exemplary glioblastoma patient. Increased signal intensity displays in all tumor areas (necrosis, contrast enhanced region = CE-t1 tumor, and peritumoral edema) compared to CLNAWM (Fig 2). Visual observations are confirmed by Z-Spectrum analysis (Fig 2D) and MTRasym calculation (Fig 2E).Discussion & Conclusion
In this work we show that lactate-weighted CEST-MRI reveals increased levels of lactate production in brain tumors of patients with glioma. Our results are in agreement with proton MR spectroscopy (1H-MRS) studies reporting increased lactate concentrations in human glioma, particularly in glioblastoma5. However, DeBrosse et al. reported that lactate-weighted CEST MRI has significantly higher sensitivity than conventional 1H-MRS2. Therefore, Lactate-CEST MRI could serve as an additional imaging biomarker providing complementary information about the heterogeneity of tumors, with implications for biopsy targeting, patient therapy and response monitoring.Acknowledgements
References
1. Fantin, V. R. et al. Attenuation of LDH-A expression uncovers a link between glycolysis, mitochondrial physiology, and tumor maintenance. Cancer Cell 9, 425–434 (2006).
2. DeBrosse, C. et al. Lactate Chemical Exchange Saturation Transfer (LATEST) Imaging in vivo A Biomarker for LDH Activity. Sci Rep. 6, 19517 (2016).
3. Schuenke, P. et al. Simultaneous mapping of water shift and B1(WASABI)-Application to field-Inhomogeneity correction of CEST MRI data. Magn. Reson. Med. 77, 571–580 (2016).
4. Nolden, M. et al. The medical imaging interaction toolkit: Challenges and advances: 10 years of open-source development. Int. J. Comput. Assist. Radiol. Surg. 8, 607–620 (2013).
5. Ott, D. et al. Human brain tumors: assessment with in vivo proton MR spectroscopy. Radiology 186.3 (1993): 745-752.
Figures