4855
Characterization of Active and Infiltrative Tumorous Subregions from Normal Tissue in Brain Gliomas Using Multi-Parametric MRI1Quantitative MR Imaging and Spectroscopy Group, Research Center for Molecular and Cellular Imaging, Tehran University of Medical Sciences, Tehran, Iran (Islamic Republic of), 2Department of Statistics, Faculty of Mathematical Science, University of Guilan, Rasht, Iran (Islamic Republic of), 3Department of Neurological Surgery, Imam Khomeini Hospital, Tehran University of Medical Sciences, Tehran, Iran (Islamic Republic of), 4Medical Imaging Center, Imam Khomeini Hospital, Tehran University of Medical Sciences, Tehran, Iran (Islamic Republic of), 5Department of Pathology, Imam Khomeini Hospital, Tehran University of Medical Sciences, Tehran, Iran (Islamic Republic of)
Synopsis
In this preliminary work, a variety of MRI techniques, including conventional high-resolution T1-weighted, T2-weighted, and T2-FLAIR, as well as quantitative techniques comprising of T2-relaxometry, DWI, DTI, DSC-MRI, and IVIM derived features were acquired from patients with gliomas. The features extracted from the mentioned images were explored for their potential in stratification of histopathologically-approved samples, labelled as active tumor, infiltrative glioma (edema) and normal brain tissue. Furthermore, the most accurate combination of the features for discrimination of tissue subregions was generated through a machine learning technique.
Introduction
Diffuse gliomas are characterized with spatial intra-tumor variability within their microenvironment, which is partly responsible for their grim prognosis 1. Currently, targeted biopsy and surgical/treatment planning procedures for gliomas are guided by conventional contrast-enhanced T1-weighted (CE-T1w) and T2-w 2,3. Nonetheless, relying upon these images cannot sufficiently stratify tumorous regions including the most active tumor (AT) component and nonenhancing tumor or infiltrative edema (IE) from each other and from the normal tissue (NT). In this preliminary study, we explored the competitive/complementary roles of a variety of multi-parametric MRI features for differentiation of biopsy-approved AT, IE, and NT regions through a machine learning approach.Methods
Institutional review board (IRB) approval was obtained and seven patients diagnosed with glioma based on their initial MRI scans gave their informed consent to be included in this prospective study. Pre-surgical MRI was performed on a 3T scanner (Tim Trio, Siemens). The protocol included MPRAGE pre- and post-contrast T1-w, MPRAGE T2-w, T2-FLAIR, DWI (b= 0, 1000 s/mm2), DTI (b= 0, 1000 s/mm2, 64 directions), T2-relaxometry (16 TEs=12,24,36,48,60,72,84,96,108,120,132,144,156,168,180,192 ms), IVIM (b= 0, 50, 200, 400, 600, 800, 1000 s/mm2), and DSC-MRI. The patients underwent 3D CT imaging using a 64-slice CT scanner (GE Healthcare Technologies, USA) with no gantry tilt.
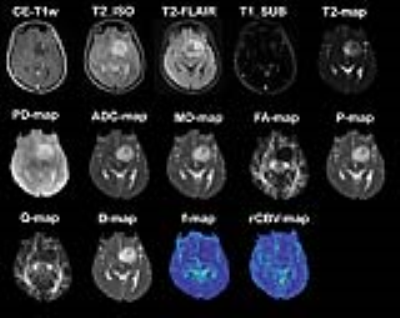
A radiologist identified 8x8 rectangular regions-of-interest (ROIs) on CE-T1w MPRAGE images for image-guided needle biopsy sampling. Thirty-four regions were sampled by a neurosurgeon and the specimens were evaluated by a pathologist to be attributed to AT, IE, or NT tissue subregions (8 NT, 20 IE, and 6 AT). For each of the quantitative imaging methods, parametric maps were derived. The generated maps from different modalities, comprising rCBV-map from DSC-MRI, ADC-map from DWI, FA, MD, p, q from DTI, D, f, and D* from multi b-value diffusion imaging, T2 and PD maps from T2-relaxometry technique, FLAIR, and MP-RAGE pre-contrast T1-w MP-RAGE T2-w images were co-registered with post-contrast MPRAGE T1-w images using rigid registration method with normalized mutual information (NMI). The difference of post- and pre-contrast T1-w images was calculated to form T1w_SUB image. The final feature vector included 14 imaging features: [rCBV, ADC, MD, FA, P, Q, D, D*, f, T2, PD, T2w, FLAIR, T1w_SUB] (Fig. 1). The pre-surgical ROIs were overlaid on the coregistered parametric maps and images to extract the values of 14 MRI-derived features within these labelled ROIs.
Feature selection was performed using forward, backward, and stepwise AIC and BIC methods (generating 6 feature selection methods). The feature selection algorithm was adjusted to avoid choosing MRI parameters with close biophysical definitions. Leave-one-out cross-validated support vector machine (SVM) classifier was applied on the selected features from the previous step to classify samples into AT, IE, and NT groups. Classification performance was evaluated based on sensitivity, specificity, accuracy, and area under the ROC curve (AUC) measures.
Results
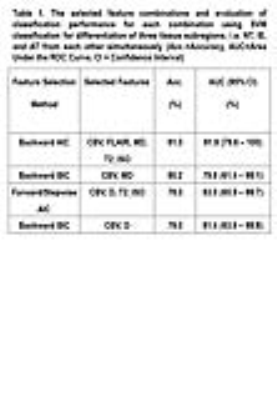
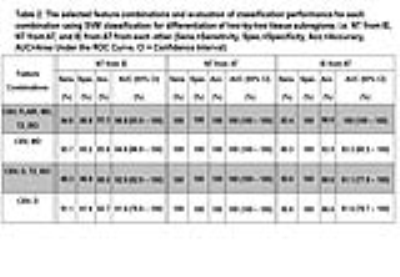
For classification of the three tissue subtypes from each other, i.e. NT, IE, and AT, four combinations were most frequently selected by feature selection strategies: (1) CBV, MD, FLAIR, T2_ISO (selected by Backward AIC); (2) CBV, MD (selected by Backward BIC); (3) CBV, D, T2_ISO (Forward/Stepwise AIC); and (4) CBV, D (selected by Backward BIC) (Table 1). As the results suggest, for differentiation of the three subregions at the same time, the most accurate feature combination is CBV, MD, FLAIR, T2_ISO with accuracy of ~91% and AUC of ~92% based on SVM classification. This combination indicates high accuracy in pairwise discrimination of regions (Table 2): for NT from IE, accuracy~93% and AUC~99%, for NT from AT, accuracy and AUC of 100%, for IE from AT, accuracy of 97% and AUC of 100%. A combination of fewer features including CBV, D, T2_ISO also shows high performance for pairwise subregion differentiation: for NT from IE, accuracy~88% and AUC~93%; for NT from AT, accuracy~100% and AUC~100%; for IE from AT, accuracy~89% and AUC~91%.Discussion and Conclusions
Lack of sensitive and specific quantitative imaging biomarkers for realizing spatial variations of gliomas leads to inaccurate biopsy sampling, which hinders target-specific diagnosis and therapies. This study was designed to investigate the potential of a variety of MRI techniques and qualitative/quantitative parameters for differentiating subregions within glioma tumors according to hitopathologically-validated biopsy specimens. It was shown that a combination of “CBV, MD, FLAIR, T2_ISO” could reliably characterize the infiltrative edema (IE) from most active tumor (AT) component and normal tissue (NT). This combination which has been previously been utilized for discrimination of intra-tumor subregions 4,5 can indicate variations within tumorous tissues by simultaneously capturing the underlying neo-vascularity, tissue cellularity, and biophysical relaxation properties of the tissue.Acknowledgements
No acknowledgement found.References
1- Claes A, Idema AJ, Wesseling P. Diffuse glioma growth: a guerilla war. Acta neuropathologica. 2007; 114(5):443-458.
2- Carlsson SK, Brothers SP, Wahlestedt C. Emerging treatment strategies for glioblastoma multiforme. EMBO molecular medicine. 2014; 6(11):1359-1370.
3- Chamberlain MC. Radiographic patterns of relapse in glioblastoma. Journal of neuro-oncology. 2011; 101(2):319-323.
4- Kazerooni AF, Mohseni M, Rezaei S, Bakhshandehpour G, Rad HS. Multi-parametric (ADC/PWI/T2-w) image fusion approach for accurate semi-automatic segmentation of tumorous regions in glioblastoma multiforme. Magnetic Resonance Materials in Physics, Biology and Medicine. 2015; 28(1):13-22.
5- Emblem KE, Nedregaard B, Hald JK, Nome T, Due‐Tonnessen P, Bjornerud A. Automatic glioma characterization from dynamic susceptibility contrast imaging: Brain tumor segmentation using knowledge‐based fuzzy clustering. Journal of Magnetic Resonance Imaging. 2009; 30(1):1-10.


