4854
True-Diffusion Coefficient Retracted from Intra-Voxel Incoherent Motion (IVIM) Can Stratify Biopsy-Approved Infiltrative Edema from Normal Tissue and Active Tumor in Diffuse Brain Gliomas1Quantitative MR Imaging and Spectroscopy Group, Research Center for Molecular and Cellular Imaging, Tehran University of Medical Sciences, Tehran, Iran (Islamic Republic of), 2Department of Statistics, Faculty of Mathematical Science, University of Guilan, Rasht, Iran (Islamic Republic of), 3Department of Neurological Surgery, Imam Khomeini Hospital, Tehran University of Medical Sciences, Tehran, Iran (Islamic Republic of), 4Medical Imaging Center, Imam Khomeini Hospital, Tehran University of Medical Sciences, Tehran, Iran (Islamic Republic of), 5Department of Pathology, Imam Khomeini Hospital, Tehran University of Medical Sciences, Tehran, Iran (Islamic Republic of), 6Department of Medical Biophysics, University of Toronto, Toronto, ON, Canada
Synopsis
Infiltration of tumorous cells in the normal brain parenchyma is an intrinsic characteristic of diffuse gliomas and is a determinant factor in tumor recurrence, transformation into malignant form, and poor prognosis. The objective of this study was to investigate the role of intra-voxel incoherent motion (IVIM) imaging in characterizing tumor infiltration through localized biopsies. Histopathologically-approved regions of active tumor, infiltrative glioma (edema), and normal tissues were accurately discriminated by true (perfusion-free) diffusion coefficient (D).
Introduction
Diffuse gliomas are characterized with extensive diffuse infiltration of tumor cells in the adjacent brain parenchyma, and spatial heterogeneity across their environmental scope 1. Conventional MRI cannot sufficiently identify the tumorous regions within the gliomas, i.e. active tumor (AT) and infiltrative glioma (IE) and the normal tissue (NT) 2. Diffusion of water molecules, measured based on diffusion-weighted (DW) MRI and apparent diffusion coefficient (ADC), may serve as surrogate biomarker of brain tissue microstructure 3. Intra-voxel incoherent motion (IVIM) model allows for simultaneous derivation of slow (true) diffusion coefficient (D), fast diffusion coefficient (D*), and fraction of fast ADC (f), representing perfusion 4. In this study, we aimed to investigate potential of quantitative IVIM-derived parameters in characterizing tumorous regions and their correlation with cellular density, through assessments of specimens collected by needle biopsy image-guided neurosurgery.Methods
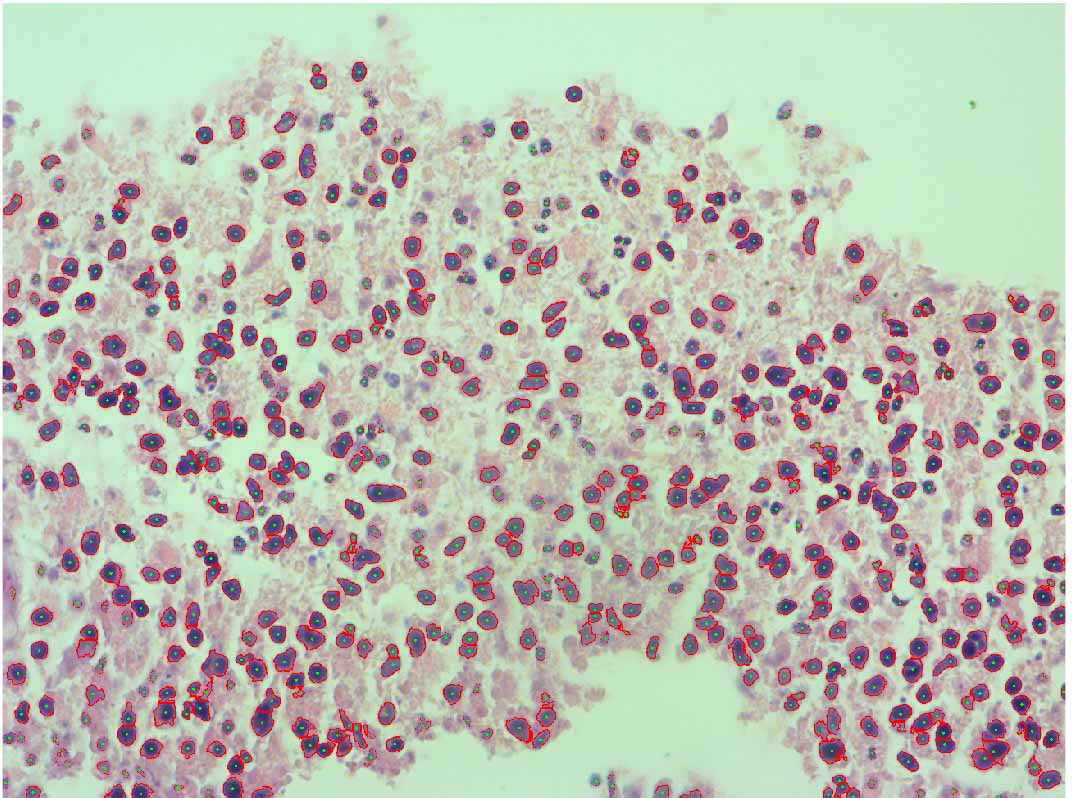
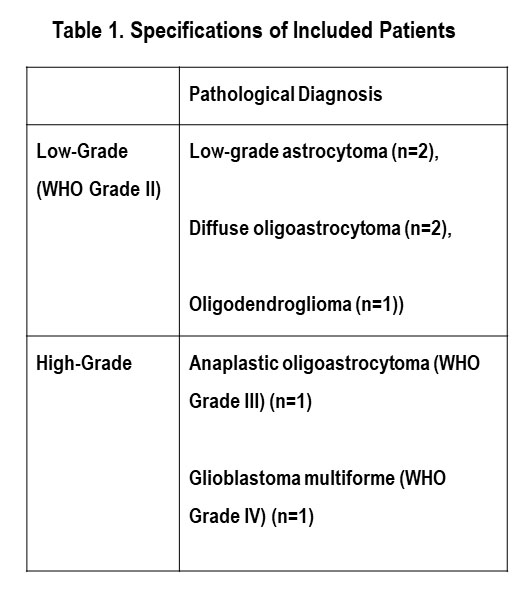
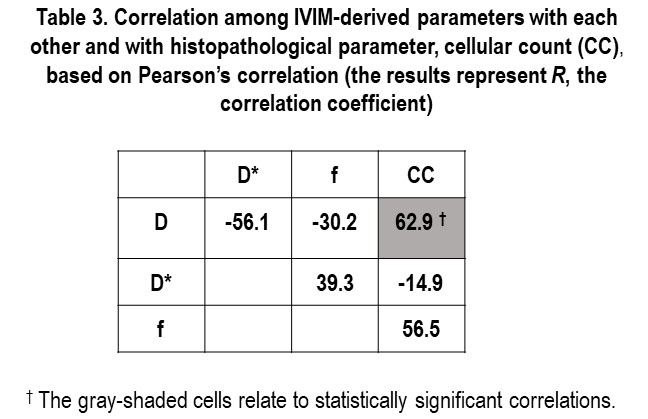
Institutional review board (IRB) approved this HIPAA-compliant prospective study and all 7 included patients (Table 1) provided their informed consent. Structural and physiological MRI acquisition were performed. Axial multi b-value DWI was acquired on a 3T MRI scanner (Siemens MAGNETOM Tim Trio, Germany) with TE/TR=100/4000, slice thickness=5 mm, flip angle=90°, FOV=200×200 mm2, image matrix=136×136, pixel size=1.47×1.47 mm, b-value=0,50,200,400,600,800,1000 s/mm2. Pixelwise D, D*, and f were computed based on IVIM formulation 4 and using nonlinear least squares method. Prior to image-guided neurosurgery, the rectangular regions of interest (ROIs) were marked on MPRAGE contrast-enhanced T1-weighted images as biopsy targets by a radiologist. The target points were sampled by a neurosurgeon and sent for post-operative pathological assessments. For each specimen, the pathologist determined the presence of tumor cells and scored them as NT when no tumor cells were identified, IE when infiltrating tumor cells were present, and AT when tumor constituted the majority of tissue. Overall, 34 samples were included in our quantitative analysis (n=6 AT, n=20 IE, and n=8 NT samples). For each specimen, a microscopic histology image was captured at x40 magnification and quantitative assessment was performed based on an automated cell segmentation algorithm that applies decorrelation and stretching of the colorspace in the preprocessing step for improving the performance of cell segmentation. Cellular count (CC), as a representative parameter of cellular density, was measured and the relationship between CC in tissue subregions and IVIM-derived parameters, i.e. D, D*, and f was computed. The analysis of variance for differentiating the three regions, i.e. NT, IE, and AT, from each other was performed based on one-way ANOVA. For discrimination of each of the two regions from each other, post-hoc Tukey’s honest significant difference (Tukey-HSD) test was applied. Correlation among MRI-derived parameters with each other and with CC was calculated using 2-tailed Pearson’s test. A level of 0.05 was considered for significance of p-values.Results
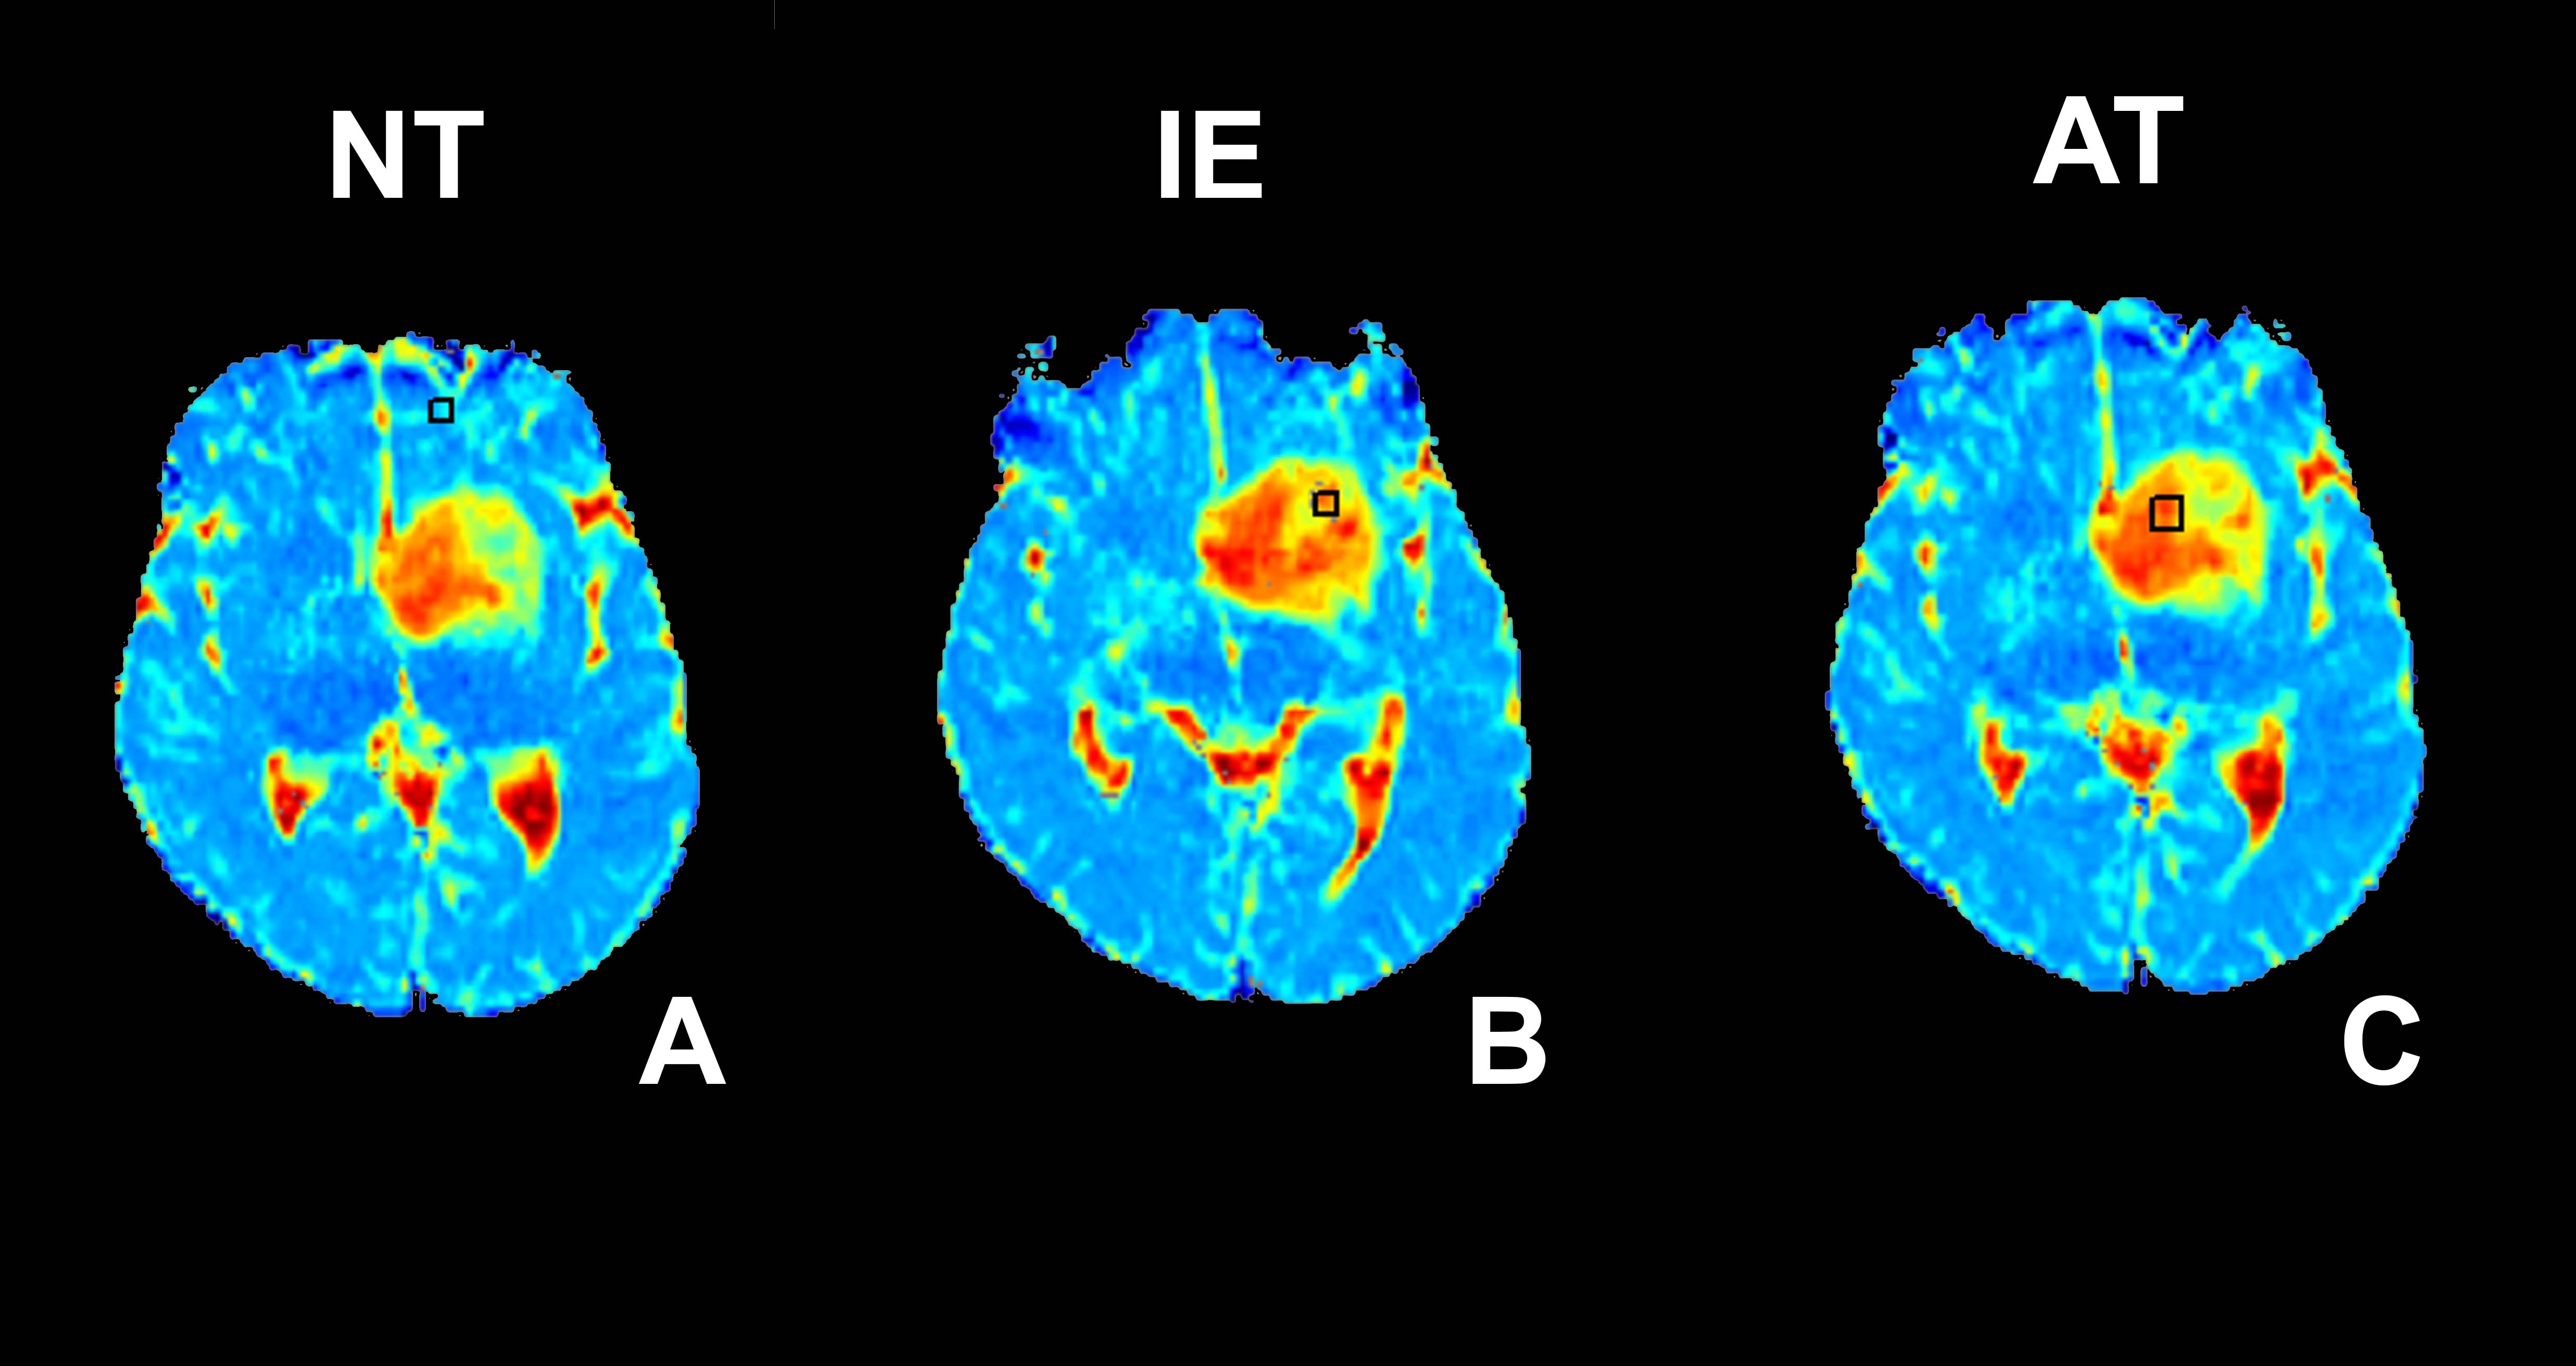
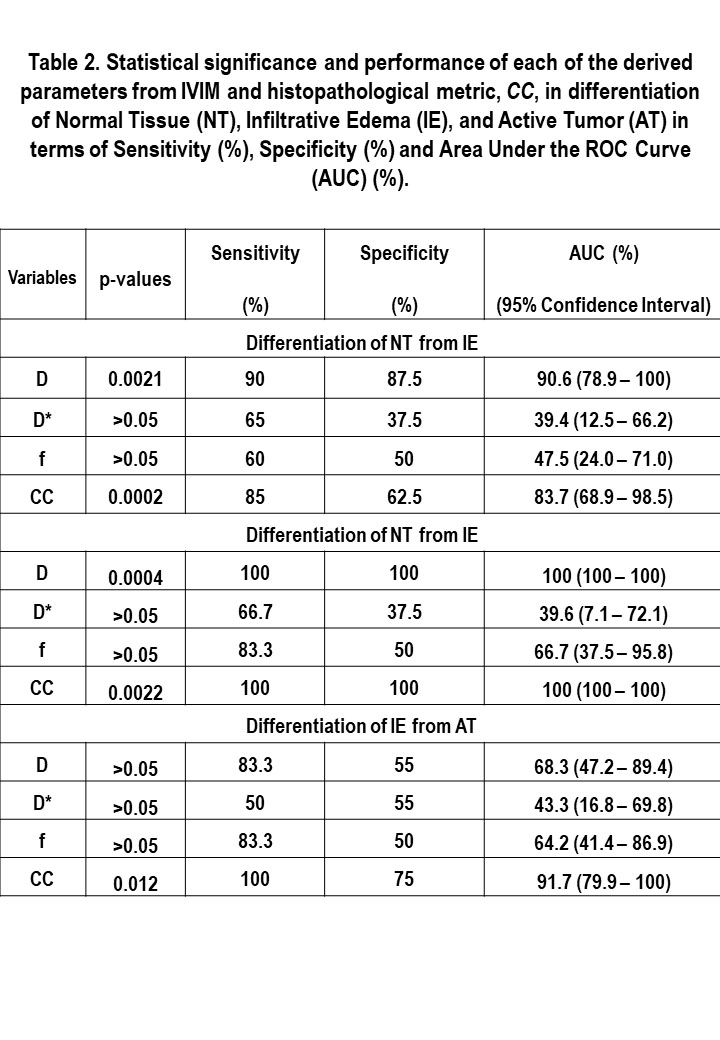
Thirty-four histology slides were analyzed using the automatic segmentation method (Fig. 1). CC resulted in statistically significant difference for differentiation of the three subregions (P<0.0000) and showed a strong correlation (R=81.7%) with the diagnosis of the pathologist. For discrimination of NT from IE, IE from AT, and NT from AT, CC showed statistically significant differences (P=0.0002, P=0.013, and P=0.002, respectively). Evaluations of IVIM parameters for differentiation of each of two tissue subregions, i.e. AT, IE, and NT (Fig. 2), and their correlations are indicated in Tables 2-3. For differentiation of the three tissue subregions, D (P=0.0003) showed statistically significant difference and was statistically significant (P=0.002) for differentiation of NT from IE, with sensitivity= 90%, specificity= 87.5%, and AUC= 90.6%. For discrimination of IE from AT, none of the IVIM-derived parameters showed statistically significant differences. D (P=0.0004) was significant for differentiation of NT from AT, and showed sensitivity, specificity, and AUC of 100%. D indicated a direct and good correlation with CC (R=62.9%).Discussion and Conclusions
The results of the present work unraveled that D, with a relatively strong correlation with histopathological cellular density metric, could be a potent biomarker for differentiation of the three subregions (AUC=92.8%), for discrimination of NT from IE (AUC=90.6%) and AT from NT (AUC=100%). D is indicative of true diffusion coefficient and is not contaminated by capillary perfusion. Abnormal pathogenic processes which affect the structure of brain tissue, can be detected by changes in water diffusion, even at early stages 5. D could not differentiate IE from AT, suggesting that tissue microstructure does not differ significantly in those regions in terms of diffusion restriction and cellular density. These regions may be dissimilar based on their microvessel density and the amount of neo-angiogenesis. Nonetheless, in this study, the IVIM-derived perfusion metric, i.e. f, did not show significant differences among any of the regions.Acknowledgements
No acknowledgement found.References
1. Claes A, Idema AJ, Wesseling P. Diffuse glioma growth: a guerilla war. Acta Neuropathol 2007;114: 443-4582. Roberts TP, Mikulis D. Neuro MR: principles. J Magn Reson Imaging 2007;26:823-8373. Chen L, Liu M, Bao J, et al. The correlation between apparent diffusion coefficient and tumor cellularity in patients: a meta-analysis. PloS one 2013;8:e790084. Le Bihan D, Breton E, Lallemand D, et al. Separation of diffusion and perfusion in intravoxel incoherent motion MR imaging. Radiology 1988;168:497-5055. Tofts P. Quantitative MRI of the brain: measuring changes caused by disease. John Wiley & Sons; 2005.
Figures