4853
Edge Contrast of the FLAIR Hyperintense Region Predicts Survival in Patients with High Grade Gliomas Following Treatment with Bevacizumab1University of California, San Diego, San Diego, CA, United States
Synopsis
Treatment with bevacizumab is standard of care for recurrent high grade gliomas (HGGs) and the level of border distinctness is a major parameter to monitor the therapy. Previously, the level of border distinctness was defined qualitative. In this study, we calculated the distinctness of the fluid-attenuated inversion recovery (FLAIR) hyperintense border—edge contrast (EC)—and showed it improves the evaluation of response to bevacizumab in patients with HGG. We showed that after bevacizumab, lower EC of the FLAIR hyperintense region was associated with poorer survival among HGG patients. We developed a quantitative parameter to characterize the border of the tumor.
Introduction
High grade glioma (HGG) is among the most common primary brain tumor in adults and is associated with a poor prognosis.1 Treatment with bevacizumab is the standard of care for recurrent high grade gliomas (HGGs); However, monitoring response to treatment following bevacizumab remains a challenge.2–4 Previous studies suggest that sharpness of T2/ fluid-attenuated inversion recovery (FLAIR) borders has prognostic value following treatment with bevacizumab and may provide a valuable biomarker of tumor progression.5,6 However, there exists significant variability in terminology and ambiguous criteria for defining FLAIR borders (e.g. “well-defined” versus “vague, ill-defined”) in the clinical setting. Therefore, quantitative imaging metrics that are standardized across studies and independent of inter-rater and intra-rater bias are needed. The purpose of this study is to determine whether quantifying the sharpness of the FLAIR hyperintense border using a measure derived from texture analysis—edge contrast (EC)—improves the evaluation of response to bevacizumab in patients with HGG.Methods
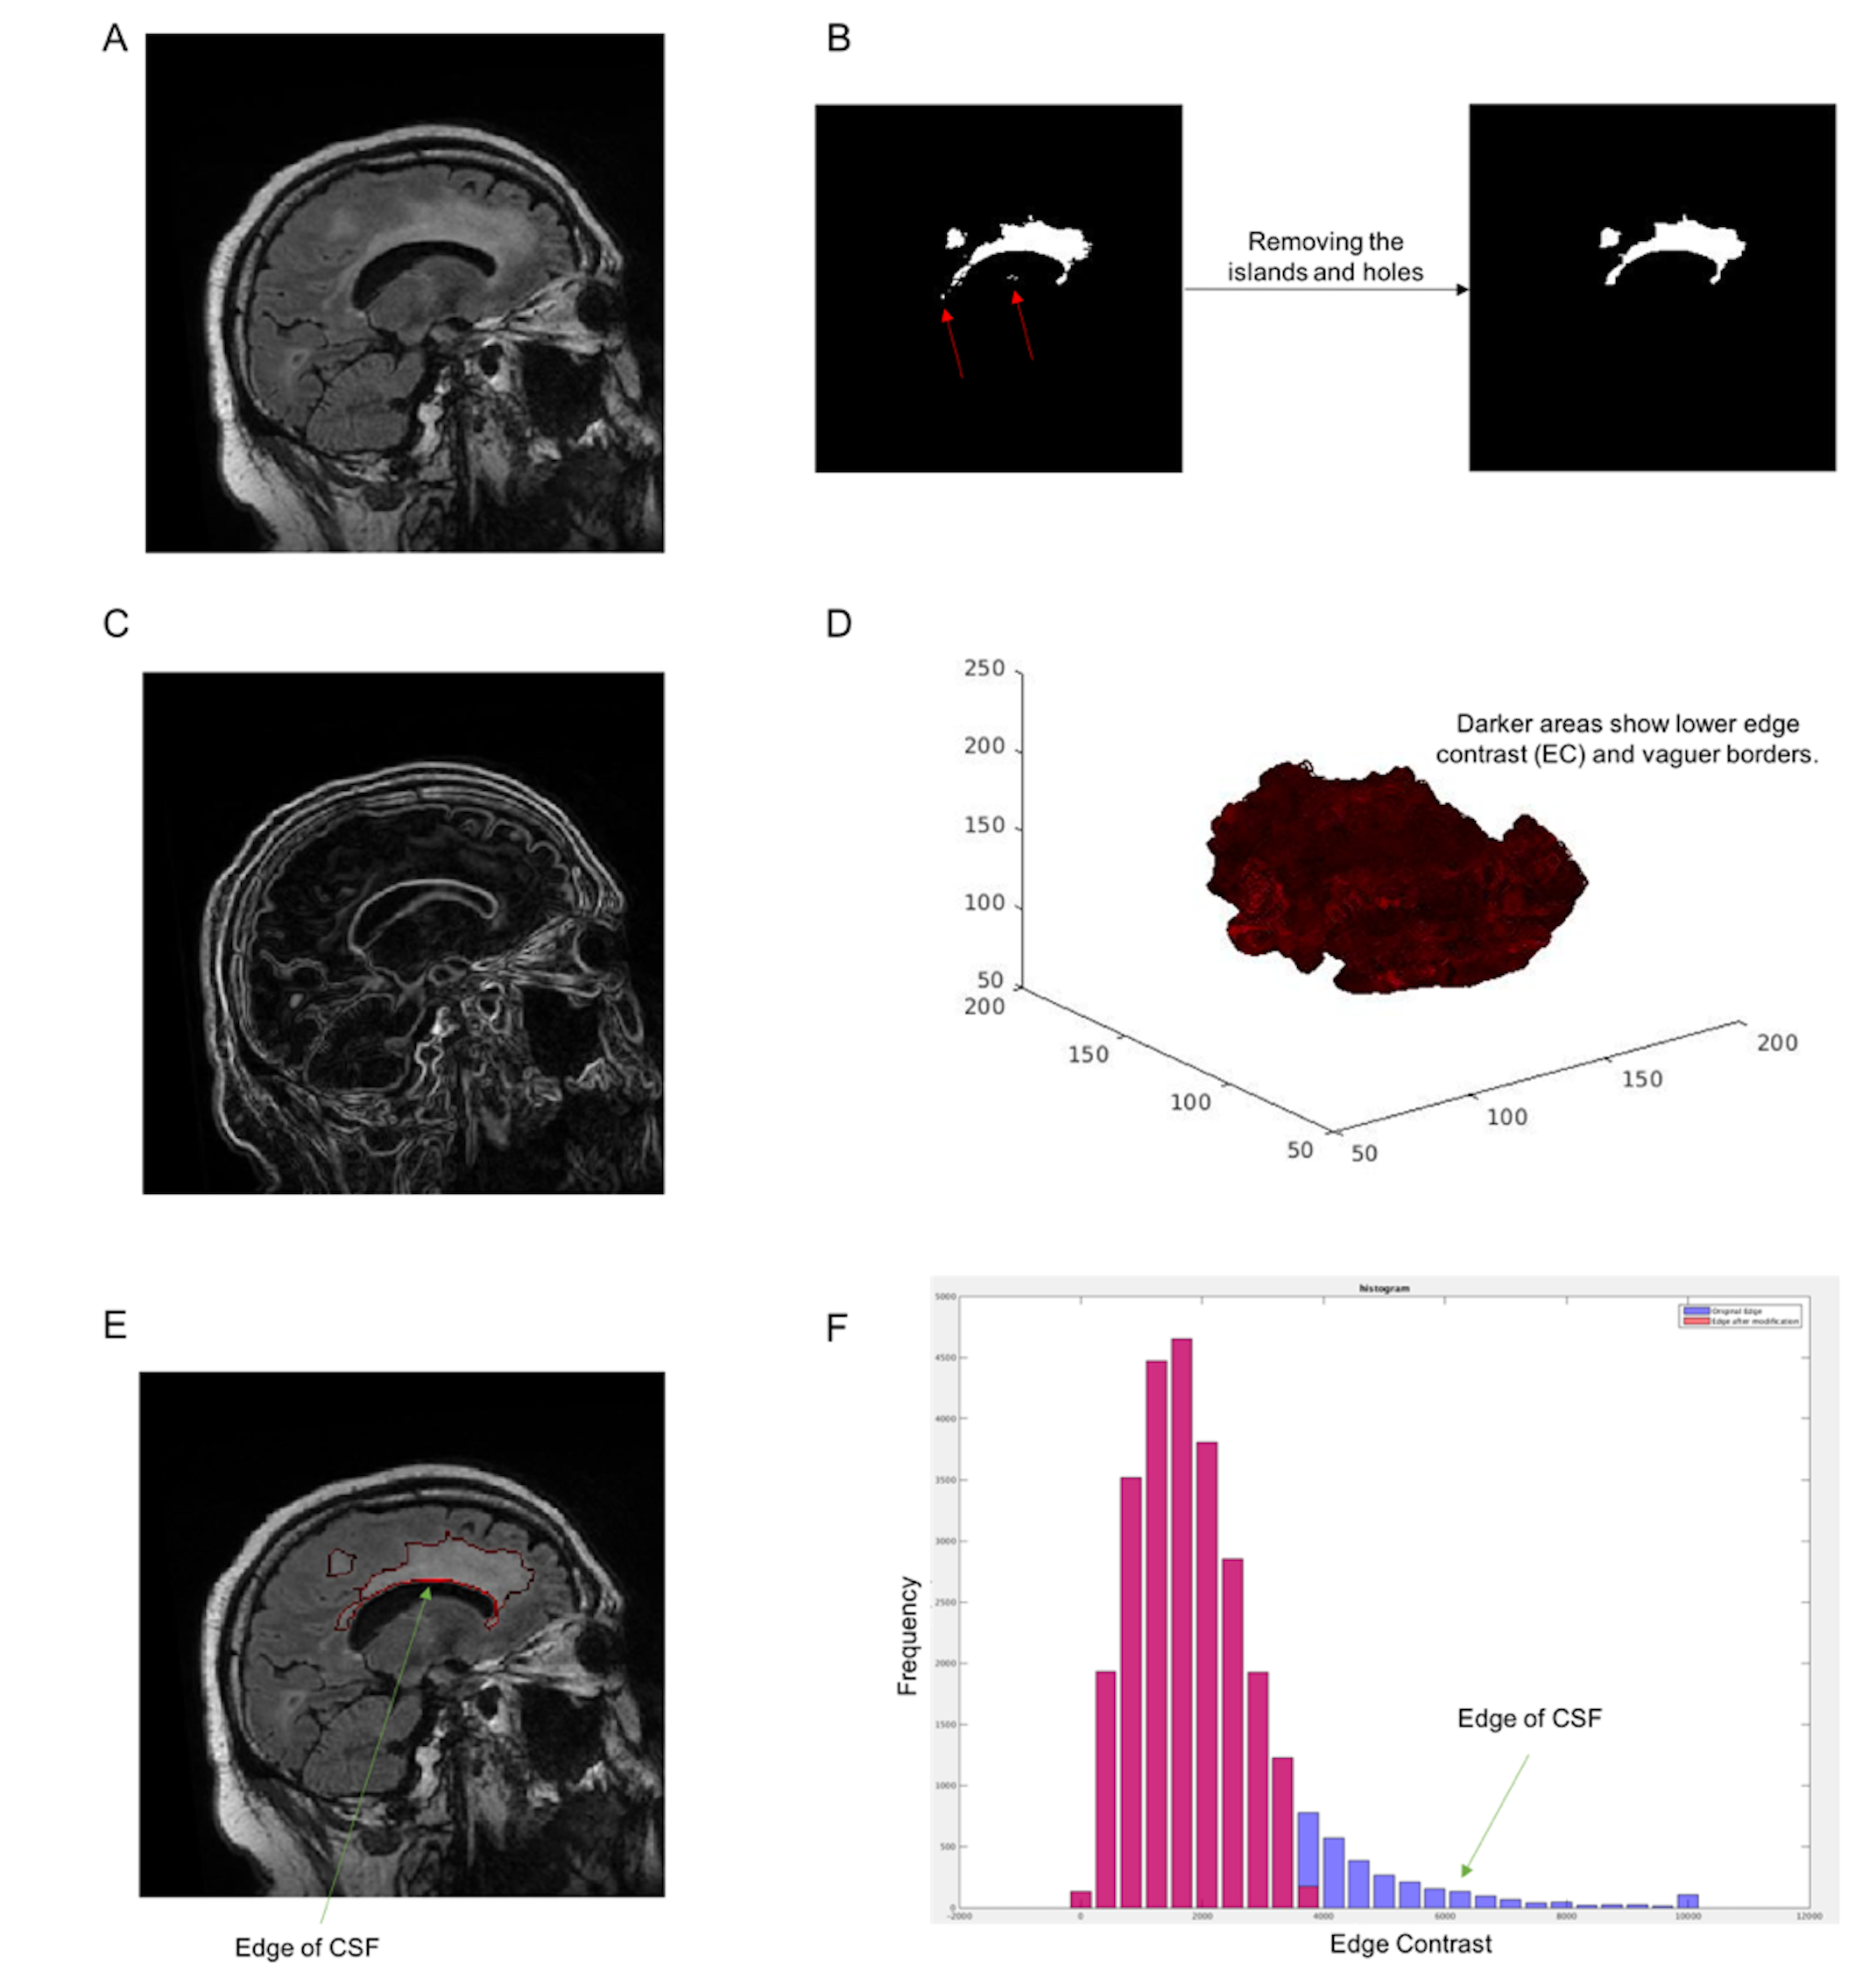
MRIs were evaluated in 33 patients with HGG before and after the initiation of bevacizumab. The imaging protocol included pre- and post-gadolinium 3D volumetric T1-weighted inversion recovery-spoiled gradient recalled echo (IR-SPGR) with TE/TR = 2.8/6.5 ms, TI = 450 ms, flip angle = 8 degrees. FOV = 24 cm, voxel size = 0.93*0.93*1.2 mm, and a 3D T2-weighted FLAIR sequence with TE/TR = 126/6000 ms, TI = 863, FOV = 24 cm, voxel size = 0.93*0.93*1.2 mm. Images were corrected for bias field and distortion.7 Then, correction for patient motion was carried out using in-house software. The pre- and post-contrast 3D IR-SPGR and FLAIR images were registered to each other using rigid body registration at each of the two time points. Volumes of interest (VOIs) within the FLAIR hyperintense region were segmented. The post processing and image enhancement steps were applied to the FLAIRVOL in order to extract the lesion surfaces and calculate the EC (see figure 1). We applied 3D analysis on the lesions to enhance the local precision and decrease the partial volume effect.8–11 The change in EC was defined as the difference in each parameter between the pre- and post-bevacizumab scans. Maximally Selected Rank Statistics (MSRS) were used to identify optimal cutoff points for post-EC values that stratified the patients according to PFS/OS. Cox proportional hazard models were generated to determine the relationship between EC and PFS/OS using age and the extent of surgical resection as covariates.Results
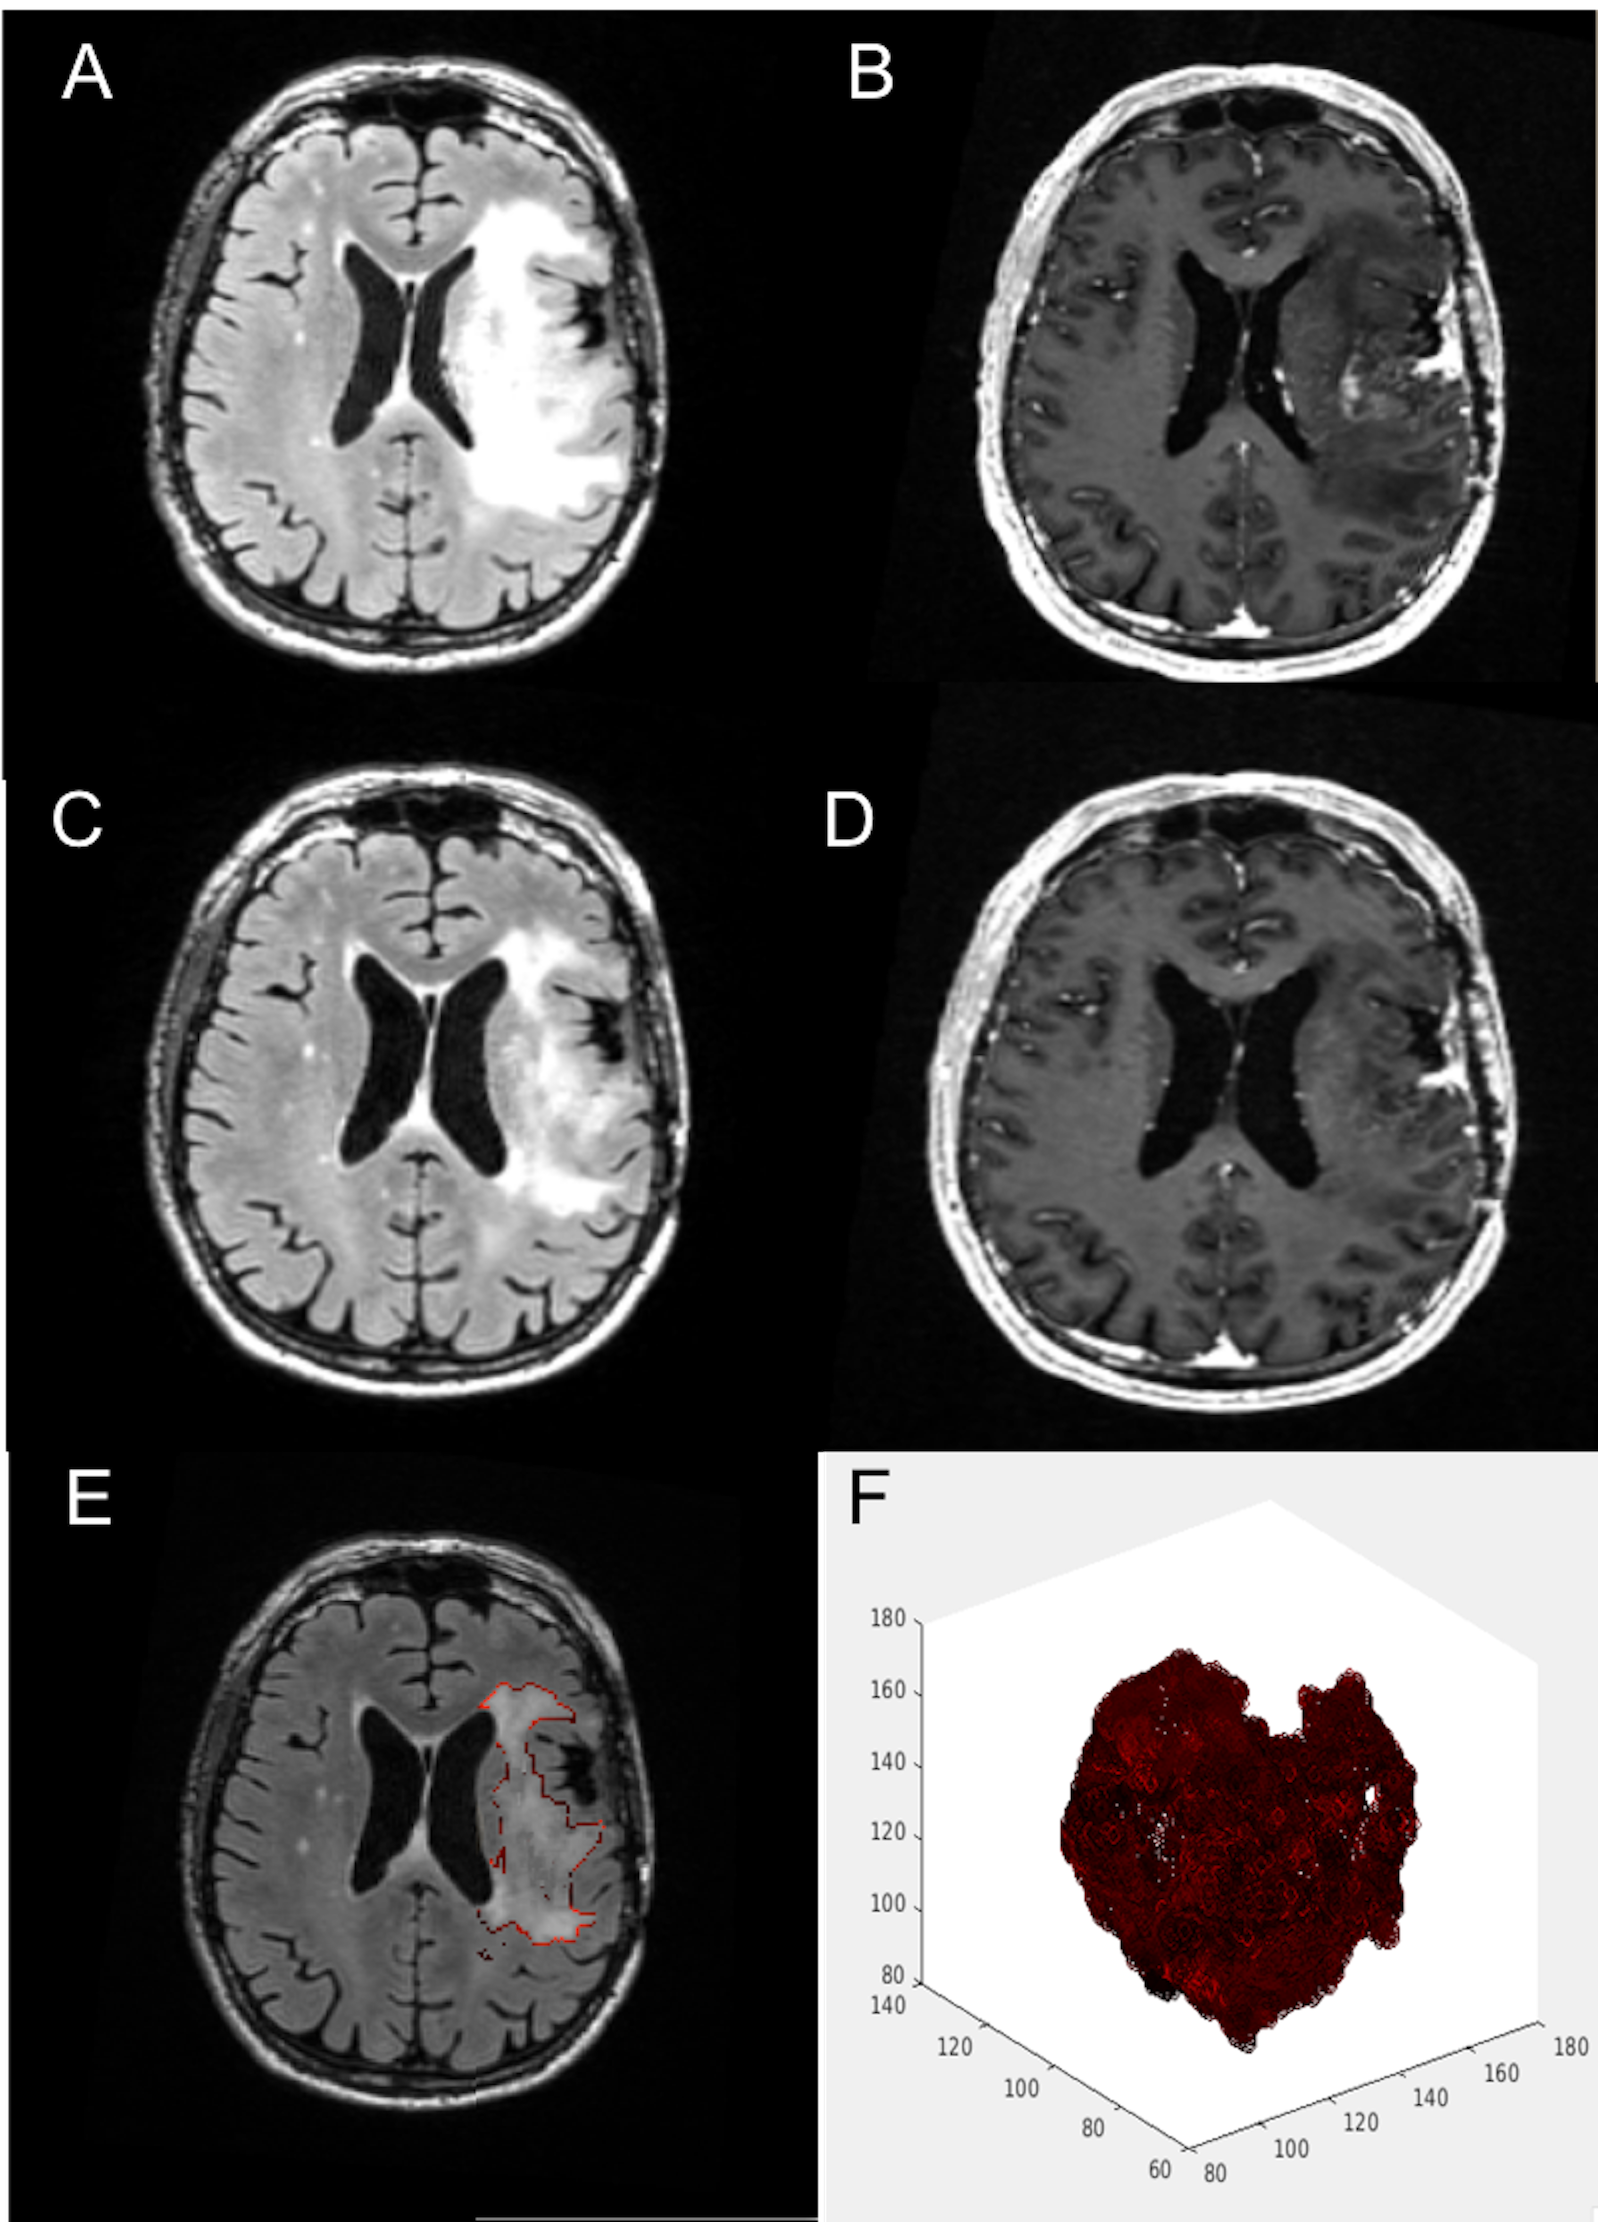
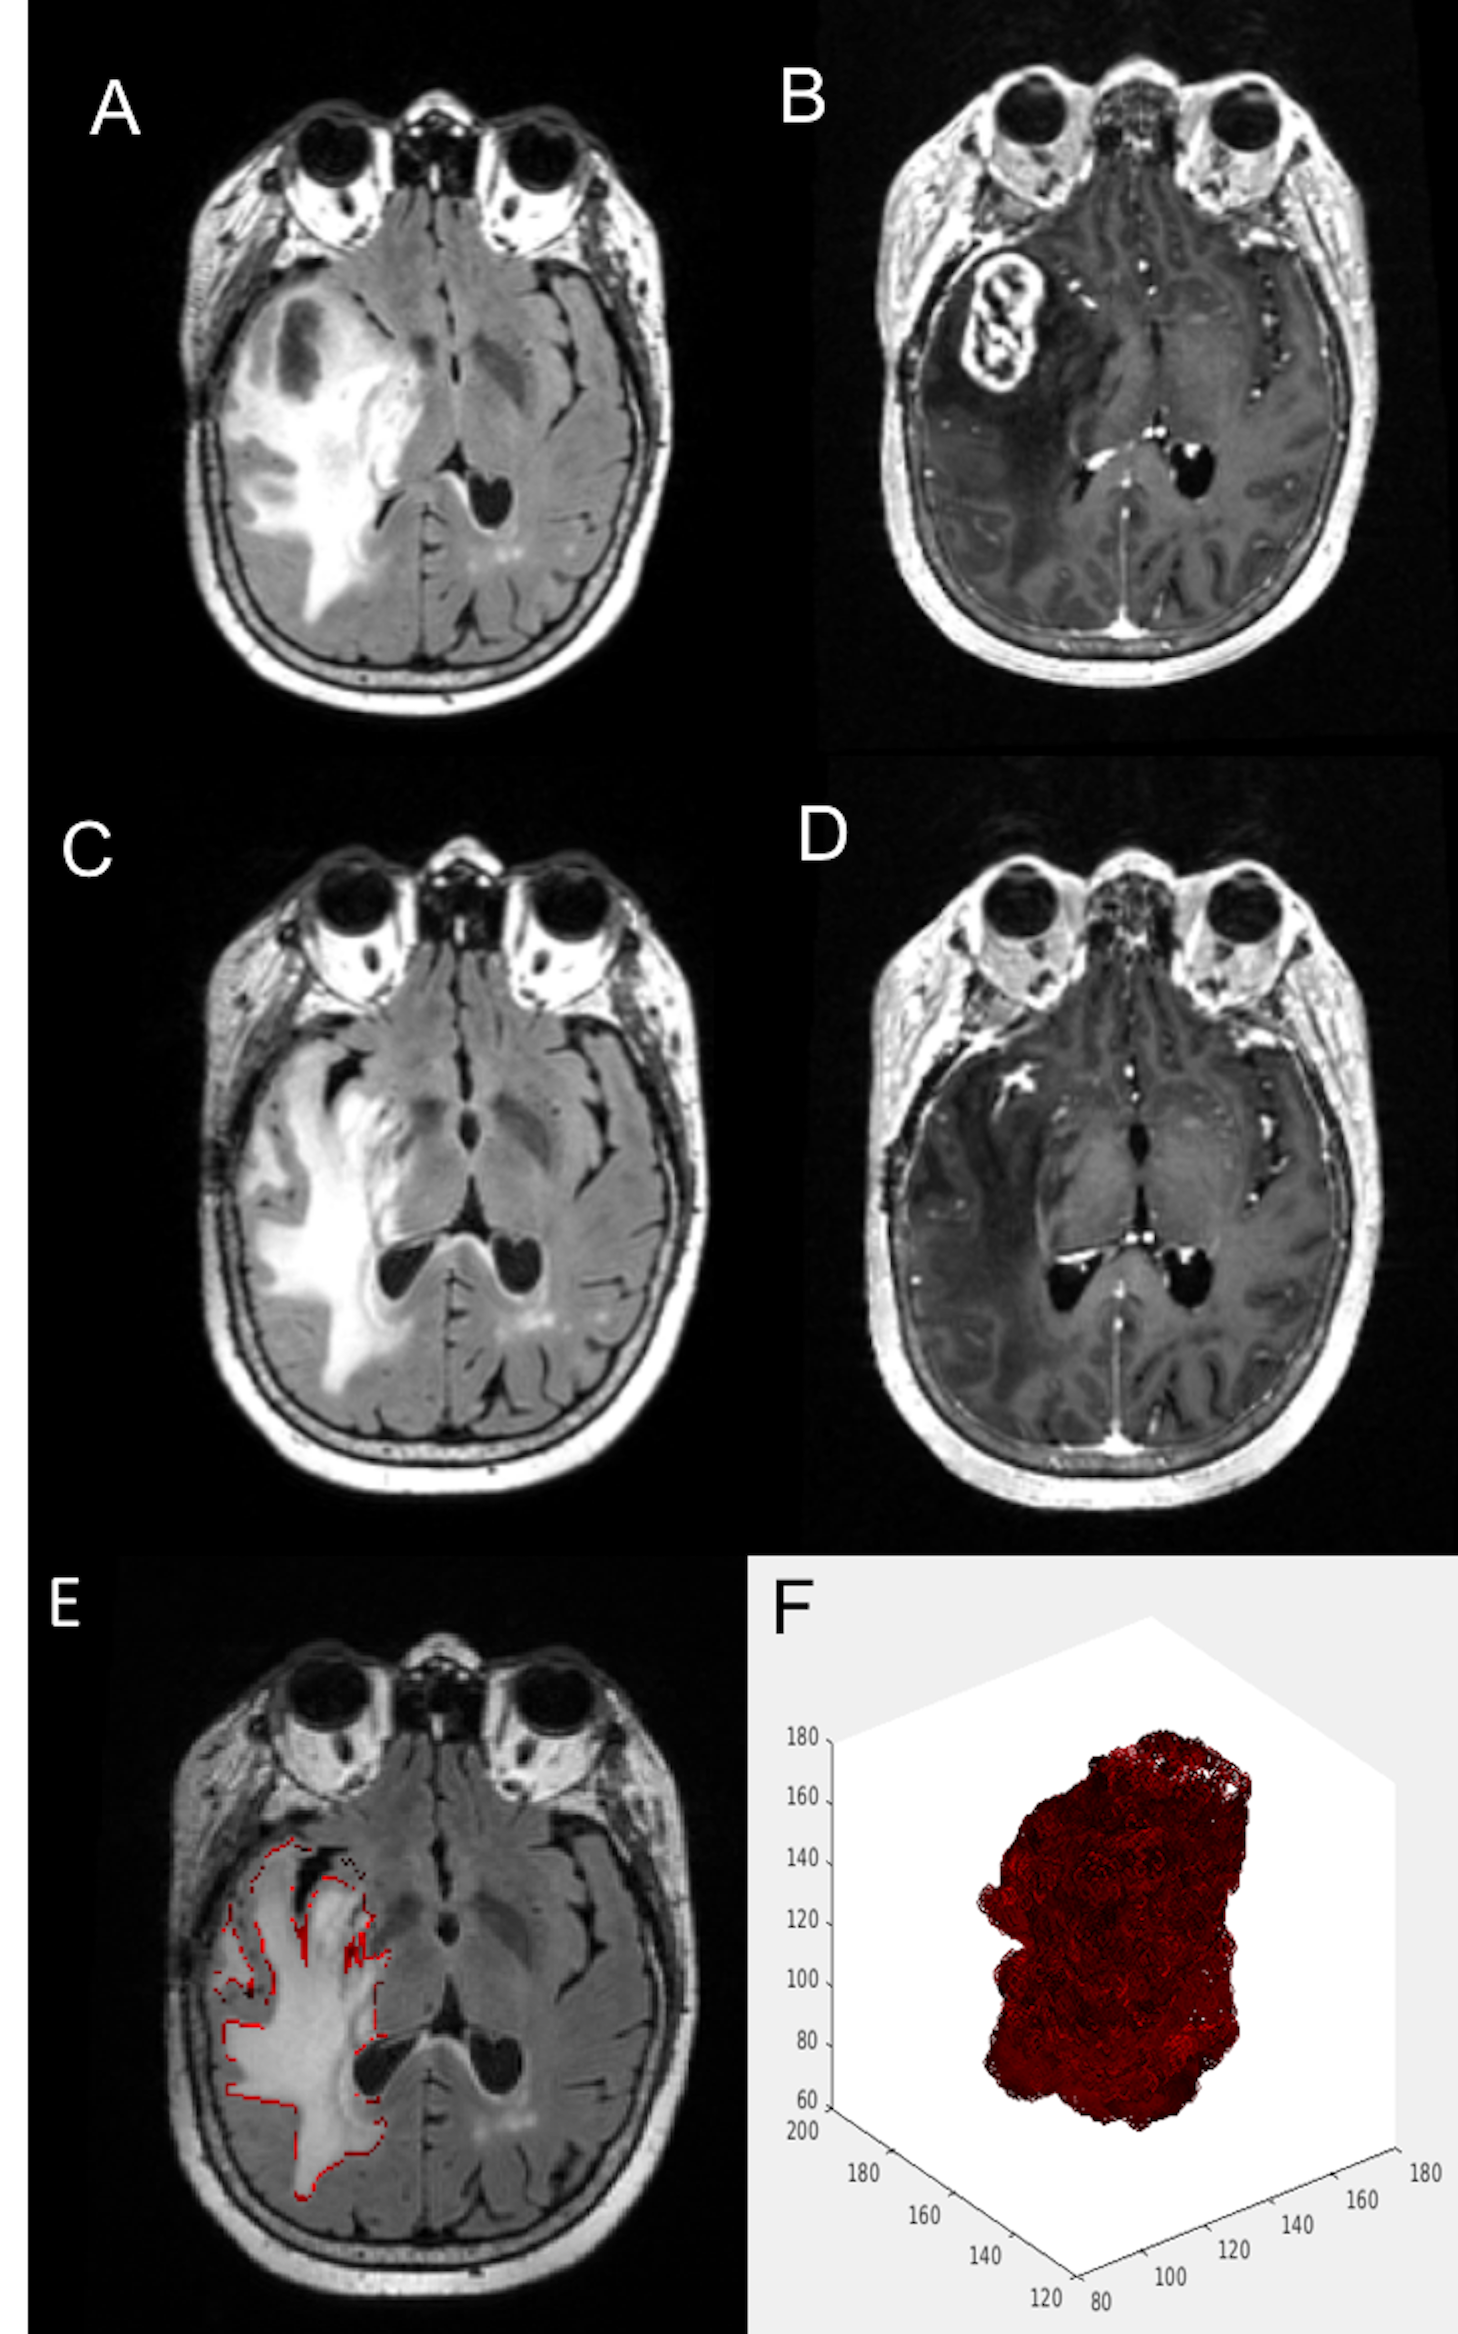
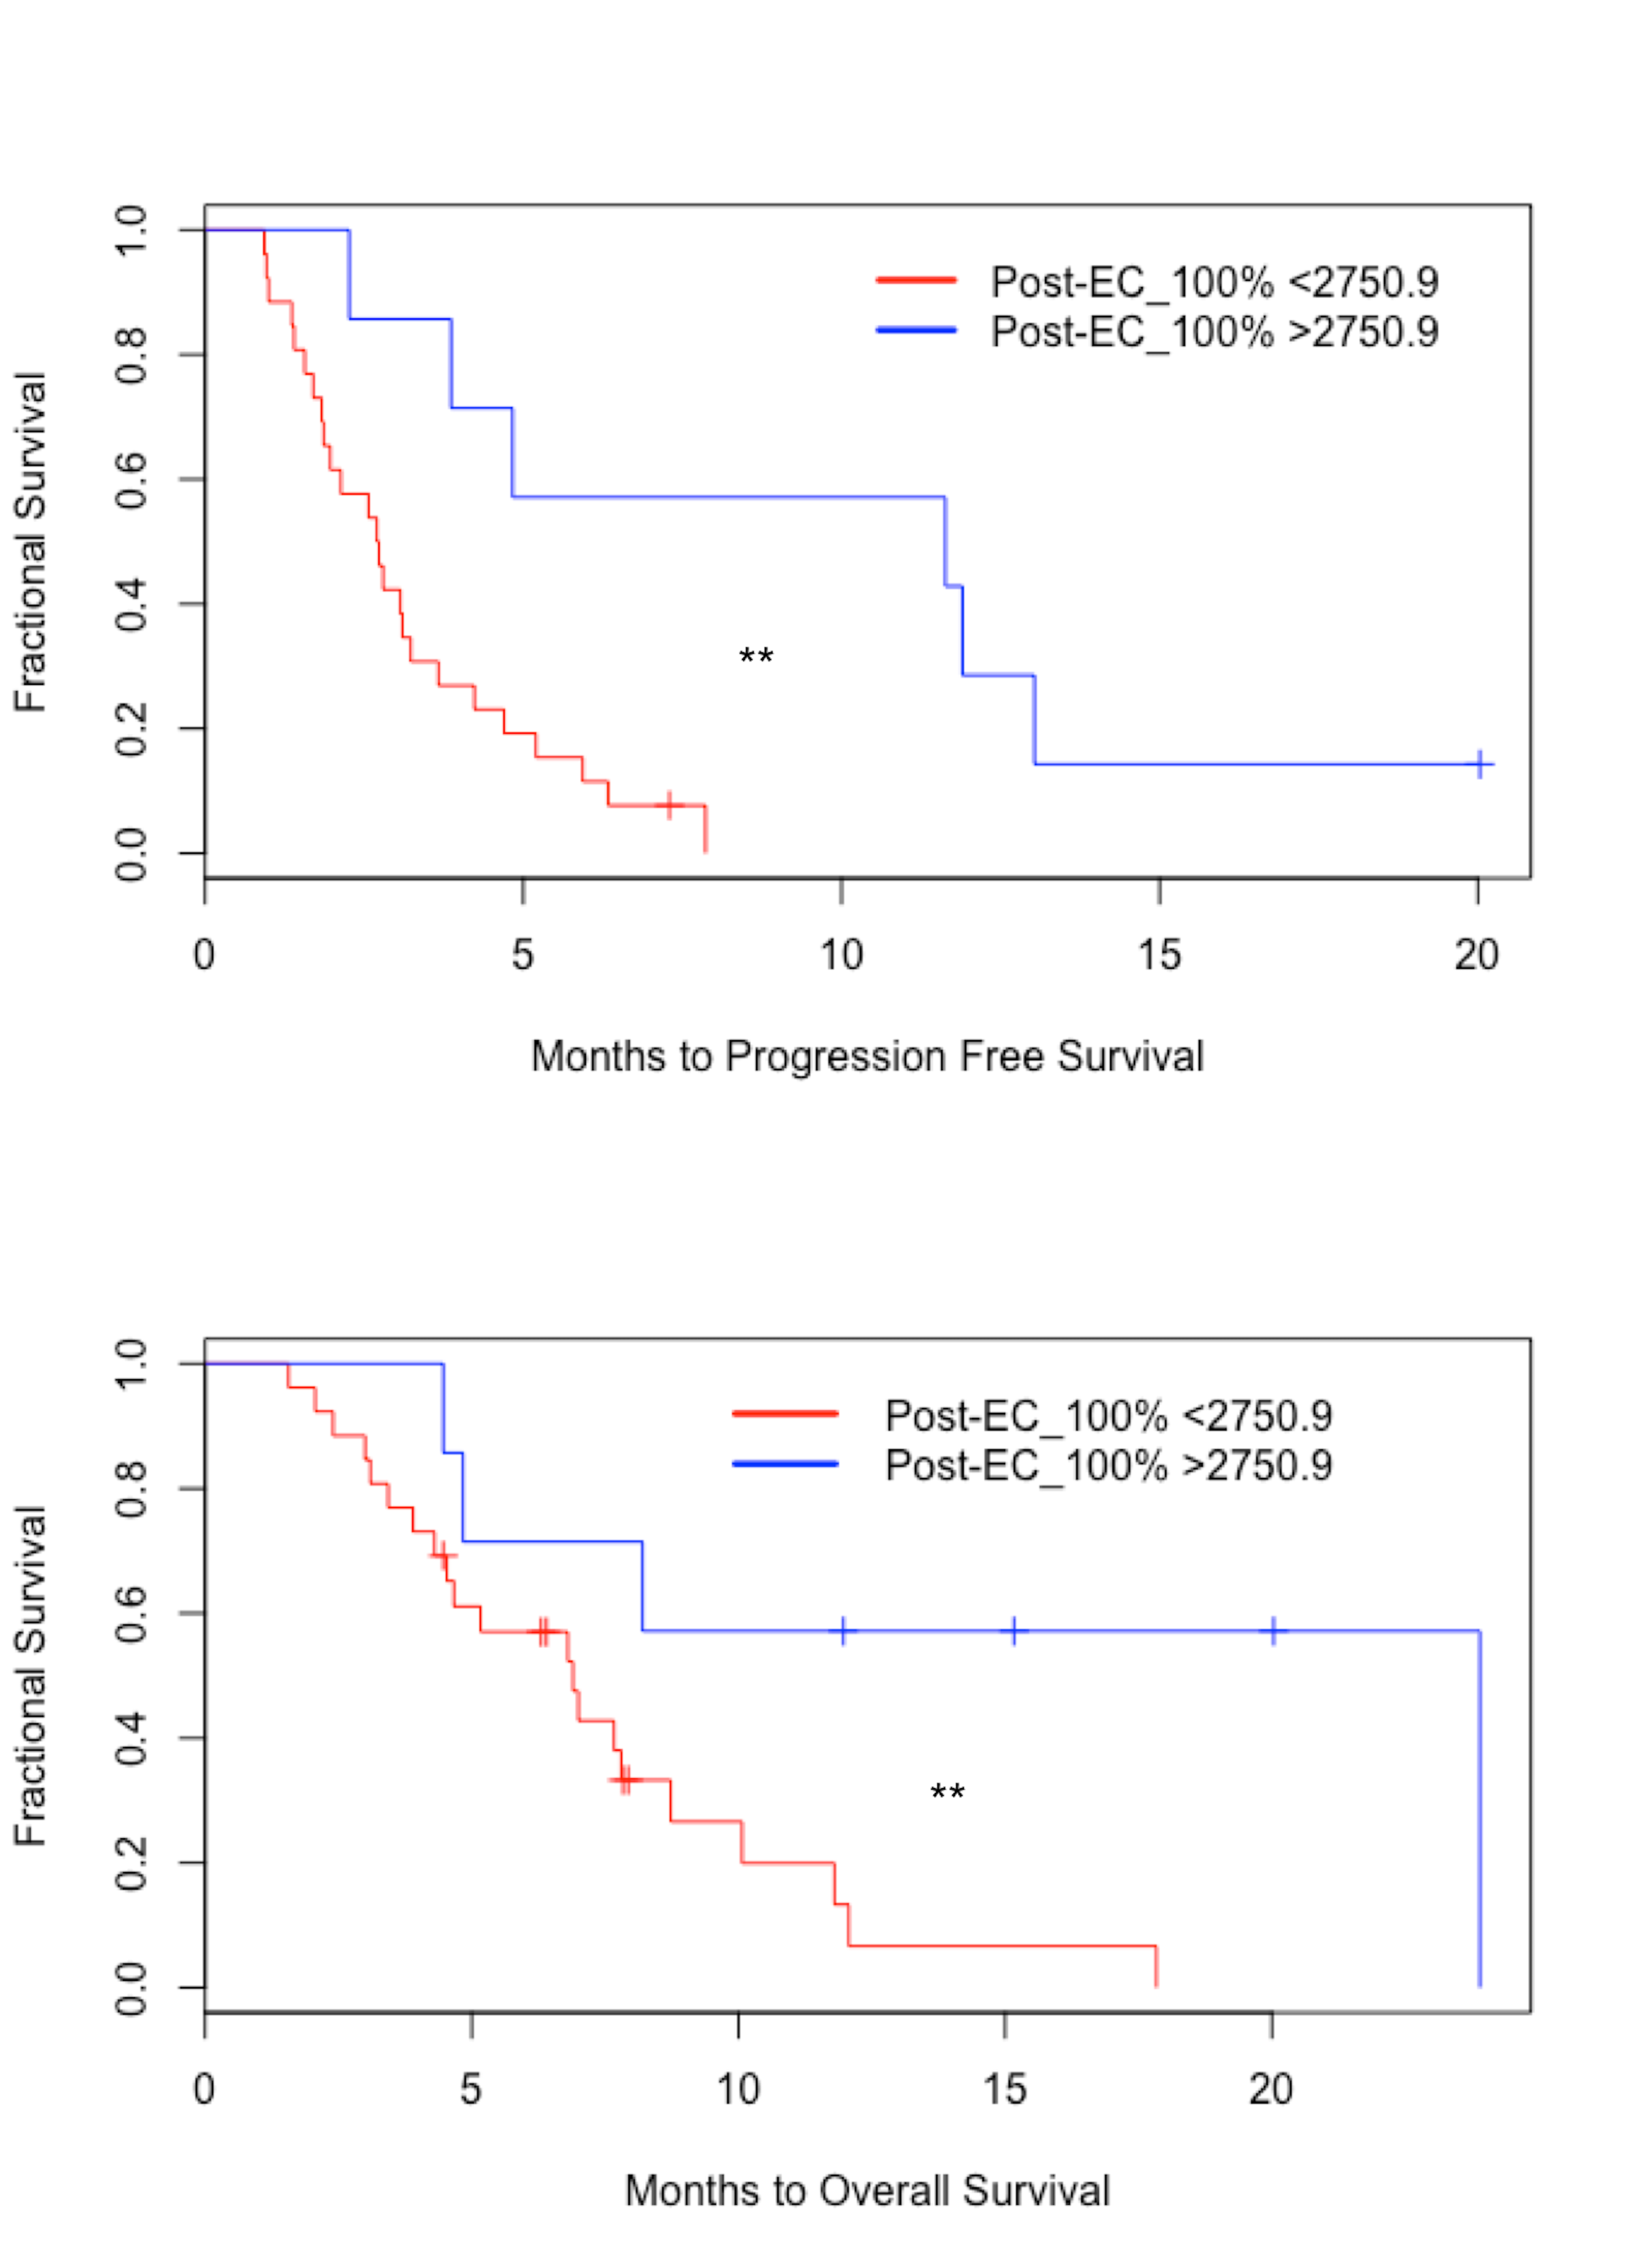
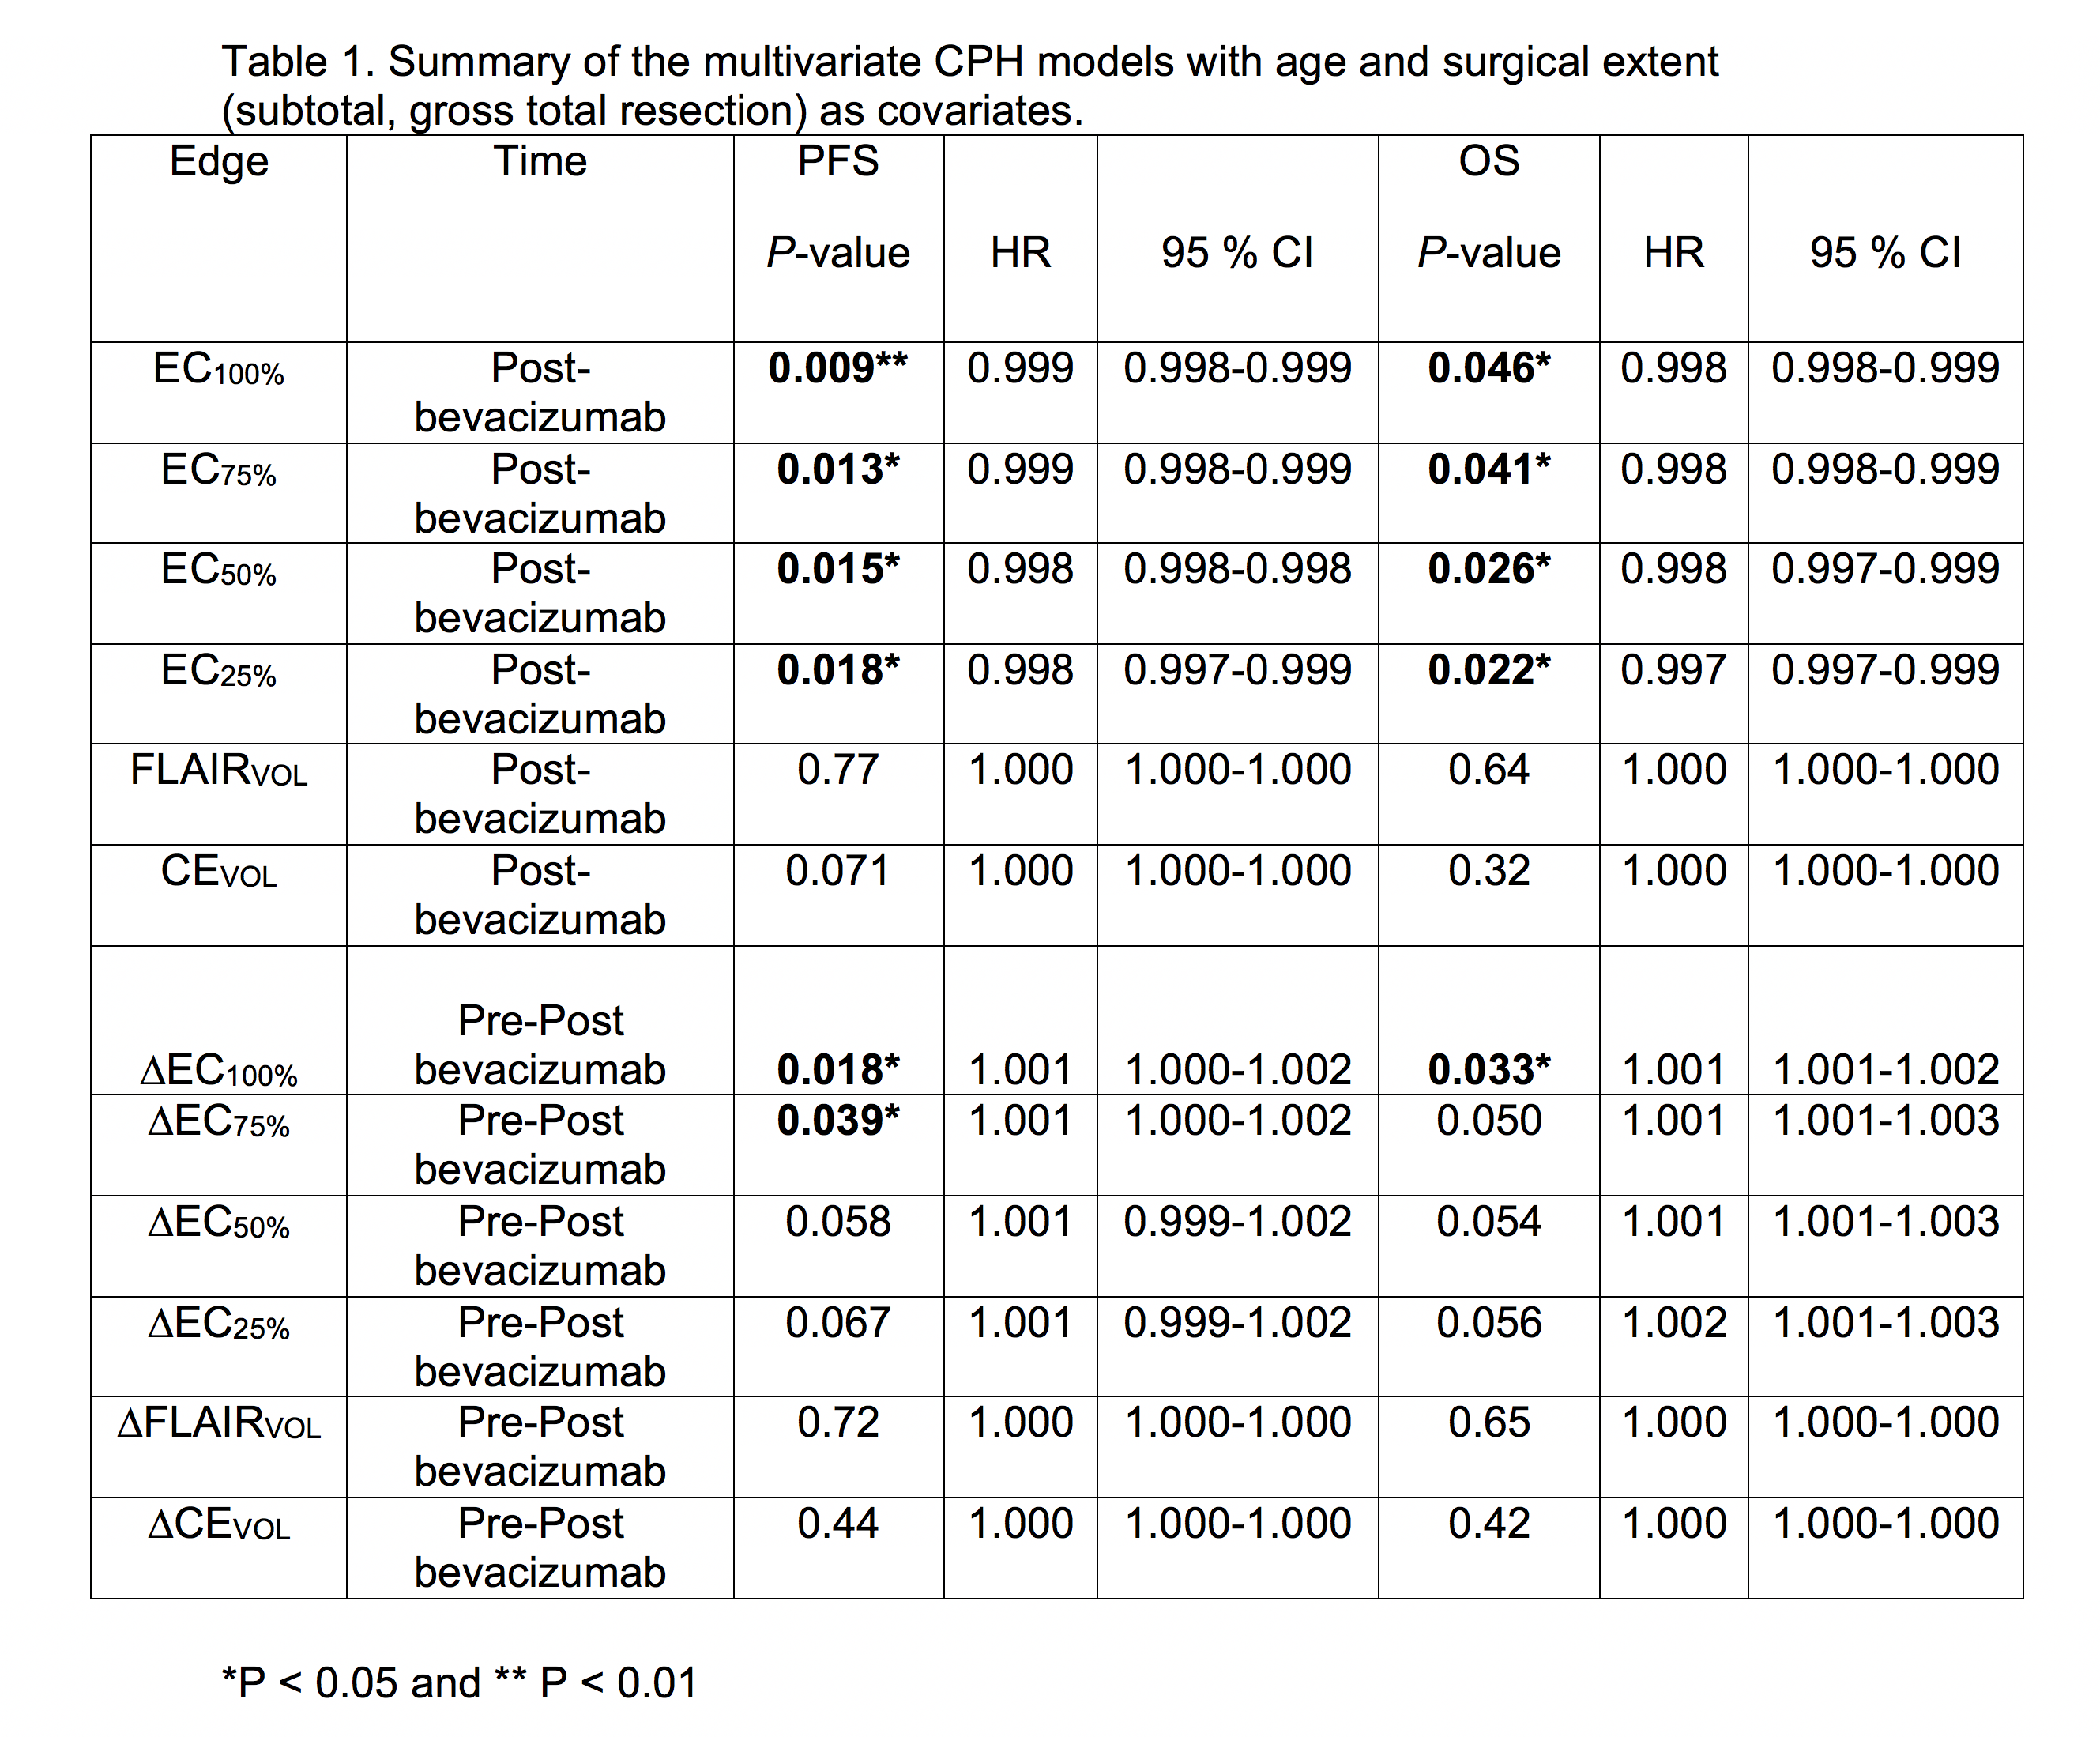
At the group level, there were no significant differences between pre- and post-bevacizumab EC parameters. There were no significant associations between change in any of the EC parameters and change in Volume of FLAIR (FLAIRVOL) or Volume of Contrast-enhanced (CEVOL) (all p-values > 0.05). After bevacizumab, lower EC of the FLAIR hyperintense region was associated with poorer PFS (p=0.009) and OS (p = 0.022) among HGG patients. Multivariate CPH models indicated that all EC thresholds (as describes in figure 1) post-bevacizumab and ∆EC100% and ∆EC75% pre to post bevacizumab were associated with poorer PFS, also all EC thresholds were associated with OS (see Table 1). Figure 2 shows an example of a patient with low EC and poor PFS/OS, whereas Figure 3 shows an example of a patient with high EC and good PFS/OS. A post-EC100% value of 2750.9 was determined to best stratify patients for PFS and OS. Kaplan-Meier survival curves revealed that the post-EC100% cutoff significantly separated the groups for PFS [log-rank χ2 (1) = 8.3, P = 0.003] (Fig 4A). Similarly, the post-EC100% cutoff significantly stratified the groups for OS [log-rank χ2 (1) = 5.5, P = 0.019]. Both analyses categorized 8 patients with better PFS/OS and 25 patients with poorer PFS/OS (Fig 4B).Discussion
In this study, we introduce a new, quantitative imaging technique for characterizing the FLAIR border in patients with HGG and highlight a clinical scenario in which it may have prognostic value. We demonstrate that patients with vague, ill-defined FLAIR borders (low EC) have poorer PFS and OS compared to patients with sharper FLAIR borders (high EC). These findings suggest that quantitative estimates of FLAIR border patterns may provide unique information that is complementary to the FLAIR and CE volumes and may serve as a more reliable biomarker for non-enhancing tumor progression in HGG patients following treatment with bevacizumab.Conclusion
Texture analysis using EC of the FLAIR hyperintense region may be an important predictive indicator in HGG patients following treatment with bevacizumab. Specifically, low FLAIR EC may reflect areas of tumor infiltration. This study adds to a growing body of literature proposing that quantifying features may be important for determining outcomes in patients with HGG.Acknowledgements
No acknowledgement found.References
1. Wen, P. Y. & Kesari, S. Malignant Gliomas in Adults. N. Engl. J. Med. 359, 492–507 (2008).
2. Wen, P. Y. et al. Updated Response Assessment Criteria for High-Grade Gliomas: Response Assessment in Neuro-Oncology Working Group. J. Clin. Oncol. 28, 1963–1972 (2010).
3. Chinot, O. L. et al. Response assessment criteria for glioblastoma: practical adaptation and implementation in clinical trials of antiangiogenic therapy. Curr. Neurol. Neurosci. Rep. 13, 347 (2013).
4. Macdonald, D. R., Cascino, T. L., Schold, S. C. & Cairncross, J. G. Response criteria for phase II studies of supratentorial malignant glioma. J. Clin. Oncol. Off. J. Am. Soc. Clin. Oncol. 8, 1277–1280 (1990).
5. Nowosielski, M. et al. Progression types after antiangiogenic therapy are related to outcome in recurrent glioblastoma. Neurology 82, 1684–1692 (2014).
6. Norden, A. D. et al. Bevacizumab for recurrent malignant gliomas Efficacy, toxicity, and patterns of recurrence. Neurology 70, 779–787 (2008).
7. Jovicich, J. et al. Reliability in multi-site structural MRI studies: effects of gradient non-linearity correction on phantom and human data. NeuroImage 30, 436–443 (2006).
8. Nachimuthu, D. S. & Baladhandapani, A. Multidimensional Texture Characterization: On Analysis for Brain Tumor Tissues Using MRS and MRI. J. Digit. Imaging 27, 496–506 (2014).
9. Li, X., Xia, H., Zhou, Z. & Tong, L. 3D texture analysis of hippocampus based on MR images in patients with alzheimer disease and mild cognitive impairment. in 2010 3rd International Conference on Biomedical Engineering and Informatics 1, 1–4 (2010).
10. Suoranta, S. et al. 3D Texture Analysis Reveals Imperceptible MRI Textural Alterations in the Thalamus and Putamen in Progressive Myoclonic Epilepsy Type 1, EPM1. PLOS ONE 8, e69905 (2013).
11. Zhang, J., Yu, C., Jiang, G., Liu, W. & Tong, L. 3D texture analysis on MRI images of Alzheimer’s disease. Brain Imaging Behav. 6, 61–69 (2012).
Figures