4852
High-resolution Deuterium MR Spectroscopic Imaging of the Warburg Effect in Brain TumorMing Lu1, Xiao-Hong Zhu1, Yi Zhang1, Walter Low2, and Wei Chen1
1Center for Magnetic Resonance Research, Department of Radiology, University of Minnesota, Minneapolis, MN, United States, 2Neurosurgery Department, University of Minnesota, Minneapolis, MN, United States
Synopsis
The best-known metabolic abnormality in brain cancer is the Warburg effect, which shifts the fuel consumption from oxidation towards glycolysis. Recently, we developed a novel in vivo Deuterium (2H) MR spectroscopic imaging (DMRSI) approach for simultaneously assessing brain glycolysis and oxidation at 16.4 T. In this study, we aimed to image the Warburg effect in a rat model with gliosarcoma using DMRSI with improved resolution. High-resolution quantitative image using the ratio of [lactate] to [glutamate/glutamine] showed a huge contrast between brain tumor and intact tissue and promise to study the decoupling relationship between glycolysis and oxidation in tumor.
Introduction
It is known that brain cancers are associated with altered glucose metabolisms, which has become a promising target for treatment in oncology. The best-known metabolic abnormality is the Warburg effect (1), which points to an increased glycolysis and inhibited oxidation even in the presence of oxygen. Through this way, tumor cells meet high energy demands to promote rapid cell growth and division (2, 3). Simultaneous measurements of cerebral glucose consumption rate (CMRglc) and TCA cycle flux (VTCA) are the key for understanding the abnormal metabolism and progression in tumor brain. Recently, we developed a novel in vivo Deuterium (2H) MR spectroscopic imaging (DMRSI) approach for noninvasively assessing glycolysis and oxidation in rat brains at ultrahigh field (4, 5). The excellent spectral quality at ultrahigh field allows DMRSI to quantify regional metabolites concentrations and metabolic rates (e.g. CMRglc and VTCA) concurrently. In this study, we aimed to image the Warburg effect using DMRSI in a rat model with gliosarcoma, which would lay a foundation for investigation of decoupling relationship between glycolysis and oxidation in brain tumor. By optimizing acquisition parameters of a previous study (5), spatial resolution and detection sensitivity of DMRSI were improved. Localized DMR spectra were acquired using 3D-chemical shift imaging (CSI) technique at 16.4 T. Metabolites signals from healthy and tumor rat brains were compared. High-resolution quantitative DMR image using [lactate] to [glutamate/glutamine] ratio ([Lac]/[Glx]) was generated.Method
Male Fischer 344 rats having an appropriate size of the grown gliosarcoma (GS-9L cells, Sigma-Aldirch) were anesthetized by 2% isoflurane. Their femoral arteries and veins were catheterized for blood sampling, physiological monitoring and deuterated glucose infusion. All MR experiments were conducted at 16.4 T/26 cm scanner (Varian/VNMRJ) using a passively decoupled 1H/2H surface coil. Multiple high-resolution 3D-2H CSI datasets of rat brains were acquired using Fourier series window technique with ~10 μL nominal voxel size (17x17x5 phase encodes) for about 15.8 min before and after the isotope tracer infusion (2-min i.v. infusion of 1.3 g/kg D-Glucose-6,6-d2, Sigma-Aldrich). A 20 Hz linebroadening was used before Fourier transformation to enhance spectral SNR. All resonance signals (deuterated water, glucose (Glc), Glx and Lac) were fitted using a MATLAB-based program, and the concentrations of metabolites were quantified as previously described (4). Saturation effects on metabolites were corrected for quantification. Through mapping the distributions of [Lac] and [Glx], high-resolution ratio image of [Lac]/[Glx] was produced following several data processing steps including interpolation and smoothing.Result
Figure 1 showed the anatomical and metabolic [Lac]/[Glx] ratio images of representative healthy rat brain (Fig. 1A) and a rat brain with growing gliosarcoma (Fig. 1B&C). Enlarged spectra from the indicated CSI voxels exhibited excellent spectral quality with four well-resolved resonances originated from 2H-water, Glc, Glx and Lac (bottom, Fig. 1A&B). Recognized grown tumor tissue was observed in Fig. 1B and localized DMR spectra obtained from the normal appearing (CON, the white box) and tumor (TUM, the black box) tissues at similar post-infusion time as that of Fig. 1A were displayed. Increased Lac accumulation was only detected in the TUM area of the tumor brain, whereas accelerated glucose consumption was observed in both of the CON and TUM regions within the tumor brain when comparing to that in the healthy rat brain. Figure 1C illustrated a high-resolution ratio image of [Lac]/[Glx] with several folds of increase of the [Lac]/[Glx] ratio in the core area of TUM tissue, which overlapped with the corresponding lesion region observed from the anatomical image (contoured by dotted lines in Fig. 1B&C) and indicated a huge metabolic shift as the Warburg effect.Discussion & Conclusion
As expected, due to the Warburg effect, a heterogeneous [Lac]/[Glx] ratio image was observed indicating a dramatic shift of the fuel consumption towards glycolysis rather than the oxidative phosphorylation (1, 6). Further studies, such as evaluating the correlation between CMRglc/VTCA and [Lac]/[Glx] ratio images, should be performed to examine the reliability and utility of using [Lac]/[Glx] ratio as an indicator of the glycolysis/oxidation decoupling level in tumor brain. In summary, this pilot study demonstrates the feasibility and sensitivity of using in vivo DMRSI approach to image the Warburg effect with high spatial resolution in the rat brain at ultrahigh field. It provides an opportunity for simultaneous studying altered glycolysis and glucose oxidation in animal and human brains under physiopathological conditions. This technique is particularly useful for monitoring tumor progression and treatment efficacy with improved specificity associated with cancer metabolism and biology.Acknowledgements
NIH Grants: R01 NS41262, NS57560, NS70839, MH111447, R24 MH106049, P41 EB015894, P30 NS076408, S10 RR025031 and Keck foundation.References
(1) Warburg O. (1956) Science, 123(3191): 309-314. (2) DeBerardinis R.J. et al. (2008) Cell Metab., 7(1): 11-20. (3) Heiden M. et al. (2009) Science 324(5930): 1029-1033. (4) Lu, M. et al. (2017) J Creb Blood Flow Metab., PMID: 28503999. (5) Lu, M. et al. (2015) ISMRM: 4719. (6) Marie, S. et al. (2011) Clinics, 66: 33-43.Figures
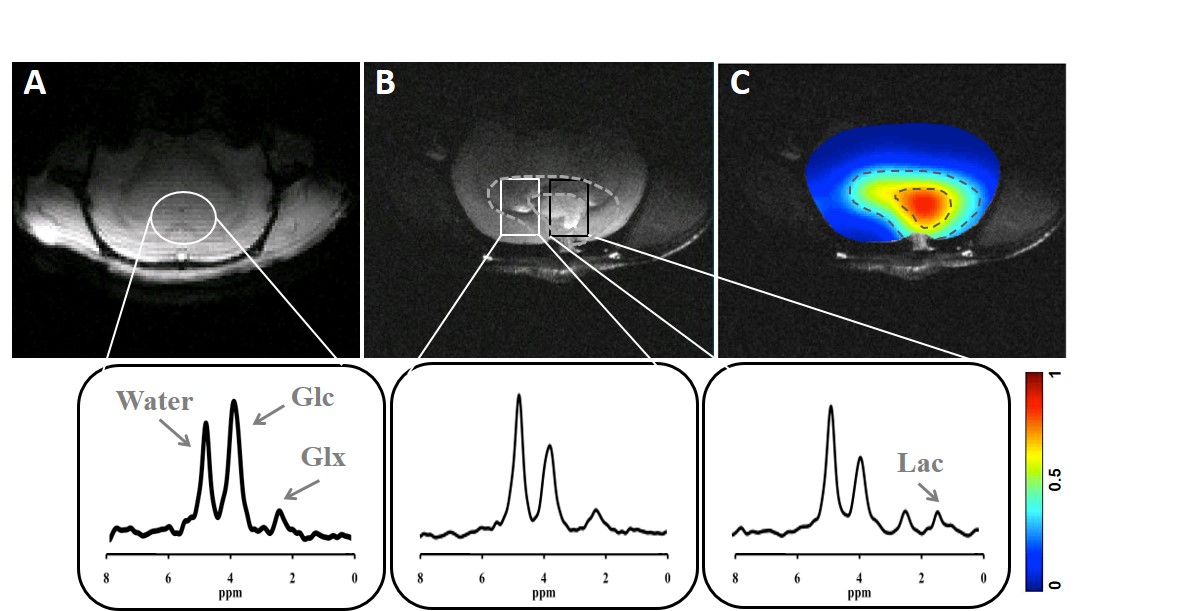
Figure 1. Anatomical images and localized DMR spectra extracted from the indicated
CSI voxels of a representative healthy rat brain (A), and from the normal
appearing and tumor tissues (white and black boxes, respectively) of a
representative rat brain with gliosarcoma (B). Panel (C) displayed a
high-resolution ratio image of [Lac]/[Glx] overlaid on the corresponding
anatomical image showed in (B). The brain regions demonstrating abnormal
metabolisms and lesions were contoured with dotted lines. All metabolic data
shown herein were obtained at similar post-infusion time ((A) at ~38 min
post-infusion; (B) and (C) at from 24 to 40 min post-infusion).