4851
The Influence of Heterogenous Subregions on Predicting MGMT Methylation Status of Glioblastomas: A Radiomics Analysis on Multimodal MRI1Radiology, Tangdu Hospital, the Fourth Military Medical University, Xi'an, China, 2Biomedical Engineering, the Fourth Military Medical University, Xi'an, China
Synopsis
MGMT promoter methylation is associated with longer survival and better treatment response of GBM patients. Intratumor heterogeneity is partly responsible for inaccurate detection of MGMT status. Therefore, assessing the effect of different heterogenous subregion of GBM on MGMT status would be critical. In this study, a radiomics approach integrated optimal features of heterogenous subregions in multimodal MRI and machine learning model was proposed for effectively predicting MGMT methylation, and meanwhile assessing the prediction efficiency of subregions or subregion combinations. The proposed approach achieved a promising MGMT methylation detection performance and indicated that rNEC may play a role in this issue.
Introduction
Glioblastomas (GBMs) are the most common primary brain tumors with a dismal outcome(1, 2) and O6-methylguanine methyltransferase (MGMT) promoter methylation is associated with longer survival and better response to temozolomide(3). However, MGMT methylation detection would be influenced by intratumor heterogeneity of GBM. Noninvasively assessing the influence of heterogeneity on MGMT methylation detection is critical for GBM patients.
Currently, the magnetic resonance imaging (MRI) has served as a noninvasive tool for intratumor heterogeneity analysis of GBMs because it occurred at the molecular level and can be macroscopically reflected by different phenotypes in MRI(5). The phenotypes were commonly identified as the region of contrast-enhancing tumor (rCET), necrosis (rNec) and edema/non contrast-enhancing (rE/nCET). However, few studies focused on the influence of different subregions on MGMT status assessment. Therefore, it is necessary to establish a novel approach to accurately predict MGMT methylation status and evaluate the influence of different subregions on this issue.
In this study, we aimed to use high throughput radiomics features from each subregion in multimodal MRI and machine learning methods to stratify MGMT methylated and unmethylated groups, and meanwhile, to evaluate the influence of each subregion or subregion combination.
Methods
Patient selection
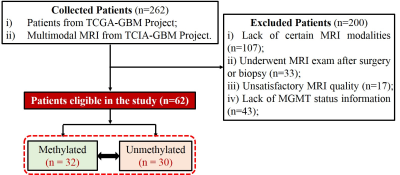
As depicted in Fig. 1, a total of 62 GBM patients retrospectively enrolled. Among them, 32 were MGMT methylated, and 30 were unmethylated.
Image data preprocessing and radiomics feature extraction
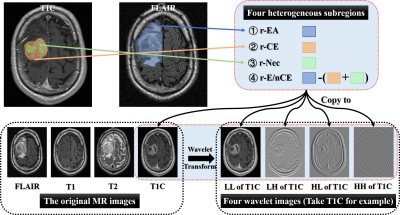
Each patient’s T1-weighted images (T1WI) before and after contrast-enhanced (T1C), T2-weighted (T2WI) and fluid-attenuation inversion recovery (FLAIR) images were collected. Modality registration was performed using the rigid transformation and mutual information. All the images were normalized using Collewet algorithm(6). To extract high throughput features, both original and corresponding filtered MRI images after wavelet transform were obtained.
Then, four heterogenous subregions were manually drawn: (1) the region of entire abnormality (rEA) on FLAIR image, (2) rCET and (3) rNec on T1C. In addition, (4) rE/nCET acquired by rEA subtracting the union of rCET and rNec, as Fig. 2 shown. A total of 4000 radiomics features were finally extracted (4 modalities×5 images×4 subregions×50 texture and histogram features), as previous studies applied (7-10).
Feature Selection and Classification
For each classification task, the SVM-RFE method(11) was used to find the optimal feature subsets. Based on these, MGMT methylation detection models were establishment using SVM classifiers(12). The accuracy and area under the curve (AUC) were calculated to evaluate the performance.
Statistical analysis
The Mann-Whitney U test, Chi-square test was applied on clinical characteristics to verify whether significant inter-group differences exist.
Results
Among 62 enrolled patients, 32 and 30 belonged to MGMT methylated and unmethylated groups respectively. Besides the overall survival (P <0.05), there were no significant intragroup differences of clinical characteristics.
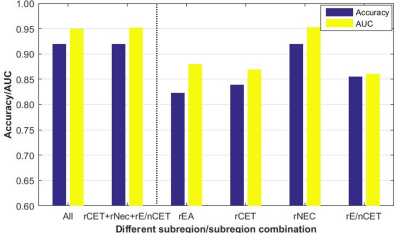
Fig. 3 shows the efficiency of MGMT status assessment using optimal radiomics features from single subregion or subregion combination. The efficiency of rNEC was outstanding for MGMT methylated detection, with accuracy=91.94% and AUC=0.9531. However, there was an extremely small difference between the four-subregion (91.94% and 0.950) and the three-subregion combination (91.94% and 0.9521). No performance improvement was found when adding other single subregions besides of rNEC.
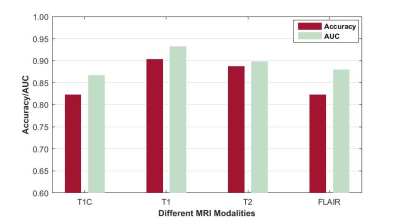
Fig. 4 shows the efficiency of MGMT status assessment using optimal radiomics features from different MRI modalities. The best accuracy and AUC were achieved when using T1 images (90.32%, and 0.9323).
Discussion
In this study, the proposed approach integrated optimal features and machine learning methods showed promising performance on MGMT methylation detection of GBM patients. Meanwhile, different subregions in multimodal MRI had different efficiency for MGMT status assessment.
Theoretically, each heterogenous subregion may contain specific microenvironment information. However, they did not complement each other for MGMT status assessment in this study. There was no improvement when adding other subregions besides of rNEC. The detection model using only rNEC reached the best performance. Therefore, rNEC was verified to be a key component of GBM for MGMT status assessment in this study.
For intratumor heterogeneity of GBMs, it was critical to determine which regions/volumes were extracted for further analysis. In most of previous GBM-related MRI studies, researchers used to focus on the rCET to investigate its potential to grading or survival prediction. Others indicated that the edema or non-enhancing region may better reflect the characteristics of GBMs. When delineating regions/volumes for further analysis, radiologists preferred to draw the active tumor region and avoid the necrosis and cystic sometimes. It now appears that rNEC may play a role in MGMT methylation assessment.
Conclusion
A radiomics approach integrated optimal features of heterogenous subregions in multimodal MRI and machine learning model was proposed for assessing MGMT status of GBM patients. The proposed approach achieved a promising performance and indicated that rNEC may play a role in MGMT methylation assessment.Acknowledgements
This study received financial support from the Natural Science Foundation of Shaanxi Province (No. 2008K13-04 to Dr. Cui GB), Science and Technology Development of Shaanxi Province (No. 2014JZ2-007 to Dr. Cui GB).References
1. Van Meir EG, Hadjipanayis CG, Norden AD, Shu HK, Wen PY, Olson JJ. Exciting new advances in neuro-oncology: the avenue to a cure for malignant glioma. CA: a cancer journal for clinicians. 2010;60(3):166-93. doi: 10.3322/caac.20069. PubMed PMID: 20445000; PubMed Central PMCID: PMCPMC2888474. 2. Ostrom QT, Gittleman H, Stetson L, Virk SM, Barnholtz-Sloan JS. Epidemiology of gliomas. Cancer Treat Res. 2015;163:1-14. doi: 10.1007/978-3-319-12048-5_1. PubMed PMID: 25468222. 3. Aldape K, Zadeh G, Mansouri S, Reifenberger G, von Deimling A. Glioblastoma: pathology, molecular mechanisms and markers. Acta Neuropathol. 2015;129(6):829-48. doi: 10.1007/s00401-015-1432-1. PubMed PMID: 25943888. 4. Sottoriva A, Spiteri I, Piccirillo SG, Touloumis A, Collins VP, Marioni JC, et al. Intratumor heterogeneity in human glioblastoma reflects cancer evolutionary dynamics. Proceedings of the National Academy of Sciences of the United States of America. 2013;110(10):4009-14. doi: 10.1073/pnas.1219747110. PubMed PMID: 23412337; PubMed Central PMCID: PMCPMC3593922. 5. O'Connor JP, Rose CJ, Waterton JC, Carano RA, Parker GJ, Jackson A. Imaging intratumor heterogeneity: role in therapy response, resistance, and clinical outcome. Clin Cancer Res. 2015;21(2):249-57. doi: 10.1158/1078-0432.CCR-14-0990. PubMed PMID: 25421725; PubMed Central PMCID: PMCPMC4688961. 6. Collewet G, Strzelecki M, Mariette F. Influence of MRI acquisition protocols and image intensity normalization methods on texture classification. Magnetic resonance imaging. 2004;22(1):81-91. doi: 10.1016/j.mri.2003.09.001. PubMed PMID: 14972397. 7. Haralick RM, Shanmugam K, Dinstein IH. Textural Features for Image Classification. Systems Man & Cybernetics IEEE Transactions on. 1973;smc-3(6):610-21. 8. Galloway MM. Texture analysis using gray level run lengths. Computer Graphics & Image Processing. 1975;4(2):172-9. 9. Yu J, Shi Z, Lian Y, Li Z, Liu T, Gao Y, et al. Noninvasive IDH1 mutation estimation based on a quantitative radiomics approach for grade II glioma. European radiology. 2017;27(8):3509-22. doi: 10.1007/s00330-016-4653-3. PubMed PMID: 28004160. 10. Zhang B, Chang K, Ramkissoon S, Tanguturi S, Bi WL, Reardon DA, et al. Multimodal MRI features predict isocitrate dehydrogenase genotype in high-grade gliomas. Neuro Oncol. 2016. doi: 10.1093/neuonc/now121. PubMed PMID: 27353503. 11. Rakotomamonjy A. Variable selection using svm based criteria. Journal of Machine Learning Research. 2003;3(7-8):1357-70. 12. Chang CC, Lin CJ. LIBSVM: A library for support vector machines. Acm Transactions on Intelligent Systems & Technology. 2007;2(3, article 27):389-96.Figures


