4850
Amide proton transfer-weighted imaging of glioblastoma and metastatic brain tumor: histogram analysis in enhancing tumors and peritumoral regions1Radiology, Kagoshima University Graduate School of Medical and Dental Sciences, Kagoshima, Japan, 2Neurosurgery, Kagoshima University Graduate School of Medical and Dental Sciences, Kagoshima, Japan, 3Clinical engineering department radiation section, department radiation section, Kagoshima, Japan, 4Philips Japan, Tokyo, Japan, 5Philips GmbH Innovative Technologies Research Laboratories, Aachen, Germany
Synopsis
To determine whether amide proton transfer-weighted imaging (APTWi) is useful for distinguishing glioblastomas (GBMs) from metastatic brain tumors (Mets), we compared APT-related signal intensity (APTSI) between the two tumor types in the areas of enhancing tumor and peritumoral high signal intensity areas (PHAs) using histogram analysis. In the enhancing tumor, the mean and 90,75,50,25 and 10 percentiles of APTSI histogram were significantly higher in GBMs than in Mets, whereas no APTSI histogram parameters in PHA showed significant difference between GBMs and Mets. APTSI in the areas of enhancing tumor, not in PHA is useful for differentiation between GBMs and Mets.
INTRODUCTION
Amide proton transfer-weighted imaging (APTWi) is an emerging molecular MRI technique to detect endogenous mobile proteins and peptides.1 To determine whether APTWi is useful for distinguishing glioblastomas (GBMs) from metastatic brain tumors (Mets), we compared APT-related signal intensity (APTSI) between the two tumor types in the areas of enhancing tumor and in the surrounding non-enhancing areas with T2-prolongation (peritumoral high signal intensity areas, PHAs) using histogram analysis.METHODS
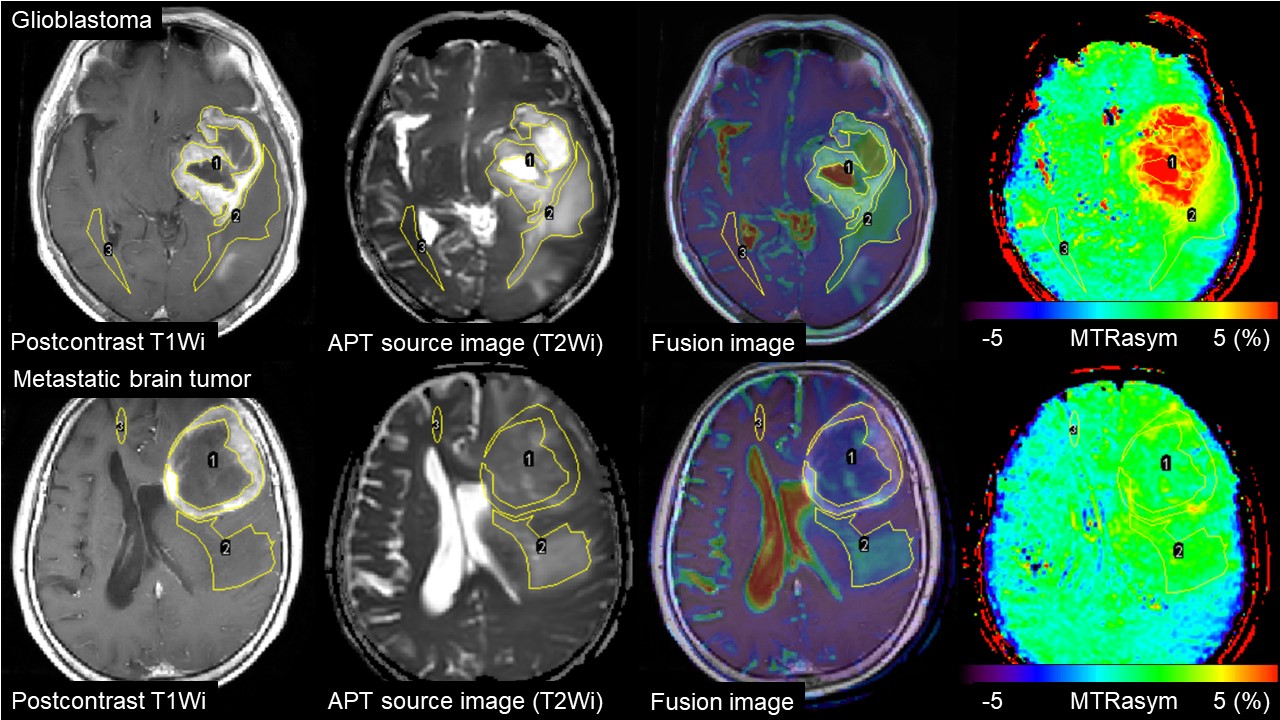
We examined 24 patients with GBM (mean age, 67.3±15.3 years) and 18 patients with Met (66.2±8.9 years). All tumors were histopathologically confirmed. MR imaging was performed using a 3.0 Tesla clinical scanner equipped with dual source parallel radiofrequency transmission system and a 15-channel head coil for signal reception. APTWi based on 2-dimensional single slice single-shot turbo spin-echo technique was performed: TR, 4550 ms; TE, 4.8 ms; flip angle, 90˚; turbo factor 128; number of signal averaging, 1; field of view, 230 × 230 mm2; imaging matrix, 128 ×128 (reconstructed in 256 × 256); slice thickness, 5 mm. A quasi-continuous saturation pulse with an amplitude of 2μT and a duration of 2 s (40 × 50 ms, sinc-gaussian elements) was applied at 27 offset frequencies including 24 ranging from +6 to -6 ppm with a step of 0.5 ppm and 2 at ±9.6 ppm as well as one far off-resonance frequency (-1560 ppm) for signal normalization. δB0 maps were acquired for a voxel-by-voxel δB0 correction. APTSI was defined as magnetization transfer ratio asymmetry at 3.5 ppm. For each tumor, areas of enhancing tumor and PHA were manually segmented using fusion images of the post-contrast T1-weighted and APT source images, and an additional ROI was placed in the contralateral normal appearing white matter (NAWM) (Figure 1). The mean APTSIs were compared among the enhancing tumors, PHAs and NAWM within each tumor type using the analysis of variance followed by Tukey Kramer post-hoc analyses (adjusted P<0.05). Furthermore, we performed histogram analyses to measure the mean and APT 90th, 75th, 50th, 25th, 10th-percentiles (APT90, 75, 50, 25, 10), skewness and kurtosis in the enhancing tumors and in PHA for each tumor. The histogram parameters were compared between GBMs and Mets using the Student's t-test (P<0.05).RESULTS
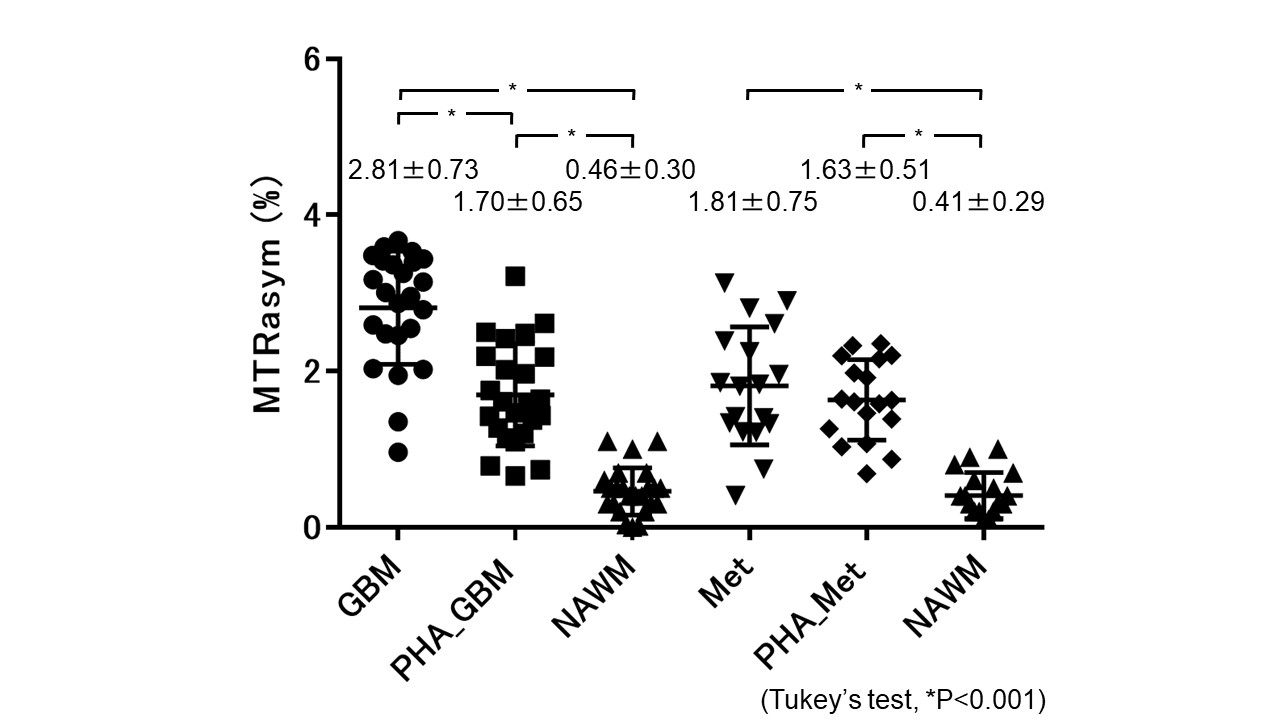
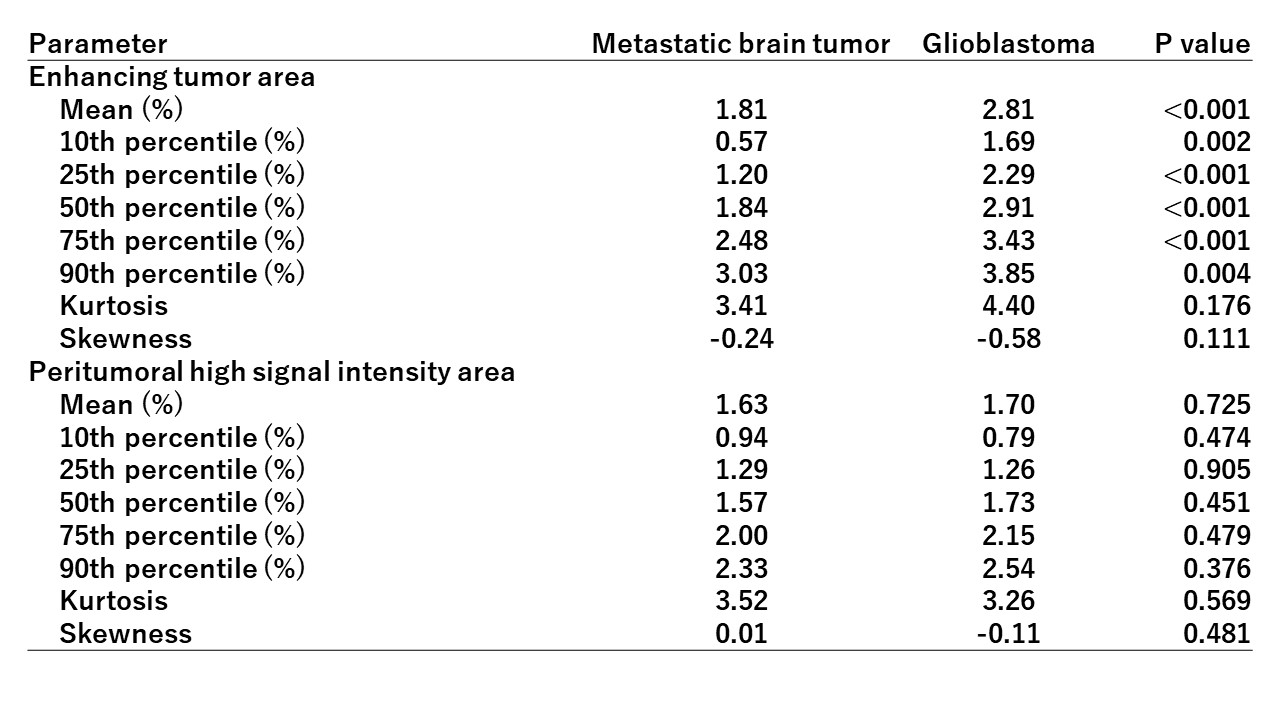
Figure 2 shows the comparisons of APTSI in the three ROIs within each tumor type. In GBMs, the mean APTSI in the enhancing tumors (2.81±0.73%) was the highest, followed by that in PHAs (1.70±0.65%) and NAWM (0.46±0.30%). A significant difference was shown in each pairwise comparison (P<0.001, respectively). In Mets, the mean APTSI in the enhancing tumor (1.81±0.75%) and PHAs (1.63±0.51%) were significantly higher than that in NAWM (0.41±0.29%)(P<0.001), whereas no significant difference was found between enhancing tumors and PHAs. Table 1 shows the comparisons of the APTSI histogram parameters between GBMs and Mets. The mean and APT90,75,50,25,10 in the enhancing tumors of GBMs were significantly higher than those of Mets. However, no significant difference was found between GBMs and Mets in any histogram parameters for PHA.DISCUSSION
APTWi has emerged as a valuable tool for grading brain tumors, for distinguishing tumors recurrence from radiation necrosis, for distinguishing pseudo-progression from true progression in gliomas.2-5 In our study, the mean and APT90,75,50,25,10 in the enhancing tumors of GBMs were significantly higher than those of Mets. These findings suggest that APTSI in the areas of enhancing tumor is useful imaging marker for differentiation between GBMs and Mets. On the other hand, regarding PHA, no significant difference was found in any APTSI histogram parameters between GBMs and Mets. The high APTSI in the enhancing tumor of GBMs may be attributable to increased protein and peptide concentration due to high cellular density as previously noted.2,3 The PHA in GBM, which may include both invasion of tumor cells and vasogenic edema showed higher APTSI than NAWM. It is of note that PHA of Mets showed significantly higher APTSI than NAWM. Since no tumor invasion is expected in PHA of Mets, this finding suggests that simple peritumoral edema can show increased APTSI. This may be explained by proteins that penetrate into the extravascular space through capillaries with increased permeability.6 Another possible explanation is T1 prolongation in PHA, as shown in previous studies.7CONCLUSION
APTSI in the areas of enhancing tumor, but not in PHA is useful imaging marker for differentiation between GBMs and Mets. PHA of Mets, which usually represents simple vasogenic edema can show higher APTSI than NAWM. High APTSI in areas surrounding an enhancing tumor does not necessarily indicate presence of tumor invasion.Acknowledgements
No acknowledgement found.References
1. Zhou J, Payen JF, Wilson DA, et al. Using the amide proton signals of intracellular proteins and peptides to detect pH effects in MRI. Nat Med. 2003;9(8):1085-1090.
2. Jones CK, Schlosser MJ, van Zijl P, et al. Amide proton transfer imaging of human brain tumors at 3T. Magn Reson Med. 2006;56(3):585-592.
3. Togao O, Hiwatashi A, Yamashita K, et al. Grading diffuse gliomas without intense contrast enhancement by amide proton transfer MR imaging: comparisons with diffusion- and perfusion-weighted imaging. Eur Radiol. 2017;27(2):578-588.
4. Zhou JY, Tryggestad E, Wen ZB, et al. Differentiation between glioma and radiation necrosis using molecular magnetic resonance imaging of endogenous proteins and peptides. Nat Med. 2011;17(1):130-134.
5. Ma B, Blakeley JO, Hong X, et al. Applying amide proton transfer-weighted MRI to distinguish pseudoprogression from true progression in malignant gliomas. J Magn Reson Imaging. 2016;44(2):456-462.
6. Oh J, Cha S, Aiken AH, et al. Quantitative apparent diffusion coefficients and T2 relaxation times in characterizing contrast enhancing brain tumors and regions of peritumoral edema. J Magn Reson Imaging. 2005;21(6):701-708.
7. Li H, Li K, Zhang XY, et al. NMR Biomed. R1 correction in amide proton transfer imaging: indication of the influence of transcytolemmal water exchange on CEST measurements. 2015;28(12):1655-1662.
Figures