4849
Autopsy analysis of the overlap of radiomic profiles associated with poor overall survival and predictive maps of tumor cellularity in glioblastoma patients1Radiology, The Medical College of Wisconsin, Milwaukee, WI, United States, 2The Medical College of Wisconsin, Milwaukee, WI, United States, 3Pathology, The Medical College of Wisconsin, Milwaukee, WI, United States, 4Neurology, The Medical College of Wisconsin, Milwaukee, WI, United States, 5Neurosurgery, The Medical College of Wisconsin, Milwaukee, WI, United States
Synopsis
Multiparametric MRI radiomic profiles (RPs) of de novo glioblastoma (GBM) brain tumors have been shown to predict patient prognosis prior to treatment. This study compares prognostic RPs to predictive maps of tumor cellularity derived from radiological-pathological (rad-path) correlation to determine the convergence of both imaging biomarkers. We find that RPs associated with poor prognosis co-localize with high cellularity, both predicted and pathologically confirmed in 6 patients assessed at autopsy.
INTRODUCTION
Glioblastoma (GBM) is the most aggressive and fatal central nervous system tumor in adults, even despite recent therapeutical advancements1. GBM is a highly diffuse and heterogeneous tumor leading to difficulty in correctly defining tumor margins on clinical imaging2. Recent advances in image processing have determined imaging signatures, or radiomic profiles (RPs), in GBM patients associated decreased overall survival (OS) prior to treatment3. Other imaging biomarker advances have led to predictive maps of tumor cellularity based on rad-path training datasets from post-mortem whole-brain tissue samples4. This study combines these two techniques to determine the RP most strongly associated with hypercellular tumor.METHODS
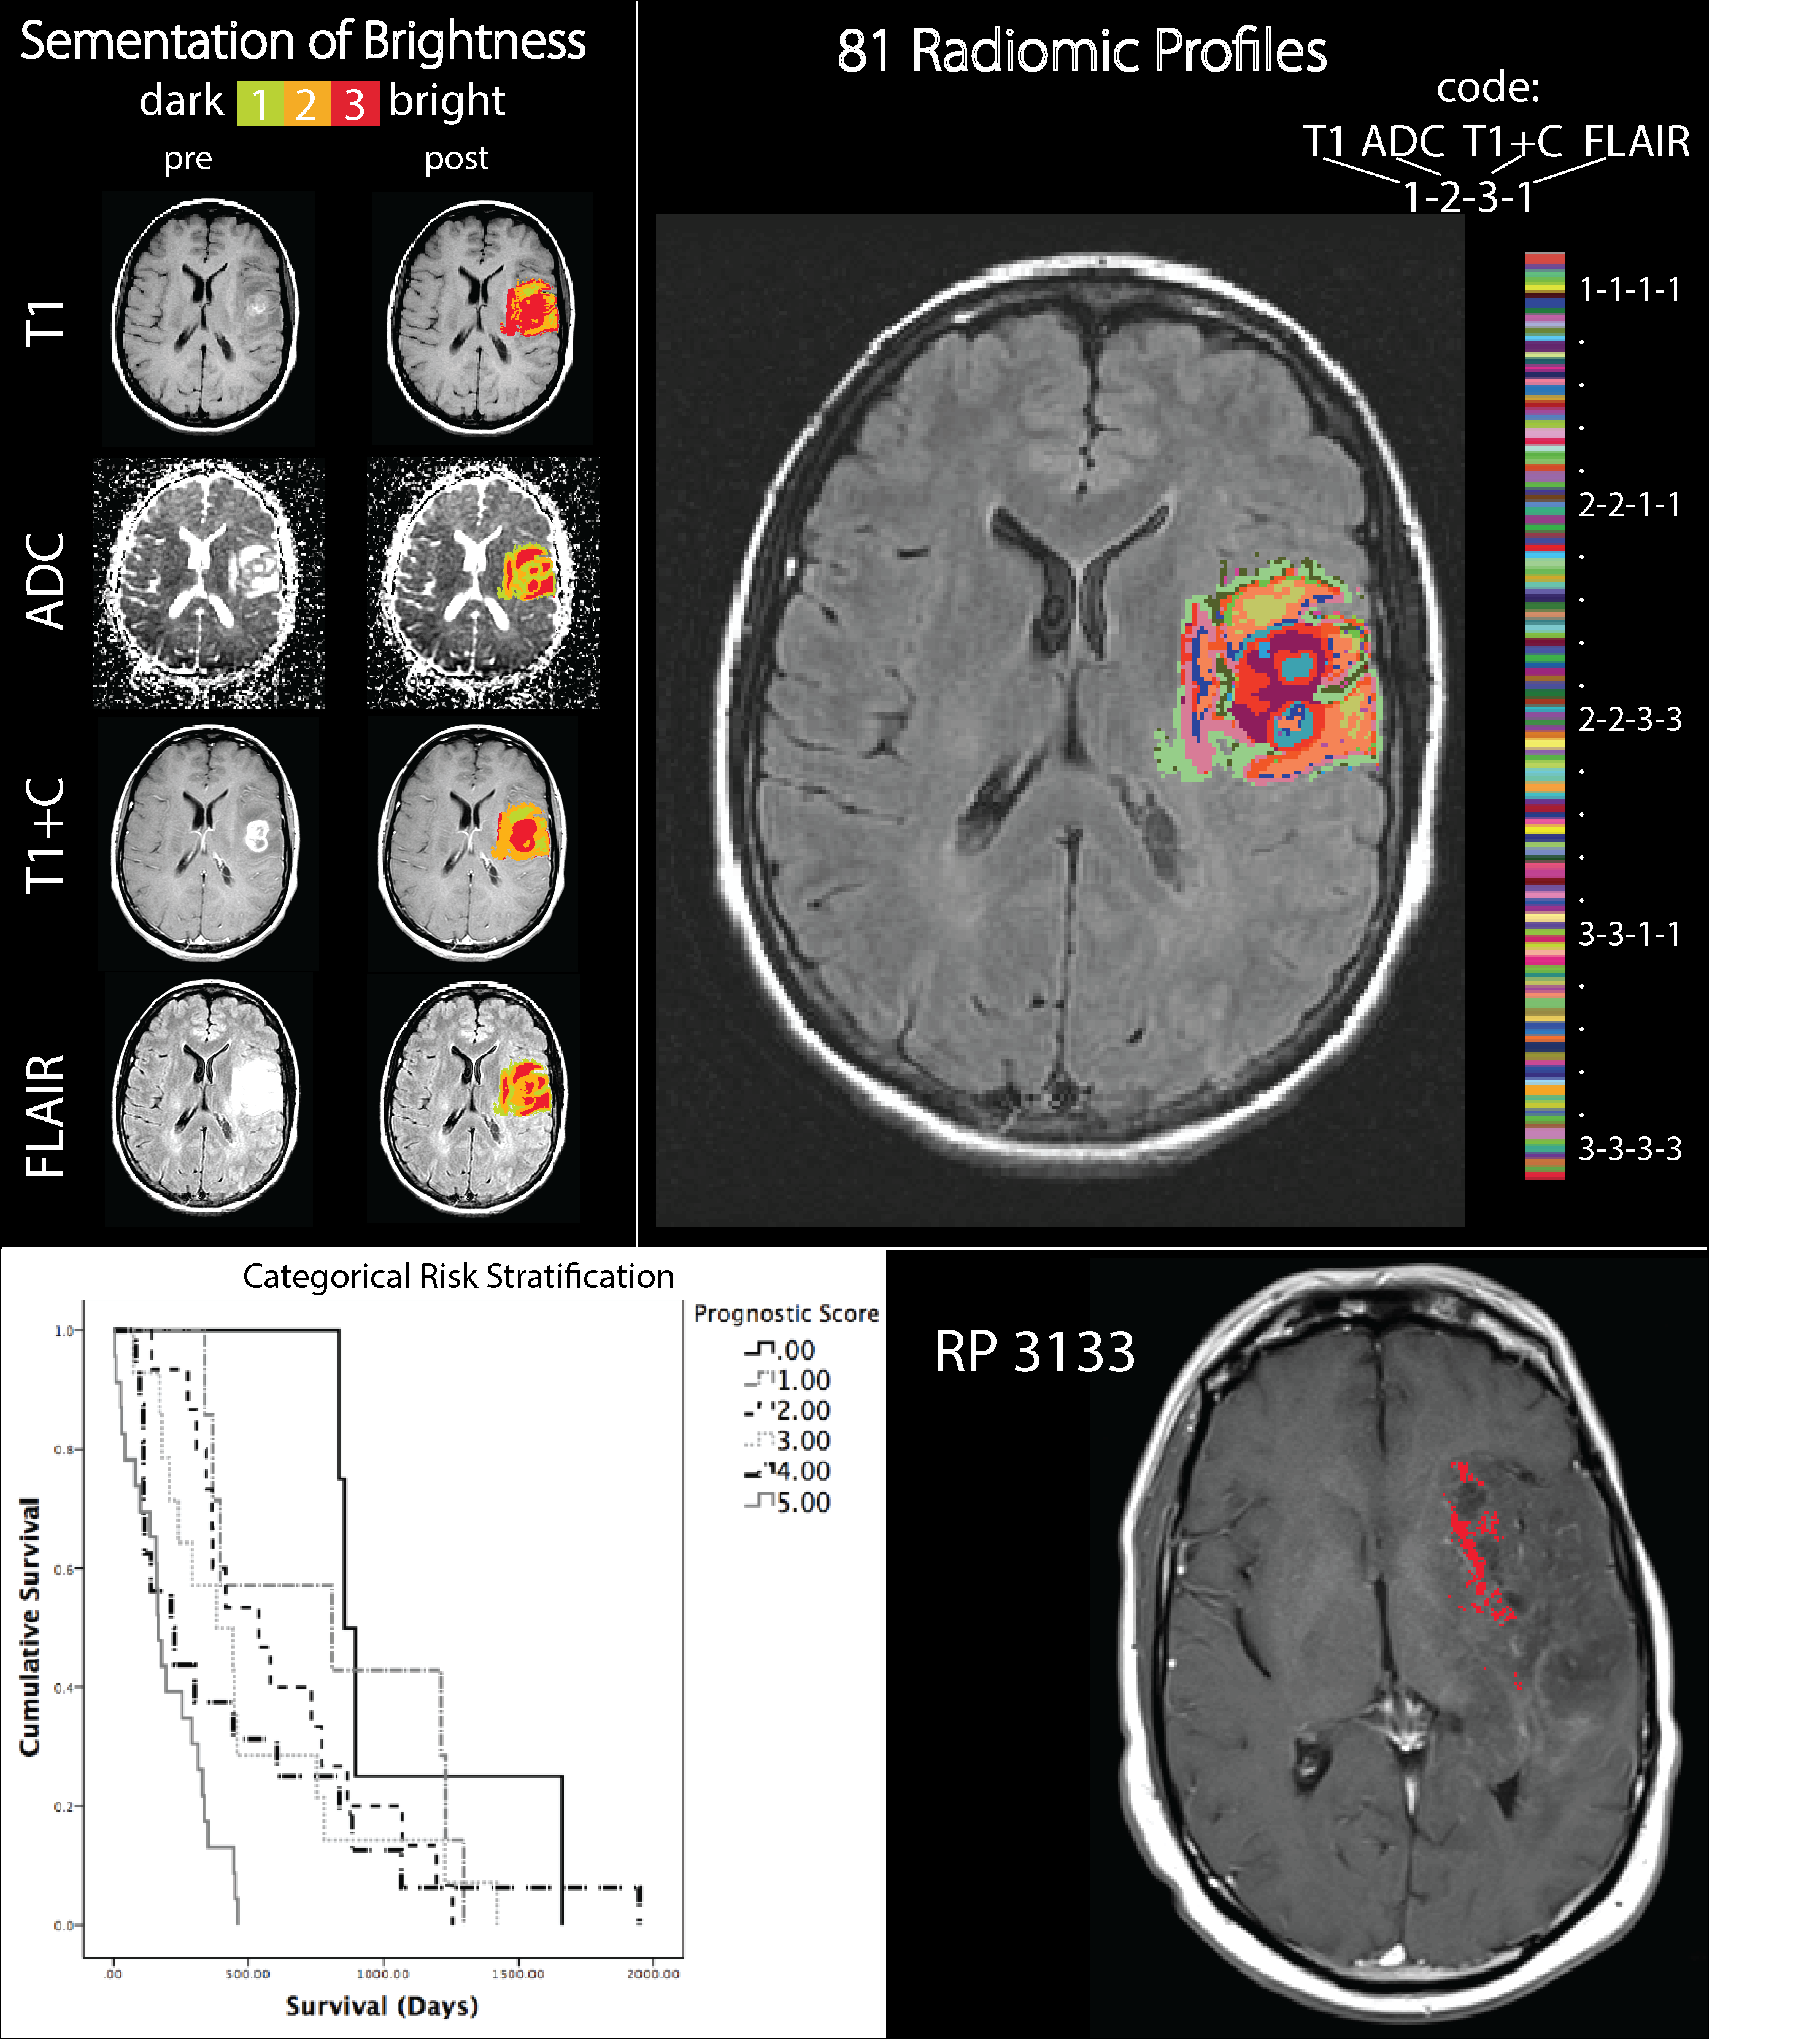
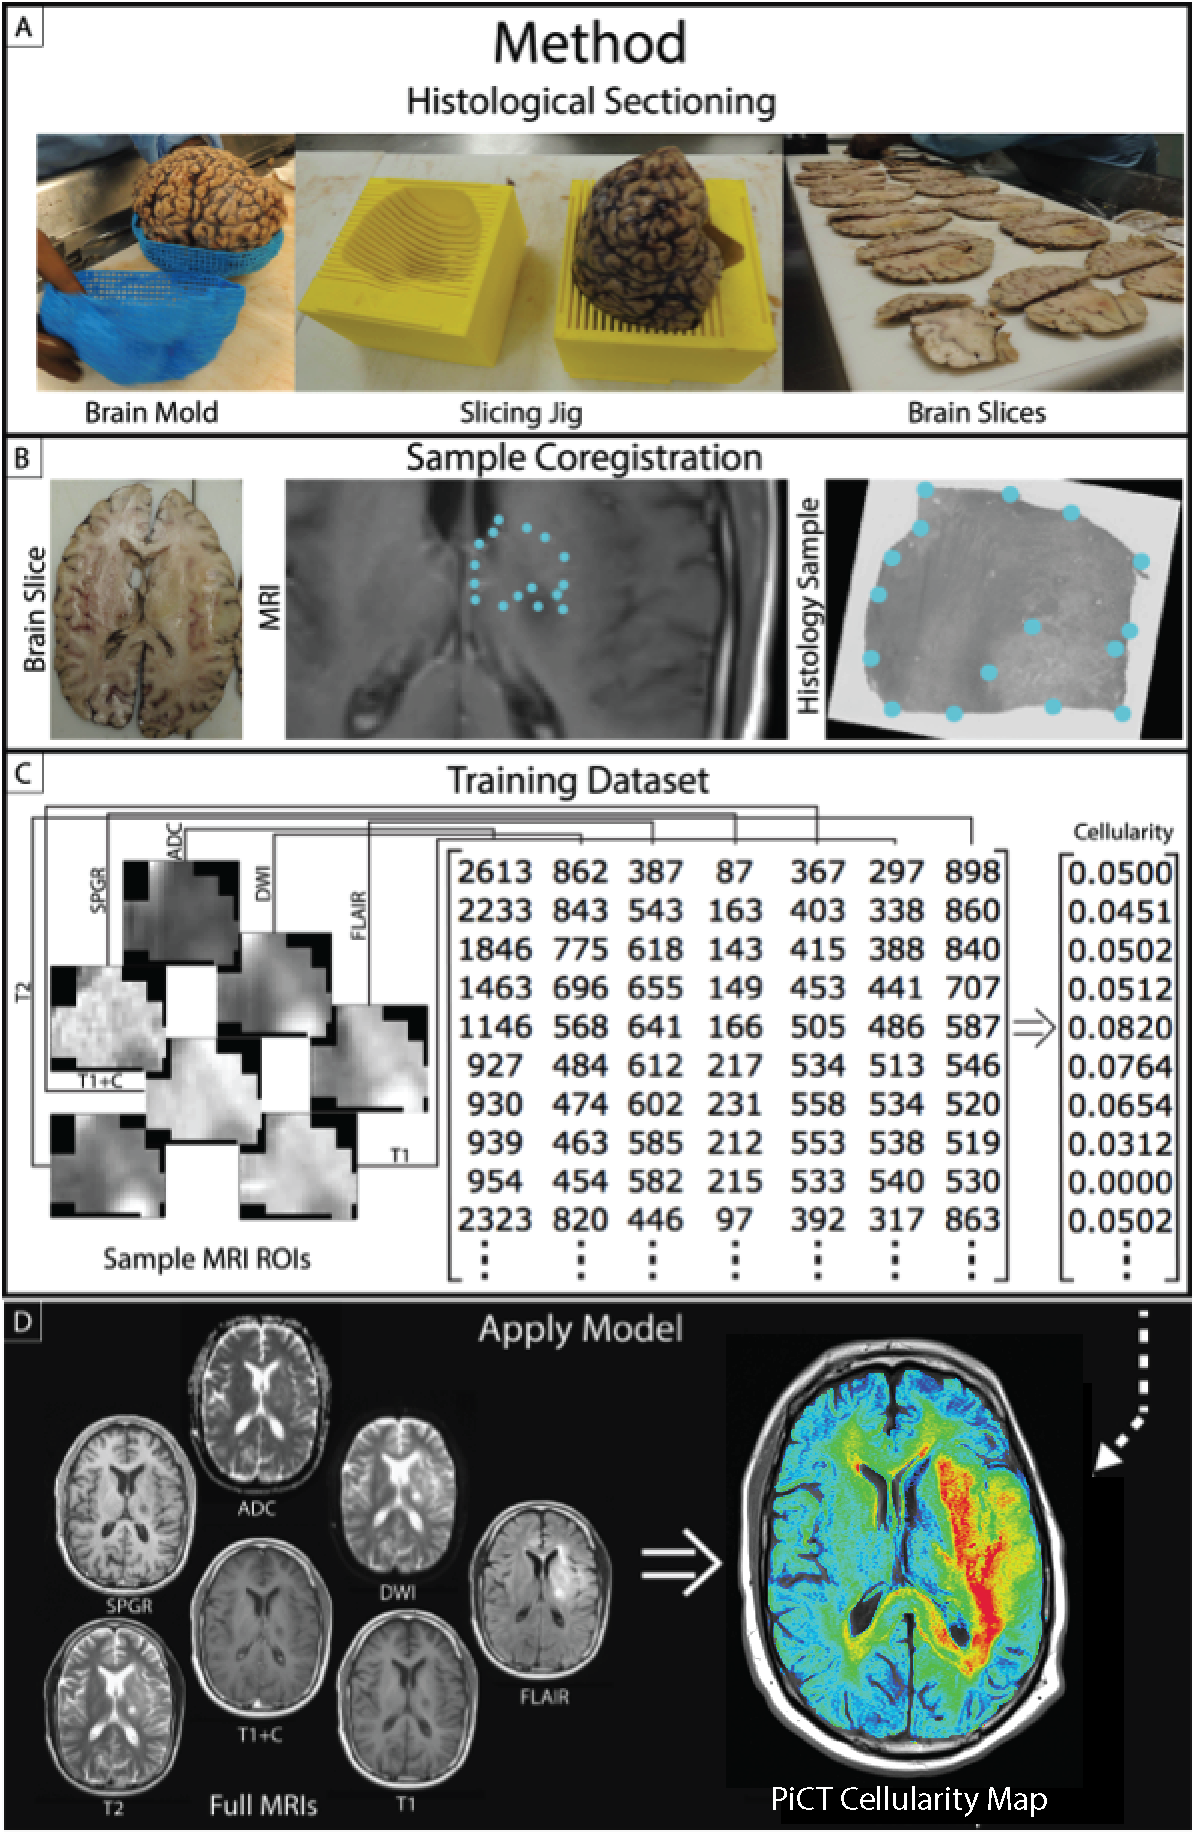
Six patients with post-mortem whole brain tissue samples available for study were included in this analysis. The patient’s final MRI scan prior to death was analyzed To create RPs, four image contrasts (T1, ADC, T1+C, and FLAIR) were co-registered to one another and intensity normalized. Each contrast was then segmented into 3 distinct intensity categories, bright, middle, and dark. Next, each image voxel was assigned a 4-digit code representing the brightness category for each contrast (Figure 1). Whole brain tissue samples were sliced in the same orientation as the final MRI scan using patient specific 3D-printed slicing jigs5. Collected tissue was H&E stained, digitized, and then quantitatively segmented to separate cells. The samples were then aligned with MR imaging using custom software5,6. Voxel information was extracted and used to train a partial least squares regression model, which was then applied to the entire to create MRI-resolution maps of cellularity. Next, the 5 RPs predictive of OS3 were compared to these cellularity maps to find regions of complete overlap between a single profile and hypercellularity. Finally, tissue samples from regions containing the RP in question were pathologically analyzed.RESULTS
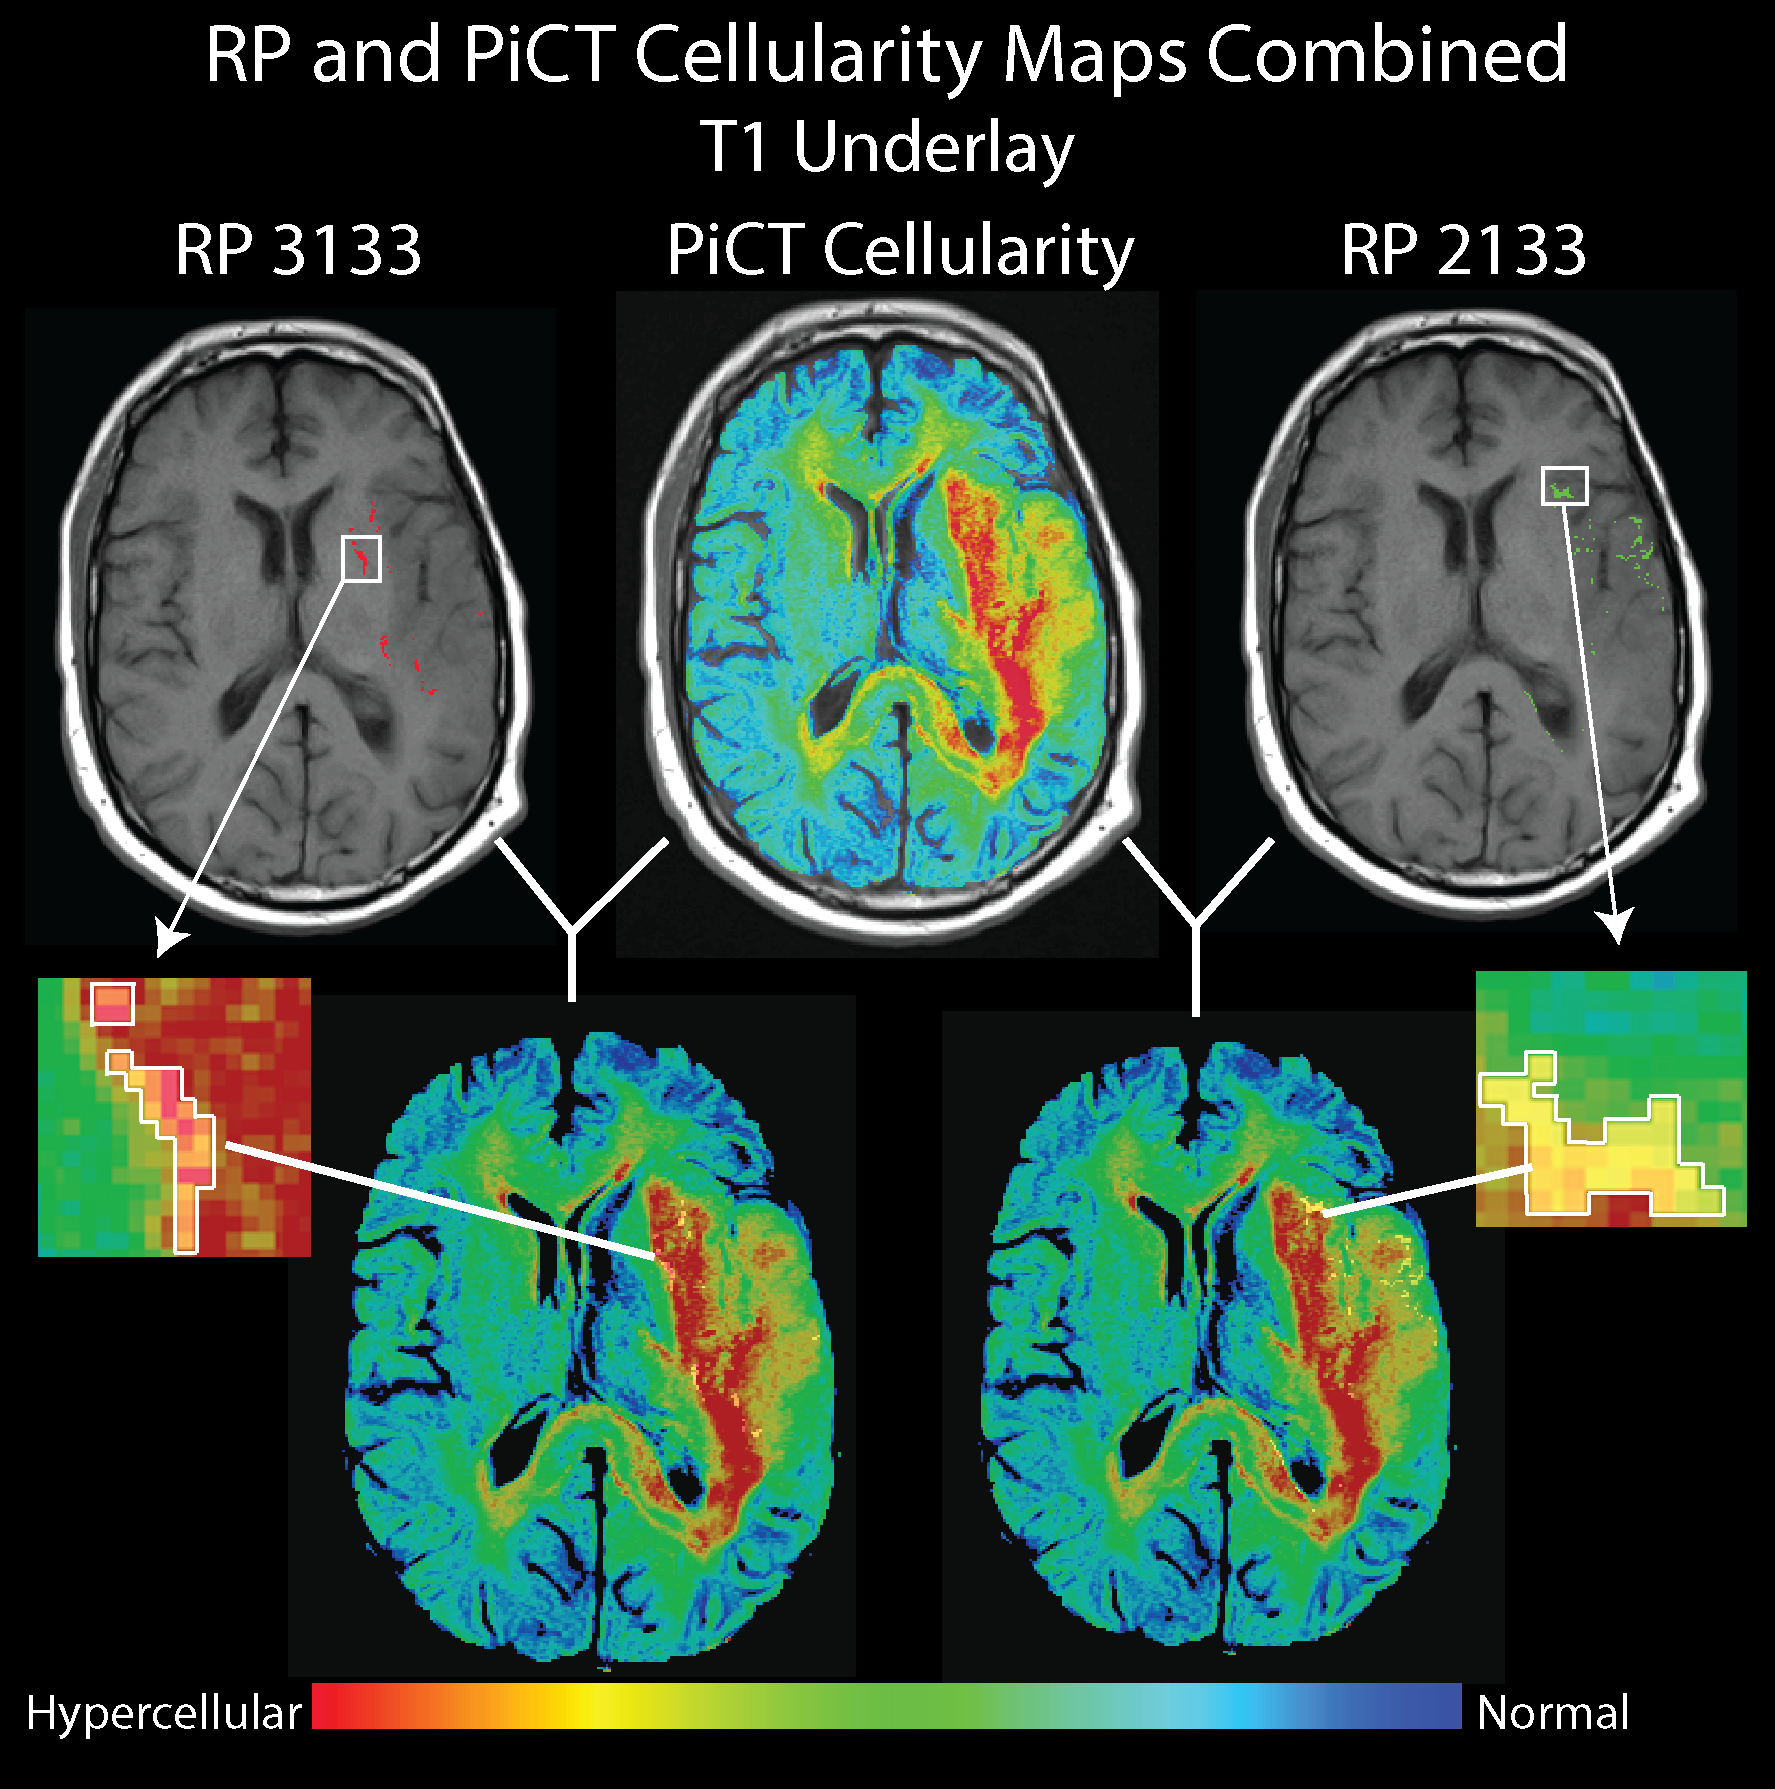
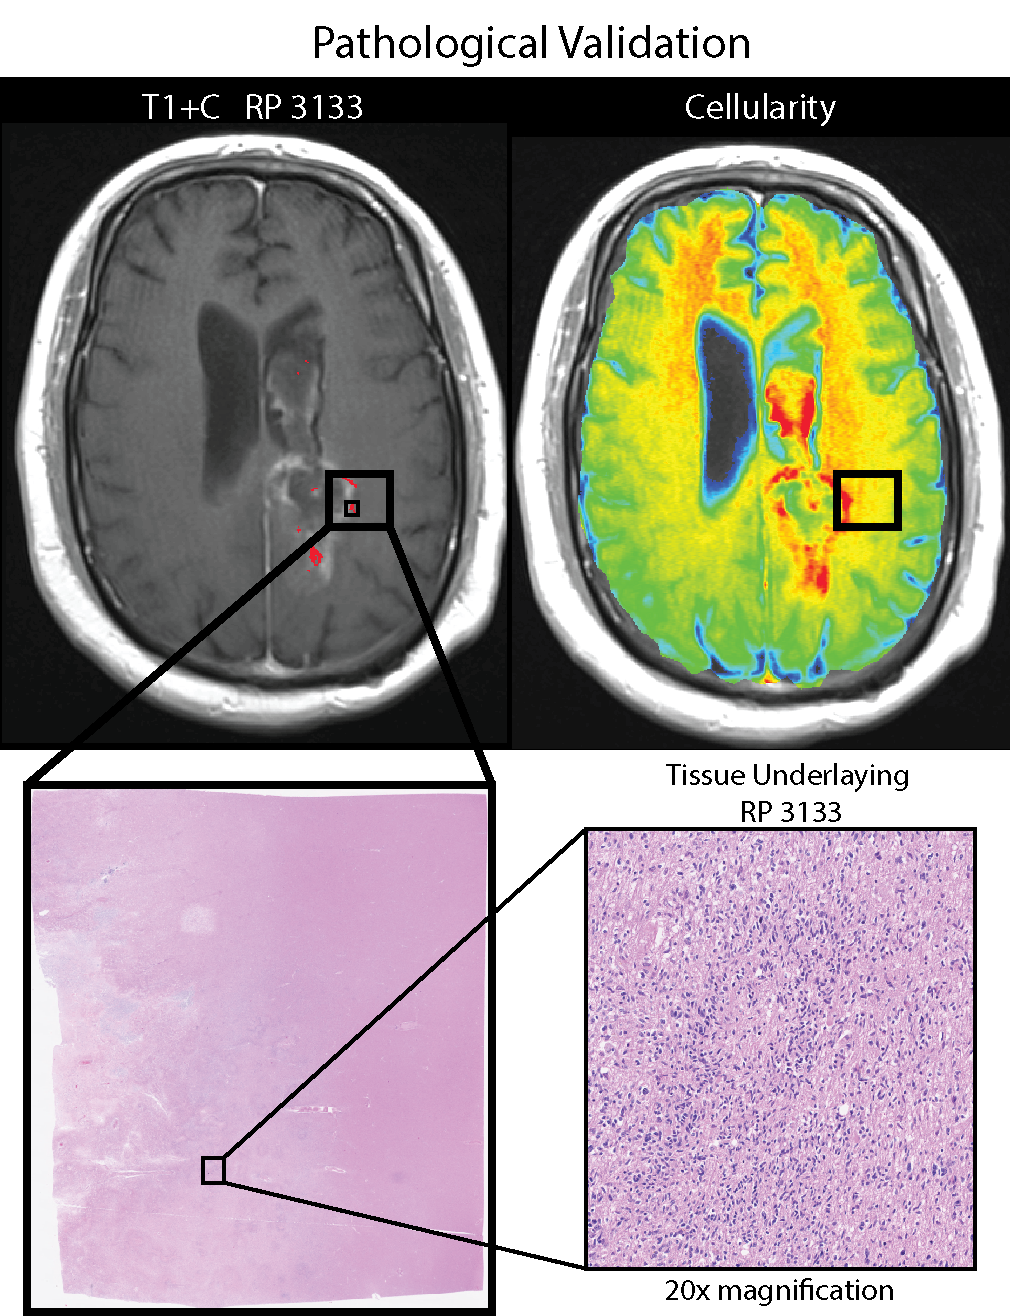
RP 3133, representing bright T1, dark ADC, bright T1+C, and bright FLAIR, was found to be predictive of poor OS and hypercellular tumor according to PiCT maps of cellularity and pathologist analysis in all 6 patients. Other profiles were associated with a mix of hypercellularity and hypocellular conditions or in the case of RP 1213 mostly low to normal levels of cellularity. Figure 3 shows a comparison of RP 3133 and RP 2133 when overlaid with cellularity maps. Figure 4 shows the pathological validation step with a sample from one patient that contains RP 3133.DISCUSSION:
This study validates two imaging biomarkers of infiltrative glioblastoma, radiomic profiles associated with poor prognosis, and predictive maps of tumor cellularity. These convergent results suggest that both imaging techniques are sensitive to tumor invasion beyond margins traditionally defined by conventional imaging and should be considered when planning treatment. More research is necessary to generalize these findings beyond this limited dataset.CONCLUSIONS
We conclude that radiomic profiles and PiCT maps of tumor cellularity provide complimentary imaging biomarkers sensitive to invisible glioblastoma cell invasion. This technology may improve patient treatment in the future.Acknowledgements
No acknowledgement found.References
1. Louis DN, Perry A, Reifenberger G, et al. The 2016 World Health Organization Classification of Tumors of the Central Nervous System: a summary. Acta Neuropathol. 2016;131(6):803-820.
2. Parsons DW, Jones S, Zhang X, et al. An integrated genomic analysis of human glioblastoma multiforme. Science. 2008;321(5897):1807-1812.
3. McGarry SD, Hurrell SL, Kaczmarowski AL, et al. Magnetic Resonance Imaging-Based Radiomic Profiles Predict Patient Prognosis in Newly Diagnosed Glioblastoma Before Therapy. Tomography. 2016;2(3):223-228.
4. Hurrell SL, Cochran E, McGarry S, et al. Predictive cytological topography, a radiopathomics approach, highlights regions of pathologically confirmed non-enhancing hypercellular tumor in glioblastoma patients at autopsy. Proc. International Society for Magnetic Resonance in Medicine, Annual Meeting Honolulu, HI. 2017.
5. Nguyen HS, Milbach N, Hurrell SL, et al. Progressing Bevacizumab-Induced Diffusion Restriction Is Associated with Coagulative Necrosis Surrounded by Viable Tumor and Decreased Overall Survival in Patients with Recurrent Glioblastoma. AJNR Am J Neuroradiol. 2016.
6. LaViolette PS, Mickevicius NJ, Cochran EJ, et al. Precise ex vivo histological validation of heightened cellularity and diffusion-restricted necrosis in regions of dark apparent diffusion coefficient in 7 cases of high-grade glioma. Neuro Oncol. 2014;16(12):1599-1606.
Figures