4847
Radiomics of MRI at Diagnosis is Predictive of Extreme Survival in Glioblastoma Multiforme1Image Response Assessment Team Core, Moffitt Cancer Center, Tampa, FL, United States, 2Department of Cancer Imaging & Metabolism, Moffitt Cancer Center, Tampa, FL, United States, 3Department of Neurologic Surgery, Mayo Clinic, Phoenix, AZ, United States, 4Department of Radiology, University of Washington, Seattle, WA, United States, 5Department of Diagnostic & Interventional Radiology, Moffitt Cancer Center, Tampa, FL, United States, 6Department of Cancer Epidemiology, Moffitt Cancer Center, Tampa, FL, United States
Synopsis
We retrospectively analyzed pre-treatment MR scans in two cohorts diagnosed with Glioblastoma. The Long-Term Survival (LTS) group survived >36 months post-diagnosis, while the Short-Term Survival (STS) group survived ≤18 months. The discovery cohort included 22 LTS patients and 22 STS patients and the validation cohort consisted of 15 patients, each. Tumor voxels were clustered on post-contrast T1w and FLAIR sequences into 6 distinct “habitats”. Radiomic features were extracted from both sequences. The enhancement value on T1w and fraction of Habitat 6 (high signal on T1w and FLAIR) were significantly higher in the LTS groups compared to the STS groups.
PURPOSE
We retrospectively analyzed pre-treatment MRI scans in two cohorts of patients diagnosed with Glioblastoma Multiforme (GBM). The Long Term Survival (LTS) group included 22 patients who survived > 36 months post diagnosis and the Short Term Survival (STS) group included 22 patients who survived ≤ 19 months. We computed radiomic image features within a volume encompassing the contrast-enhancing portion of the tumor in each subject. Our study hypothesis is that there are innate differences in tumor aggressiveness and responsiveness to therapy that are present at diagnosis in gliomas of patients in the two groups (LTS vs. STS), and these differences manifest as sub-visual features on standard MRI images that can be quantified using radiomics1. The overall objective is to develop a non-invasive prognostic marker to drive personalized therapy in GBM.METHODS
Following IRB approval, we defined patient cohorts with pathologically confirmed primary GBM who had available pre-operative T2-weighted Fluid Attenuated Inversion Recovery (FLAIR), T2-weighted (T2W), and T1-weighted pre- and post-contrast scans acquired at diagnosis. The discovery cohort comprised patients retrospectively identified from the database at a single institution (n=22, both LTS and STS groups). The validation cohort comprised subjects who were identified retrospectively from the ENDURES multi-institutional database (n=15, both LTS and STS groups). For each patient, FLAIR and T1W pre- and post-contrast images were co-registered to T2W images. A volume of interest (VOI) was manually delineated around the contrast enhancing margin on post-contrast T1W images for each tumor. Normal white matter and cerebrospinal fluid (CSF) regions were automatically segmented using a multiparametric MRI clustering approach, and the mean voxel intensity values within these two regions were used to linearly calibrate voxel intensities on T2W, FLAIR and T1W pre-contrast images. T1W post-contrast images were calibrated as the associated T1W pre-contrast images. Voxels within the tumor from all patients in the discovery cohort were pooled and clustered by Otsu method2 into three levels of contrast enhancement: low, medium and high. These three clusters were further sub-divided on the basis of FLAIR intensity being above or below mean calibrated FLAIR intensity in normal white matter, for a total of 6 “habitats”3. Radiomic features were extracted from FLAIR and T1w post-contrast sequences using a pipeline developed and validated in accordance with Image Biomarker Standardisation Initiative4. Student’s t-test was used to test for differences in the radiomic features and habitat volumes between the LTS and STS groups. Survival analyses were performed using Kaplan-Meier survival curves and statistical significance was computed using the log-rank test. For Kaplan-Meier analysis, radiomic features and habitat volumes were dichotomized into two groups using the median score value from the discovery cohort.RESULTS
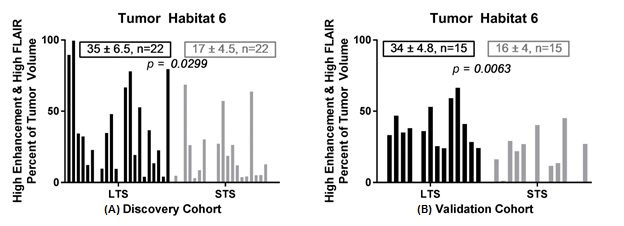
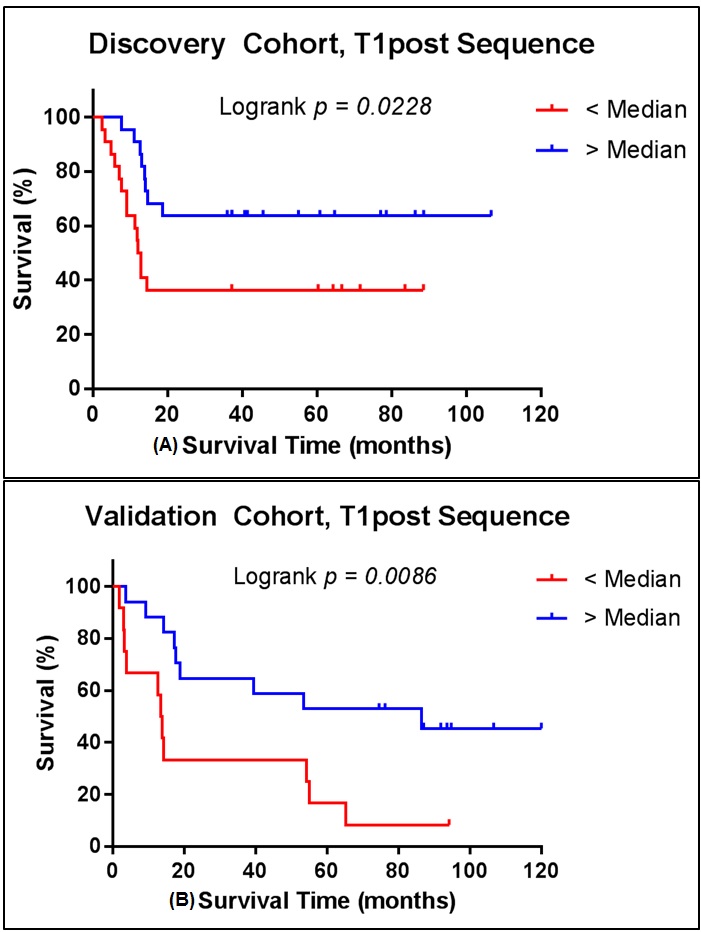
Tumor voxels were clustered by the calibrated and normalized signal intensities on post-contrast T1w and FLAIR sequences into 6 distinct “habitats” based on low-medium-high contrast enhancement and low-high signal on FLAIR scans. In the discovery cohort Habitat 6 (high enhancement + high FLAIR) comprised a significantly higher tumor volume in LTS compared with STS (Figure 1A). This finding was replicated in the validation cohort (Figure 1B). Of the radiomic features calculated on the tumor VOI on the FLAIR and T1W post-contrast images, 90th percentile of intensity4 (computed on T1w post-contrast) was significantly different between the LTS and STS groups in both the discovery (p=0.039) and validation (p=0.049) cohorts. The feature captured the value at the 90th percentile of intensities within the tumor VOI. For survival analyses, median score of the feature in the discovery cohort was used to dichotomize the patients in both discovery and validation cohorts. Based on the median split, the feature was associated with overall survival in both discovery (p=0.023) and validation (p=0.009) cohorts (Figure 2). In both discovery and validation cohorts the calibrated T1W post-contrast intensity value at the 90th percentile was higher in tumors from the LTS group than in the STS group.CONCLUSIONS
Habitat analysis by multispectral clustering within the tumor VOI on MRI images acquired at diagnosis of GBM reveals a correlation between the presence of Habitat 6 (high enhancement + high FLAIR signal) and survival beyond 36 months post-diagnosis. Further, radiomic analysis shows that, in both the discovery and validation cohorts, the calibrated intensity of contrast enhancement at the 90th percentile was significantly higher in LTS subjects compared with STS subjects at diagnosis. We are exploring the hypothesis that these findings indicate a greater presence of immune infiltrates in the tumor in long term survivors of GBM at diagnosis.Acknowledgements
No acknowledgement found.References
1. Gillies, R. J., Kinahan, P. E., Hricak, H. Radiomics: Images Are More than Pictures, They Are Data. Radiology, 278:563-77, 2016.
2. Gatenby, R. A., Grove, O., Gillies, R. J. Quantitative imaging in cancer evolution and ecology. Radiology, 269:8-15, 2013.
3. Otsu, N. A threshold selection method from gray-level histograms. IEEE Trans Systems Man Cybernetics, 9:62-66, 1979.
4. Zwanenburg, A., Leger, S., Vallières, M. and Löck, S. Image biomarker standardisation initiative - feature definitions. In eprint arXiv:1612.07003, 2016.
Figures