4844
Vascular Hysteresis Loops and Vascular Architecture Mapping in Patients with Glioblastoma treated with Antiangiogenic Therapy1Department of Neurosurgery, University of Erlangen-Nürnberg, Erlangen, Germany, 2Institute of Medical Radiology, University Clinic of St. Pölten, St. Pölten, Austria, 3Department of Neurology, University Clinic of St. Pölten, St. Pölten, Austria, 4Department of Neuroradiology, University of Erlangen-Nürnberg, Erlangen, Germany
Synopsis
Glioblastoma are among the most vascularized of all solid tumors and attractive targets for antiangiogenic therapies. Antiangiogenic therapy response assessment in glioblastoma is challenging due to decreased vessel permeability and diminished contrast agent extravasation. Here, we investigated the variability of vascular hysteresis loop (VHL) shapes and the spatial heterogeneity of neovascularization using vascular architecture mapping (VAM) in patients with recurrent glioblastoma during bevacizumab mono-therapy. Responding, non-responding, progressive, and remote-progressive tumor areas were observed. Analysis of VHLs in combination with VAM biomarkers may lead to a new perspective on investigating the spatial heterogeneity of neovascularization in glioblastoma during antiangiogenic therapy.
Introduction
Glioblastoma are among the most vascularized of all solid tumors with an elevated expression of vascular endothelial growth factor (VEGF) protein, which is a critical regulator of tumor angiogenesis (1). Glioblastoma are therefore attractive targets for antiangiogenic therapies using the VEGF-specific antibody bevacizumab (2). However, MRI-based tumor volume criteria don’t make sense for bevacizumab response assessment in Glioblastoma (3). The major challenge is the decreased vessel permeability (4), which results in diminished contrast agent extravasation (5) but does not necessarily reflect biological tumor response (6). In this study, we investigated the variability of vascular hysteresis loop (VHL) shapes and the spatial heterogeneity of neovascularization and microvascular alterations using vascular architecture mapping (VAM) in patients with recurrent glioblastoma during bevacizumab mono-therapy.Methods
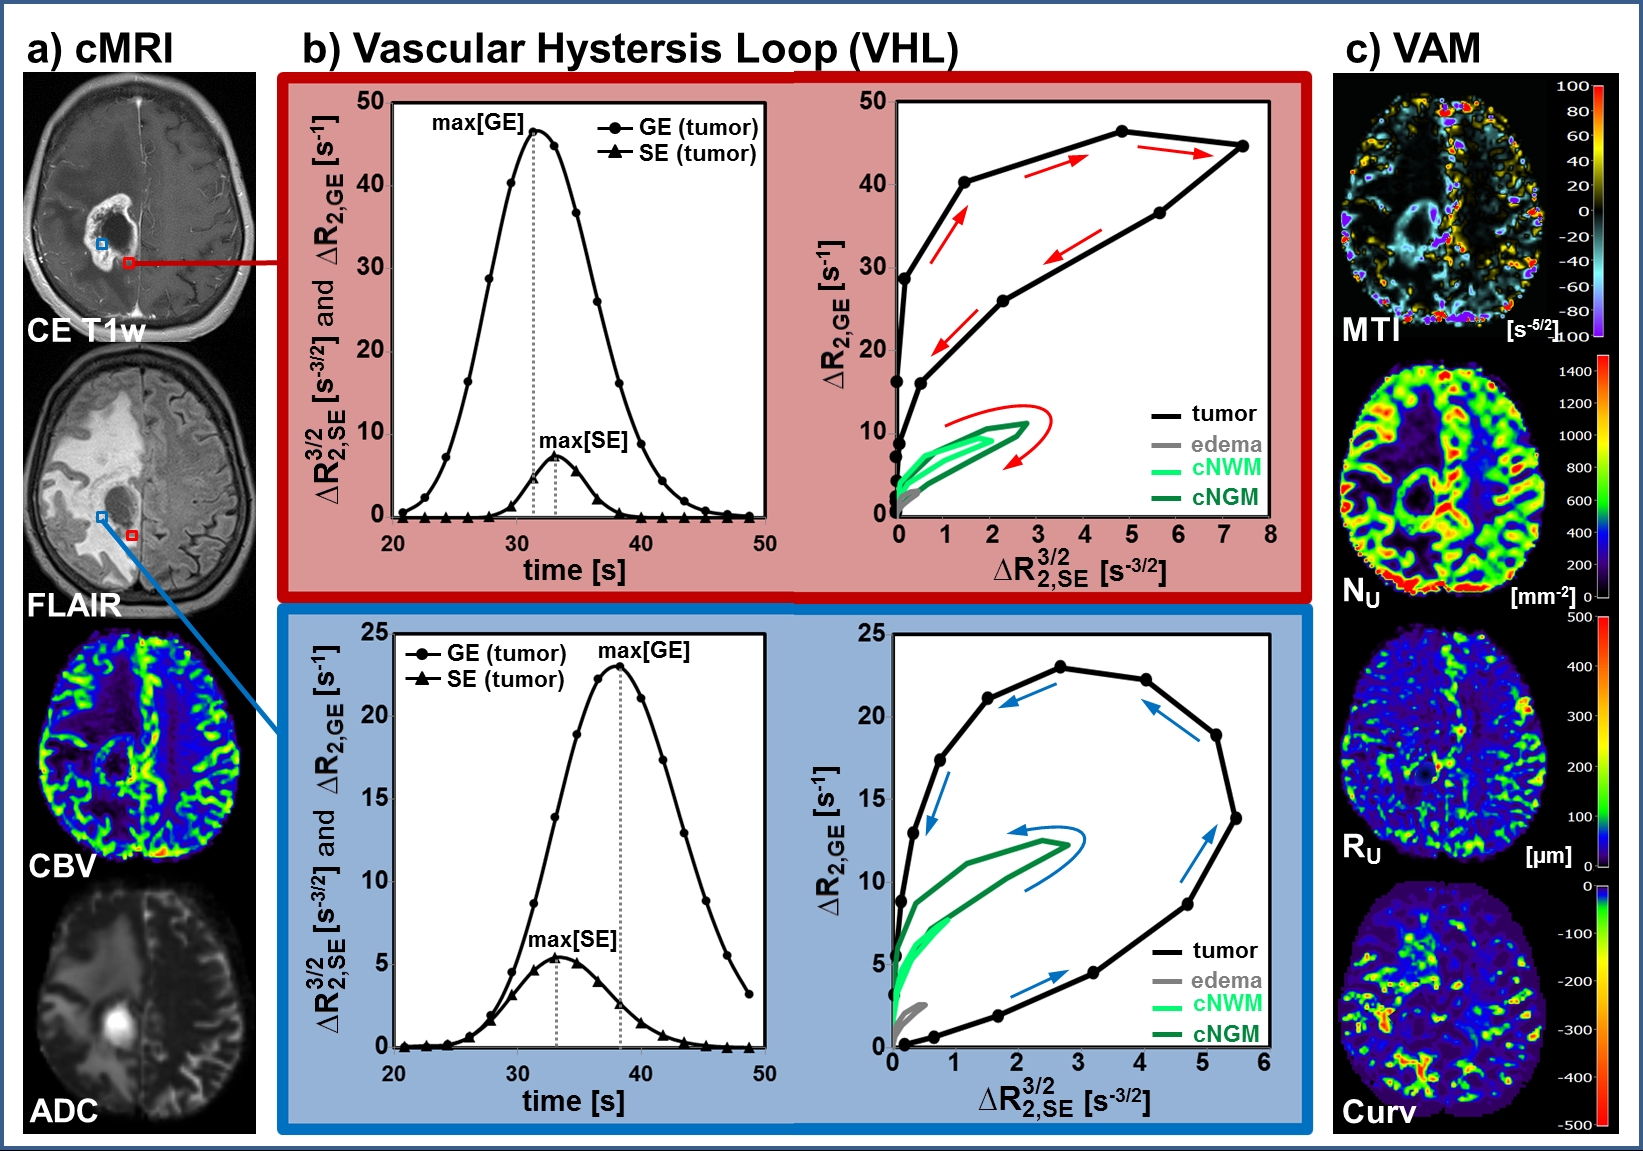
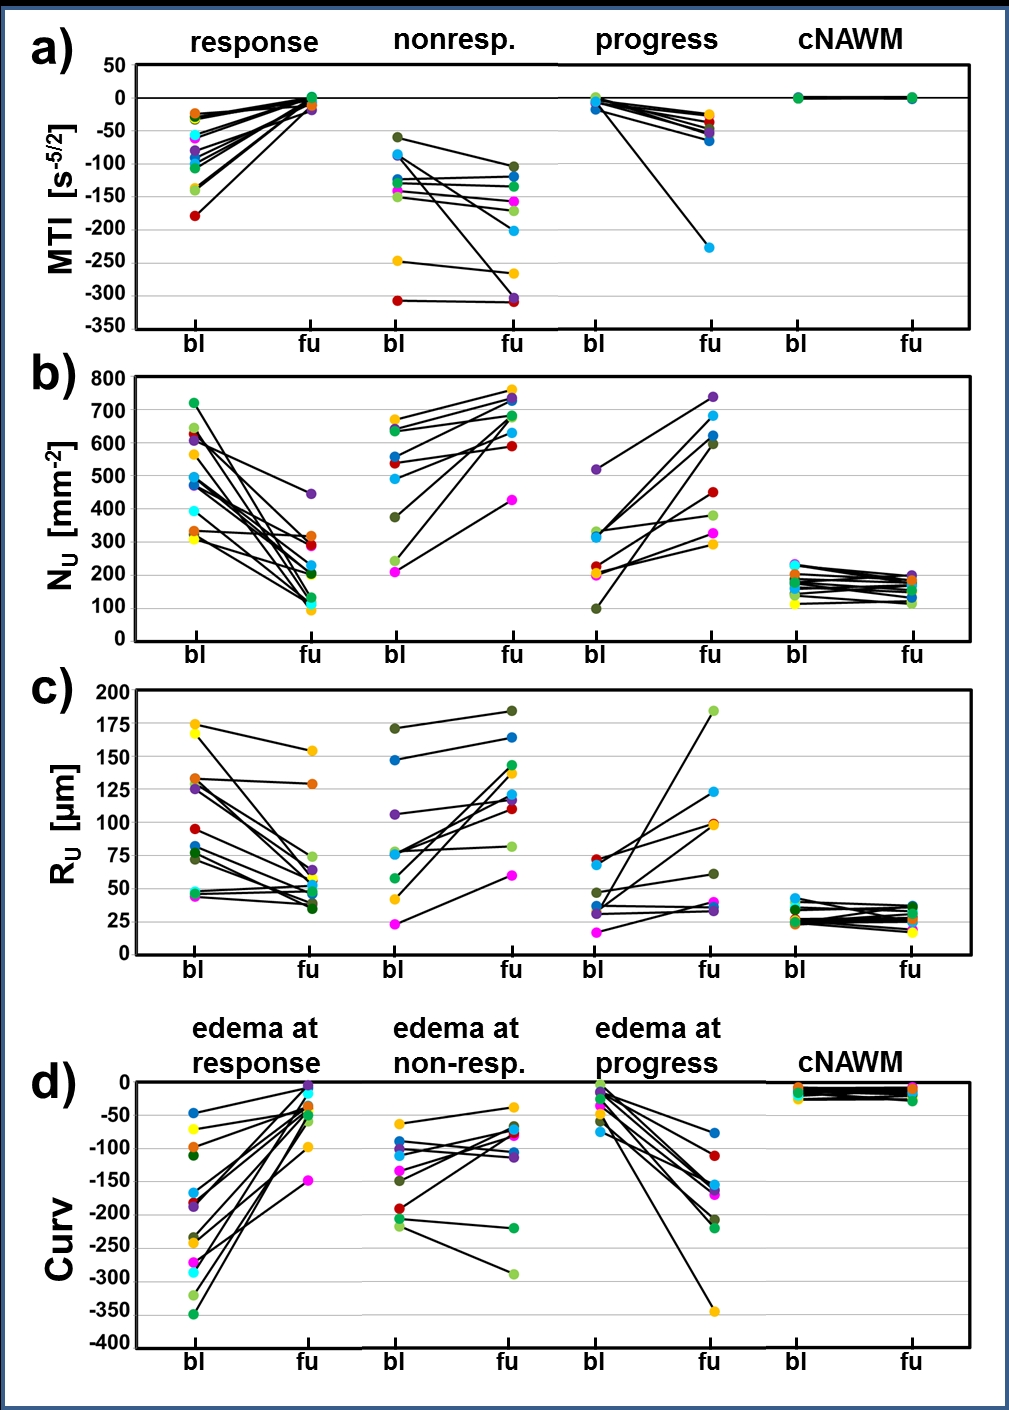
Thirteen patients with recurrent glioblastoma who received bevacizumab (Avastin, Roche; every 2 weeks 10 mg/kg-bodyweight) as second-line mono-therapy were included in this study. MR examinations were performed on a 3 Tesla clinical MR scanner (Trio) 1–5 days prior to (baseline) and 3 months after bevacizumab treatment onset (follow-up). In two patients a MRI examination was additionally performed after the first cycle of bevacizumab. For VAM we used a dual contrast agent injections approach to obtain DSC perfusion MRI data using SE- and GE-EPI sequences with high spatial resolution and coverage of the whole brain. To minimize patient motions the head of the patients were fixated as well as clear and repeated patient instructions before and during the MRI examination were provided. To prevent differences in the time to first-pass peak between the two DSC examinations, a peripheral pulse unit (PPU) was used to monitor heart rate (7). Geometric and measurement parameters were chosen identical for SE- and GE-EPI DSC: TR, 1740ms; voxel size, 1.8 x 1.8 x 4 mm3; 29 slices; 60 dynamics. Both DSC perfusion examinations were performed with administration of a single-does contrast agent. VAM analysis was performed using custom-made Matlab software. SE- and GE-EPI DSC data were checked for motion artifacts during or between the acquisitions (8). ΔR(t)2,SE and ΔR(t)2,GE were calculated from the signals of the SE- and GE-EPI DSC data using ∆R(t)2,XE = -[1/TEXE] ∙ ln[S(t)XE / S0,XE], where XE stands for SE or GE, respectively. S0 is the baseline (prebolus) signal, and S(t) is the signal during the first bolus passage of the corresponding sequence. S0 was determined as the mean of the signals from the 4th to the 15th dynamic volume (8). The truncated ΔR(t)2,SE and ΔR(t)2,GE curves of the first bolus were fitted to a previously described gamma-variate function (9) and used for calculation of the ΔR(t)2,GE versus [ΔR(t)2,SE]3/2 diagram (Fig. 1b), which we termed vascular hysteresis loop (VHL). The VHL of each voxel was evaluated by the following four parameters: i) microvessel type indicator (MTI) as the signed area of the VHL; ii) microvessel density (NU) and iii) radius (RU) which were adapted of the temporal shift phenomenon; and iv) the curvature (Curv) of the long-axis of the VHL (Fig. 1c). We termed this approach vascular architecture mapping (VAM).Results
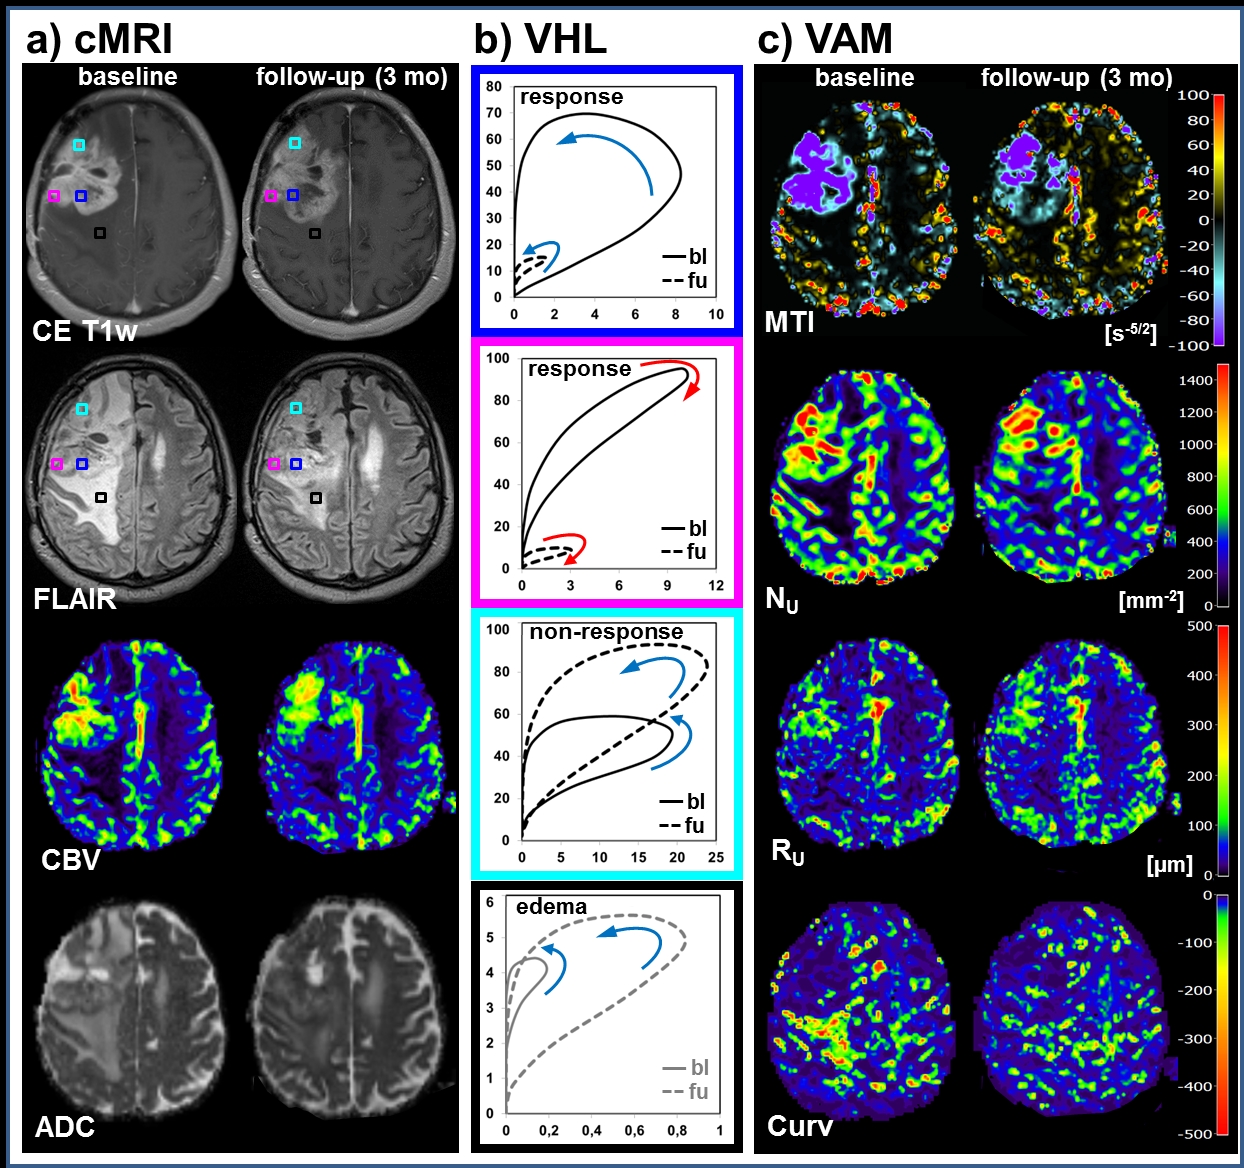
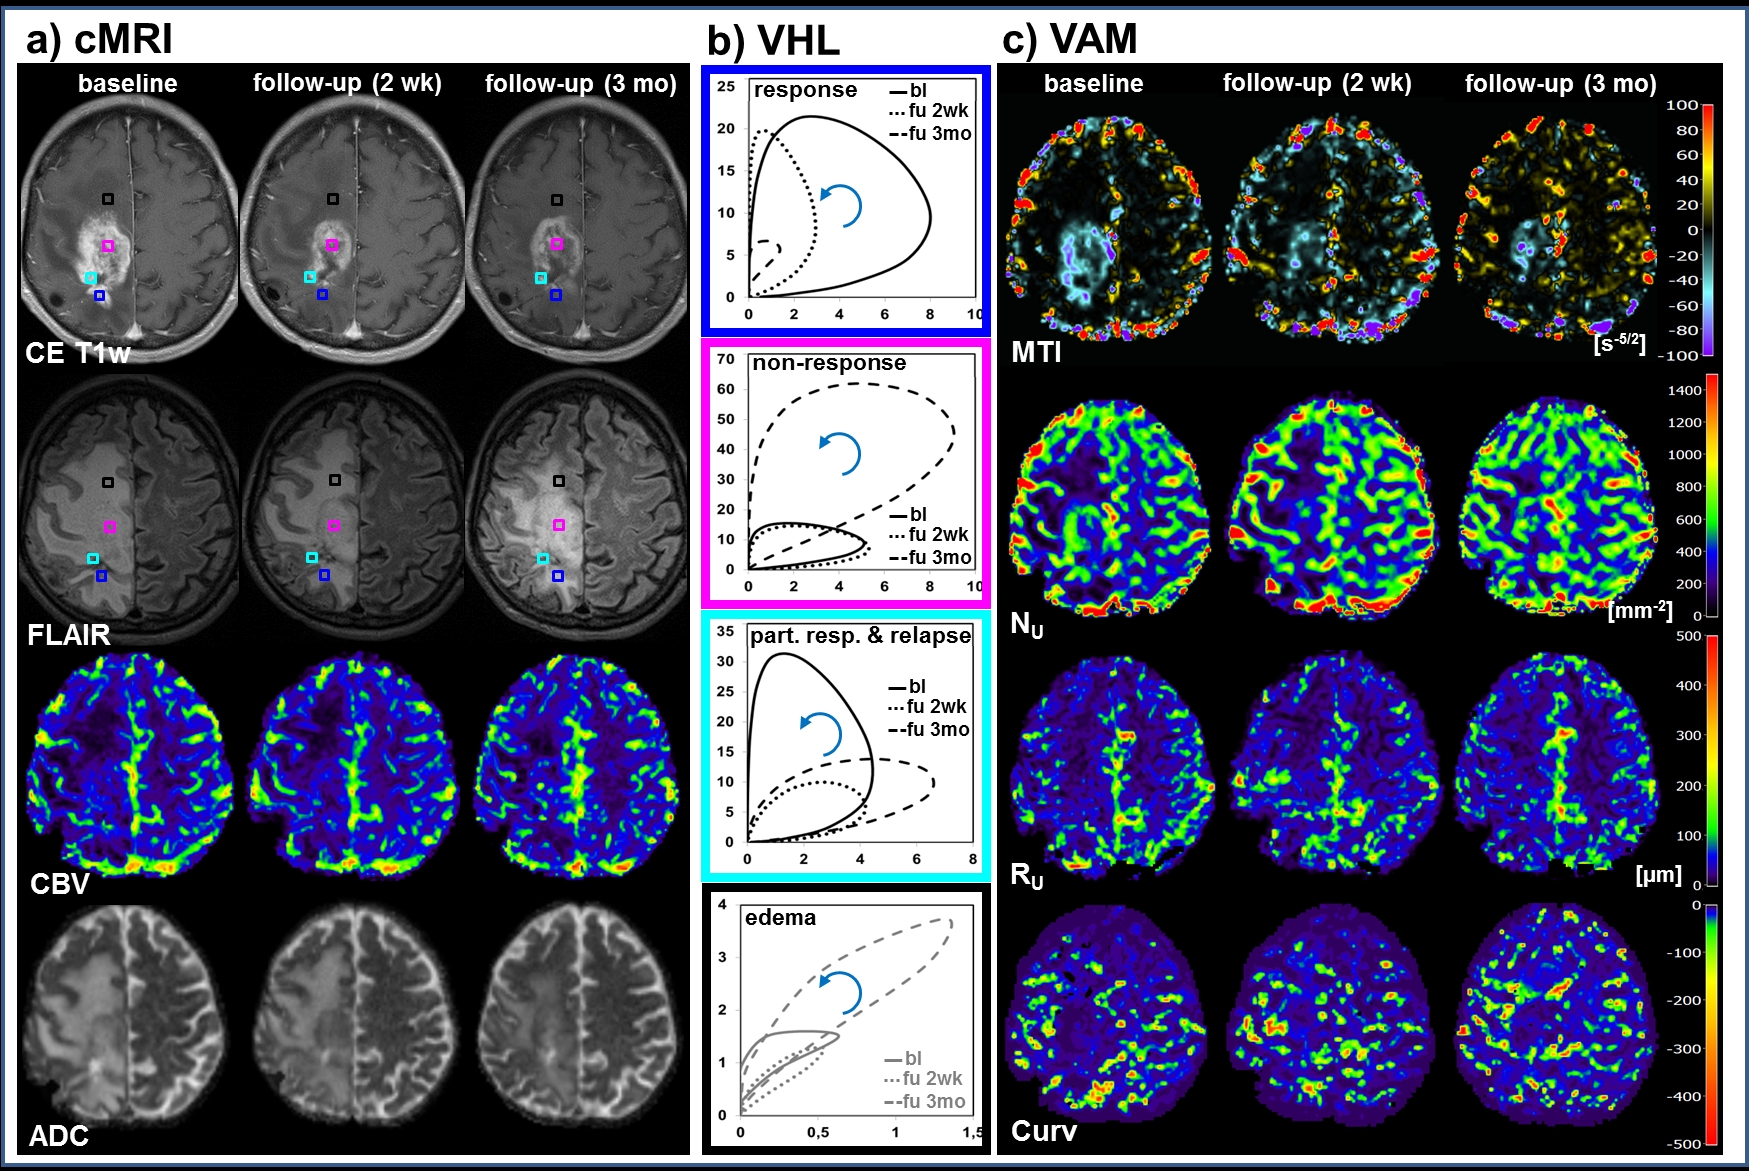
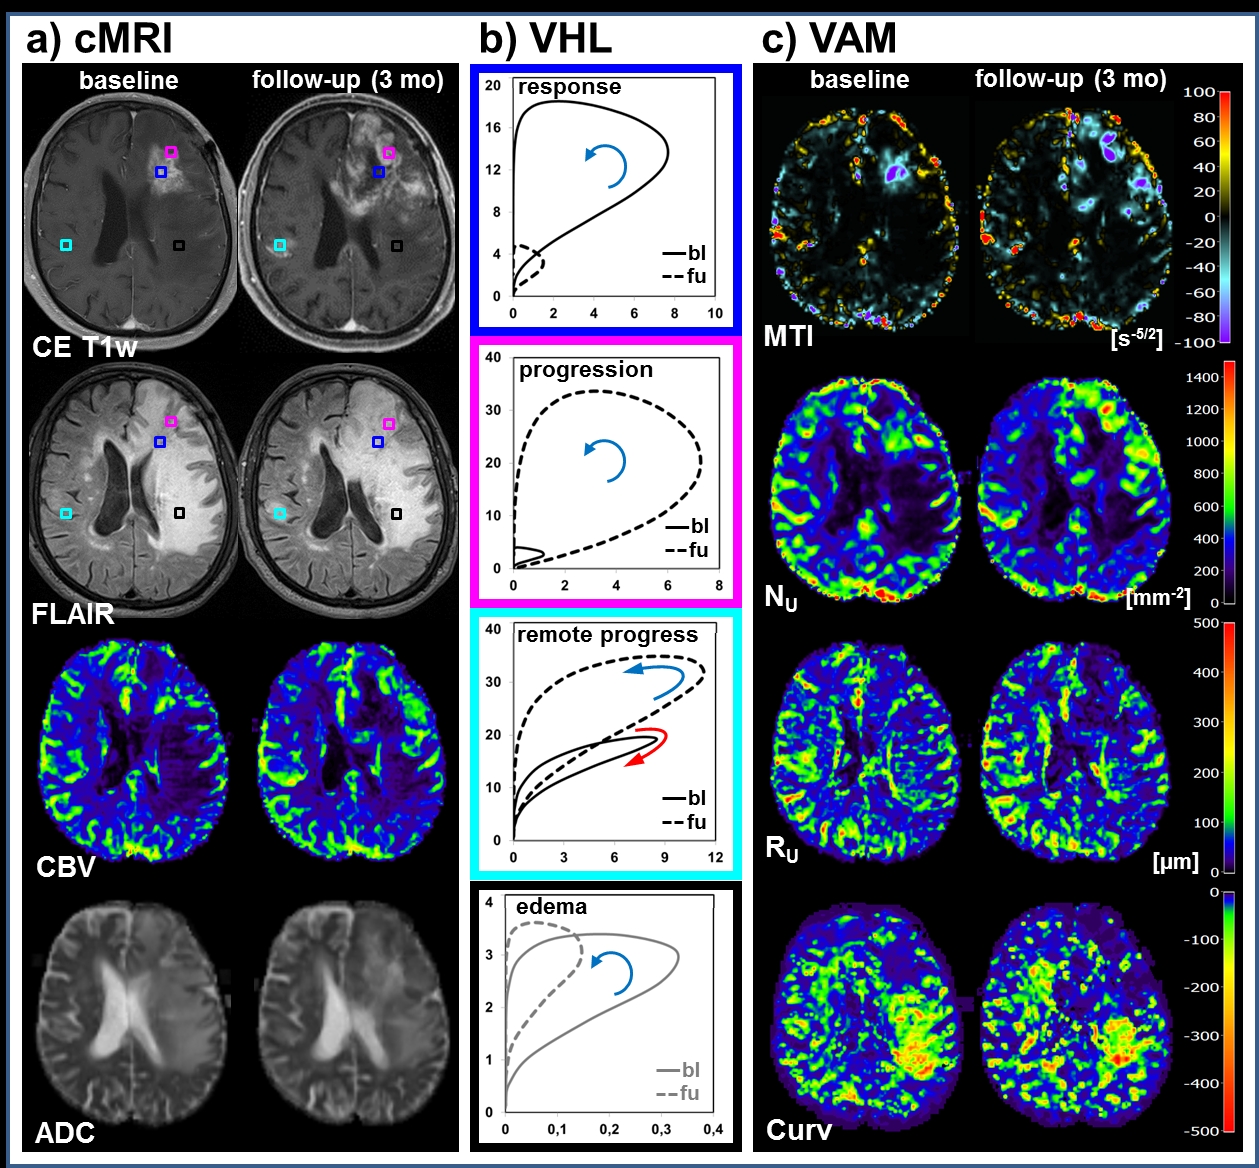
All 13 patients included in this study showed areas with response to bevacizumab (Fig.2), nine patients additionally showed non-response, and eight patients additionally showed a progression of the glioblastoma during antiangiogenic therapy (Fig. 2-4). Early response to bevacizumab was dominated by reduction of smaller microvasculature (around 10 µm). In the 3-month follow-up, responding tumors additionally showed a reduction in larger microvasculature (> 20µm; Fig.3). VAM biomarker images revealed spatially heterogeneous microvascular alterations during bevacizumab treatment. MTI may be useful to predict responding and non-responding tumor regions, and Curv to assess severity of vasogenic edema (Fig.5).Discussion
Analysis of VHLs in combination with the VAM approach demonstrated three features for investigation of the microvasculature of glioblastoma: i) Estimation of the microvascular compartments (ratio of larger vs. smaller microvessel): A voxel dominated by larger microvessels showed relatively higher max[ΔR2,GE] and vice-versa for a voxel dominated by smaller microvessels with higher max[ΔR2,SE]3/2. ii) Estimation of the microvascular type (arterioles vs. capillaries vs. venules): faster-inflow (arterioles-dominated) vs. slow-inflow (venules-dominated) assessed by rotational direction of the VHL (clockwise vs. counterclockwise). And iii) estimation of the spatial heterogeneity of neovascularization activity and its changes during antiangiogenic therapy by evaluating features i and ii via calculation of VAM biomarker images.Conclusion
Analysis of VHLs in combination with VAM biomarkers is capable of both, assessing the topological and structural heterogeneity of tumor microcirculation, and monitoring the response to and the progression during bevacizumab treatment. This approach may lead to a new perspective on investigating microvascular changes in glioma and on therapy monitoring.Acknowledgements
No acknowledgement found.References
1. Vidiri A, Pace A, Fabi A, Maschio M, Latagliata GM, Anelli V, Piludu F, Carapella CM, Giovinazzo G, Marzi S. Early perfusion changes in patients with recurrent high-grade brain tumor treated with Bevacizumab: preliminary results by a quantitative evaluation. J Exp Clin Cancer Res 2012;31:33.
2. Keunen O, Johansson M, Oudin A, et al. Anti-VEGF treatment reduces blood supply and increases tumor cell invasion in glioblastoma. Proc Natl Acad Sci U S A 2011;108:3749–3754.
3. Macdonald DR, Cascino TL, Schold SC, Cairncross JG. Response criteria for phase II studies of supratentorial malignant glioma. J. Clin. Oncol. 1990;8:1277–1280.
4. Hicklin DJ, Ellis LM. Role of the vascular endothelial growth factor pathway in tumor growth and angiogenesis. J Clin Oncol 2005;23:1011–1027.
5. Pope WB, Lai A, Nghiemphu P, Mischel P, Cloughesy TF. MRI in patients with high-grade gliomas treated with bevacizumab and chemotherapy. Neurology 2006;66:1258–1260.
6. Verhoeff JJ, van Tellingen O, Claes A, Stalpers LJ, van Linde ME, Richel DJ, Leenders WP, van Furth WR. Concerns about anti-angiogenic treatment in patients with glioblastoma multiforme. BMC Cancer 2009;9:444.
7. Stadlbauer A, Zimmermann M, Heinz G, Oberndorfer S, Doerfler A, Buchfelder M, Rössler K. Magnetic resonance imaging biomarkers for clinical routine assessment of microvascular architecture in glioma. J. Cereb. Blood Flow Metab. 2017;37:632–643.
8. Hsu Y-Y, Yang W-S, Lim K-E, Liu H-L. Vessel size imaging using dual contrast agent injections. J. Magn. Reson. Imaging 2009;30:1078–84.
9. Ducreux D, Buvat I, Meder JF, Mikulis D, Crawley A, Fredy D, TerBrugge K, Lasjaunias P, Bittoun J. Perfusion-weighted MR imaging studies in brain hypervascular diseases: comparison of arterial input function extractions for perfusion measurement. AJNR Am J Neuroradiol 2006;27:1059–1069.
Figures