4843
MRI-derived Oxygen Metabolism and Neovascularization Characterization for Grading and IDH Gene Mutation Detection of Gliomas1Department of Neurosurgery, University of Erlangen-Nürnberg, Erlangen, Germany, 2Institute of Medical Radiology, University Clinic of St. Pölten, St. Pölten, Austria, 3Department of Neuroradiology, University of Erlangen-Nürnberg, Erlangen, Germany, 4Department of Neurology, University Clinic of St. Pölten, St. Pölten, Austria
Synopsis
The purpose was to explore the diagnostic performance of combined physiological MRI of oxygen metabolism and neovascularization for glioma grading and characterization of isocitrate-dehydrogenase-1 (IDH1) gene mutation status. 83 patients with glioma WHO°II-IV were examined using vascular architecture mapping (VAM) and multiparametric quantitative BOLD (mp-qBOLD). Neovascularization correlated with increasing WHO° and microvessel type indicator (MTI) had the best diagnostic performance (AUC=0.782) for differentiation between glioma WHO°III and IV. IDH1-mutation was associated with significantly decreased cerebral metabolic rate of oxygen (CMRO2; P=0.037) in glioma WHO°II and significantly increased (P=0.013) MTI in glioma WHO°III, resulting in best diagnostic performance for IDH1-mutation detection.
Introduction
Reprogramming energy metabolism and angiogenesis are counted among the hallmarks of cancer (1). The current WHO classification system distinguishes low-grade glioma (LG, WHO°II) from high-grade glioma (HG, WHO°III and IV) by the presence of microvascular proliferation as diagnostic criterion and prognostic parameter (2). IDH1-mutation (IDH1mut) has significant effects on higher survival, increased chemosensitivity, and reduced hypoxia-inducible-factor-1α (HIF1α) compared to IDH1 wildtype (IDH1wt) glioma (3). Furthermore, a biological link between neovascularization and oxygen metabolism is generally accepted (4). The purpose was to explore the diagnostic performance of combined physiological MRI of oxygen metabolism and neovascularization for glioma grading and characterization of IDH1-gene mutation status.Methods
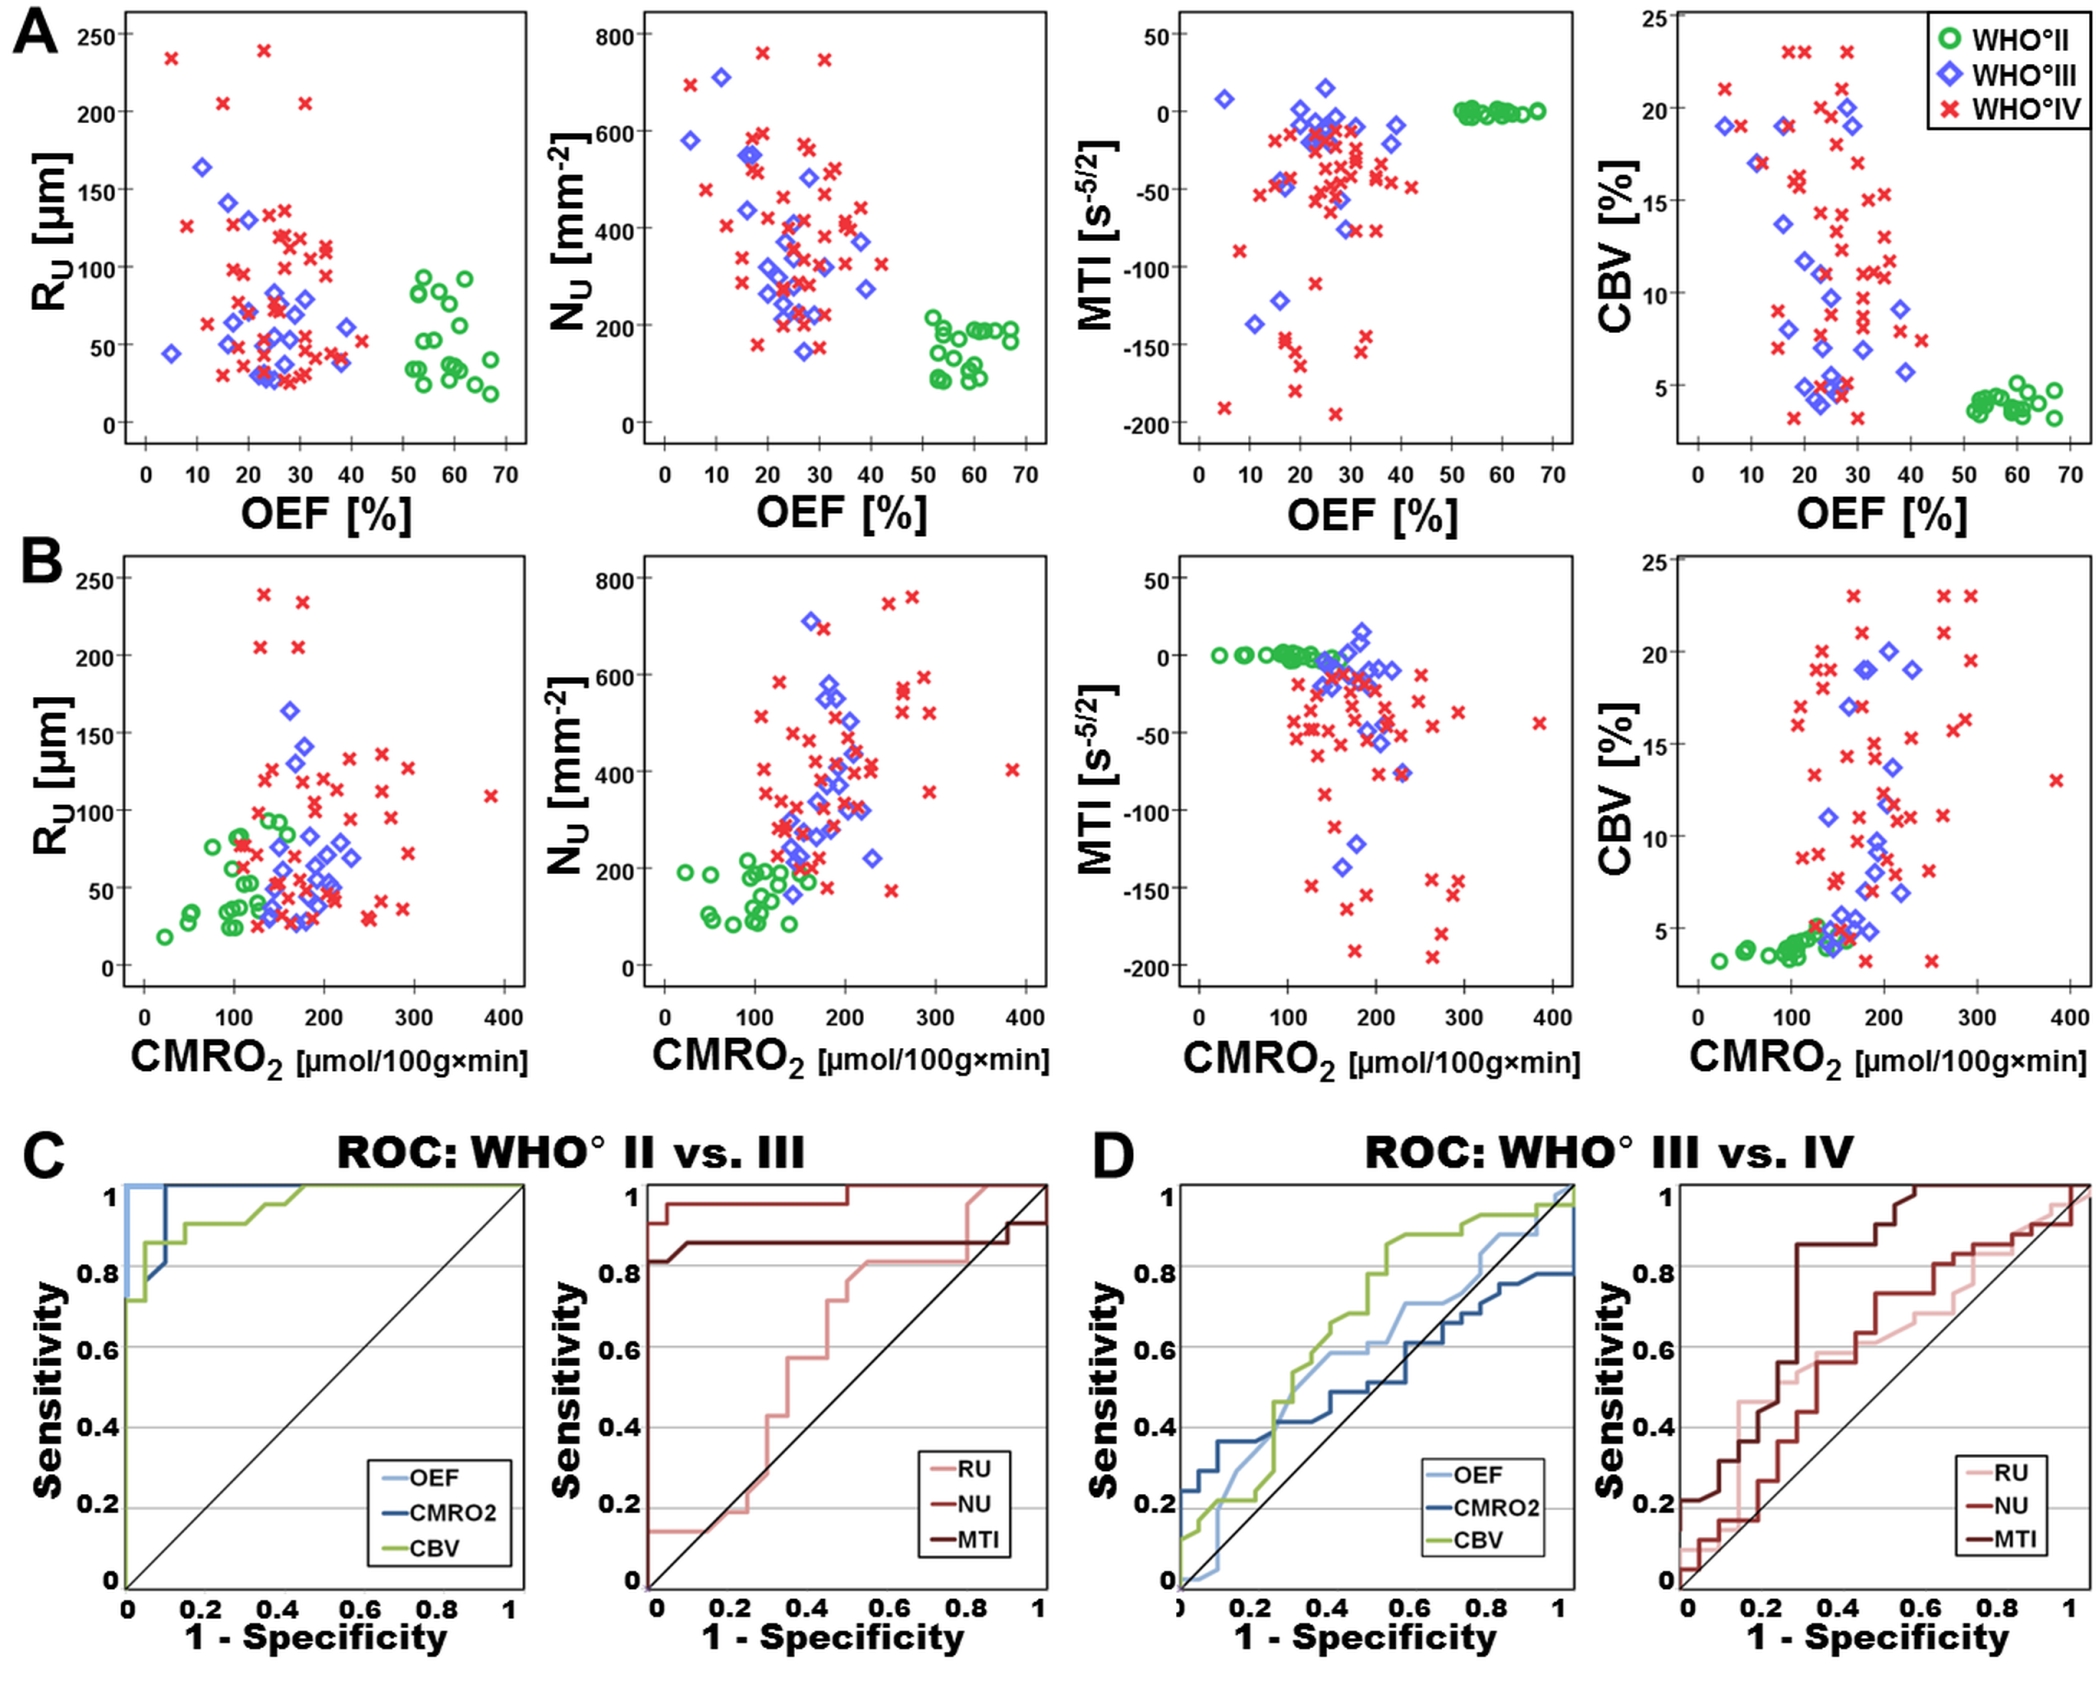
83 patients with histopathologically proven glioma (WHO° II–IV) were examined at 3 Tesla (Trio, Siemens) using vascular architecture mapping (VAM) (5,6) and multiparametric quantitative BOLD (mp-qBOLD) (7) as part of the routine MRI protocol. For VAM a dual contrast agent injections approach was used to obtain GE- and SE-EPI DSC perfusion MRI data (5). To minimize patient motions the head of the patients were fixated as well as clear and repeated patient instructions before and during the MRI examination were provided. To prevent differences in the time to first-pass peak between the two DSC examinations, a peripheral pulse unit (PPU) which was fitted to a patient’s finger to monitor heart rate and cardiac cycle. Special attention was paid to perform the two injections at the same heart rate and exactly at the same phase of the cardiac cycle, i.e. at PPU’s peak systole signal. For mp-qBOLD, additional T2*- and T2-mapping sequences were performed. Geometric parameters (in-plane resolution: 1.8 x 1.8 mm, slice thickness: 4 mm; 29 slices) were identical for VAM and mp-qBOLD sequences. Custom-made in-house MatLab software was used for VAM and mp-qBOLD data postprocessing and comprising the following 5 main steps: 1) calculation of CBV and CBF maps from GE-EPI DSC data; 2) calculation of T2* and T2 maps; 3) calculation of maps of the oxygen metabolism MRI biomarkers oxygen extraction fraction (OEF) and cerebral metabolic rate of oxygen (CMRO2); 4) calculation of versus diagrams (vascular hysteresis loops, VHLs) from GE- and SE-EPI DSC data; and 5) calculation of maps of the vascular architecture MRI biomarkers microvessel radius (RU), density (NU) (8), and type indicator (MTI). Receiver-operating characteristic analyses determined diagnostic performance for grading and detection of IDH1-gene mutation status.Results
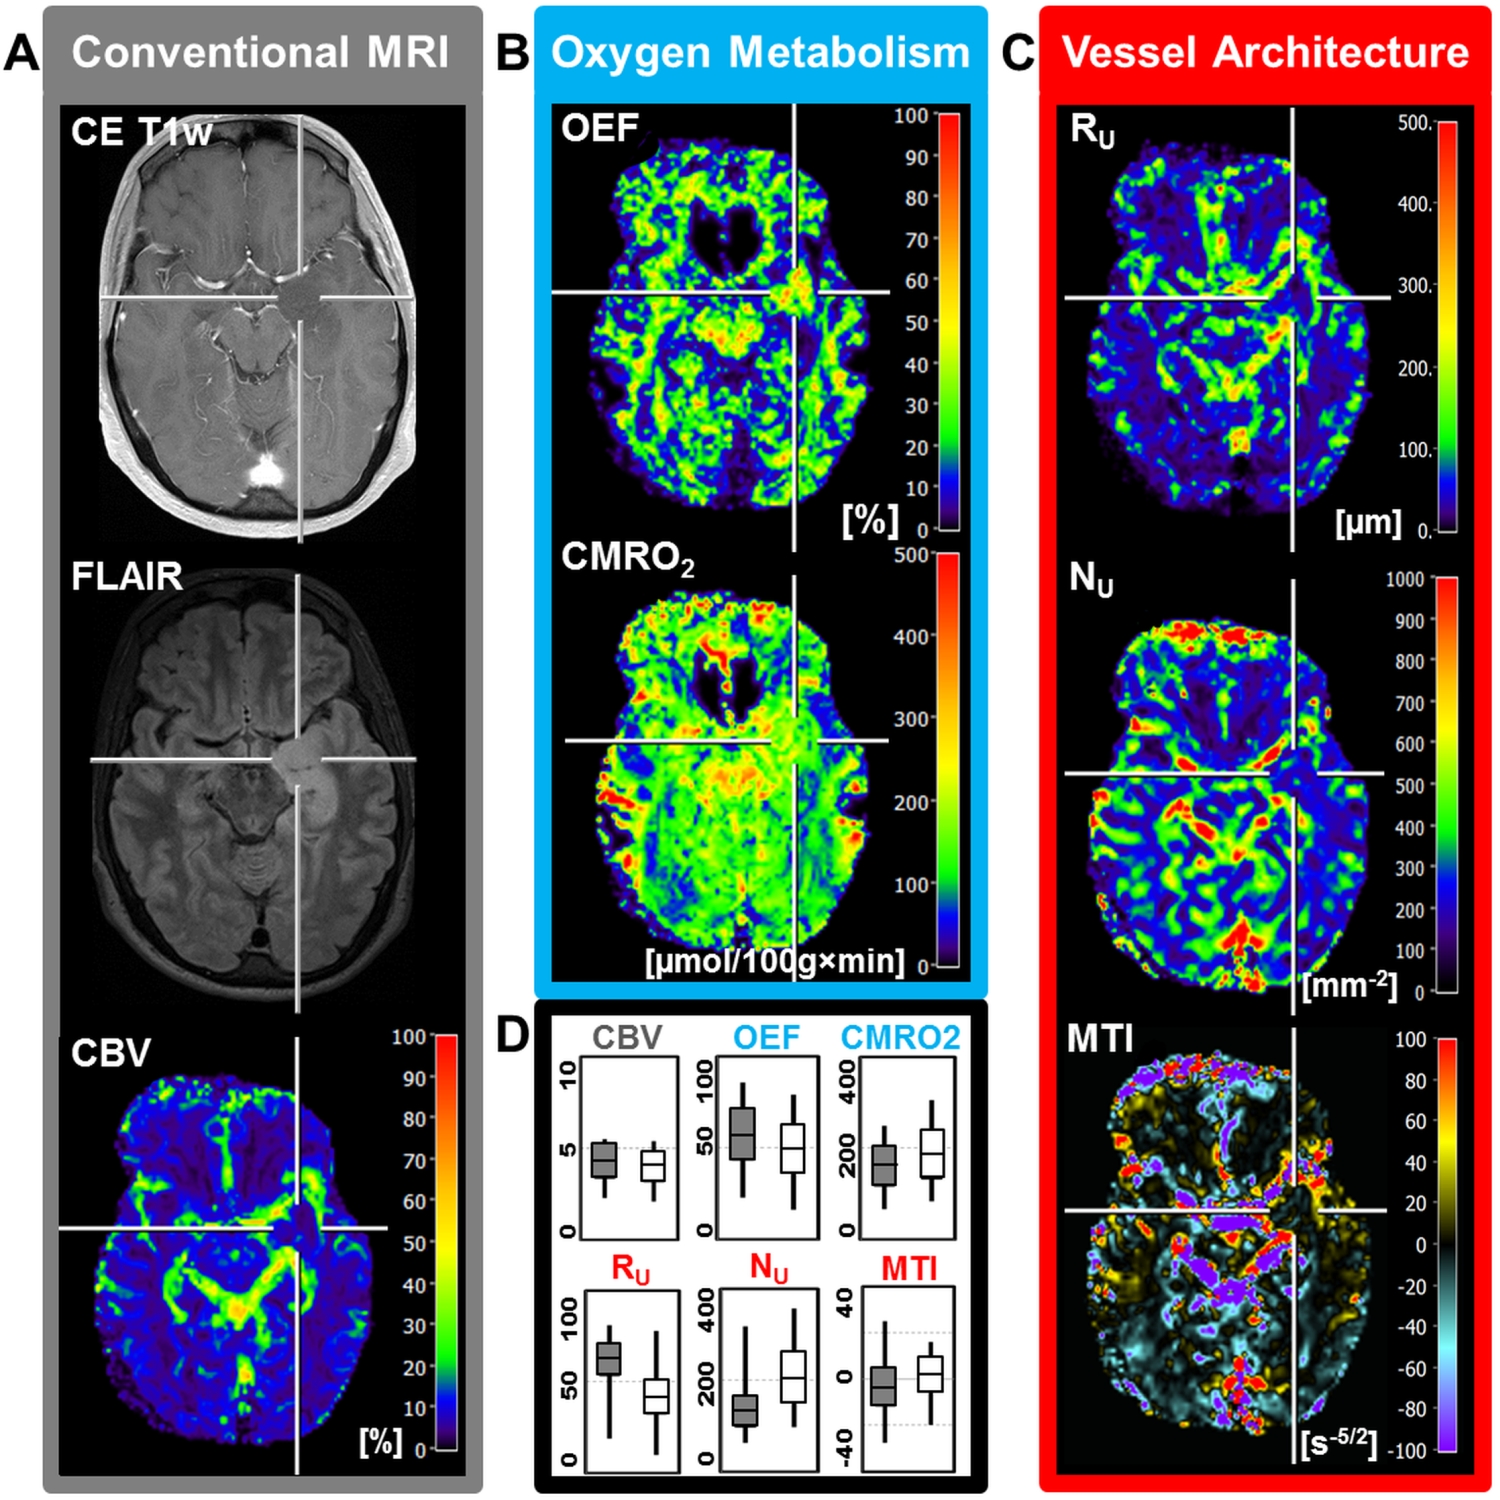
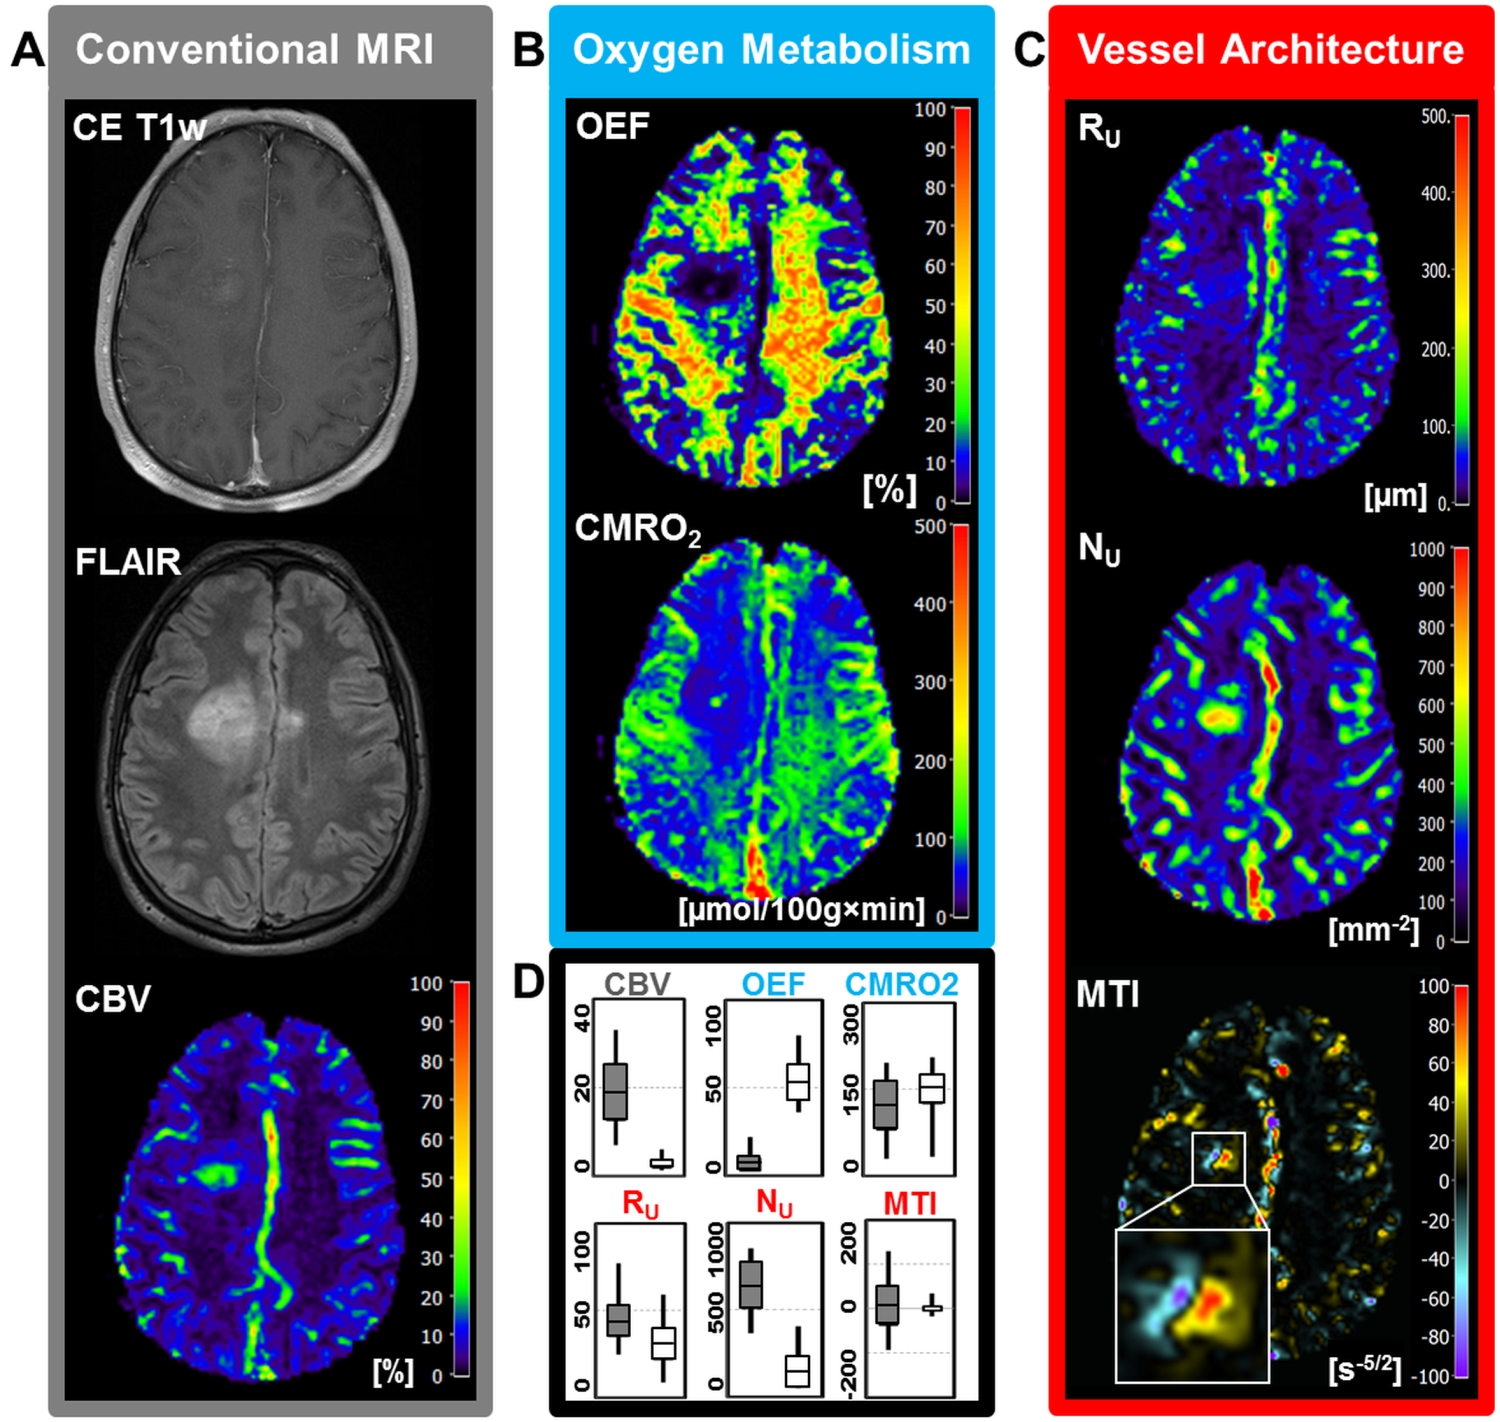
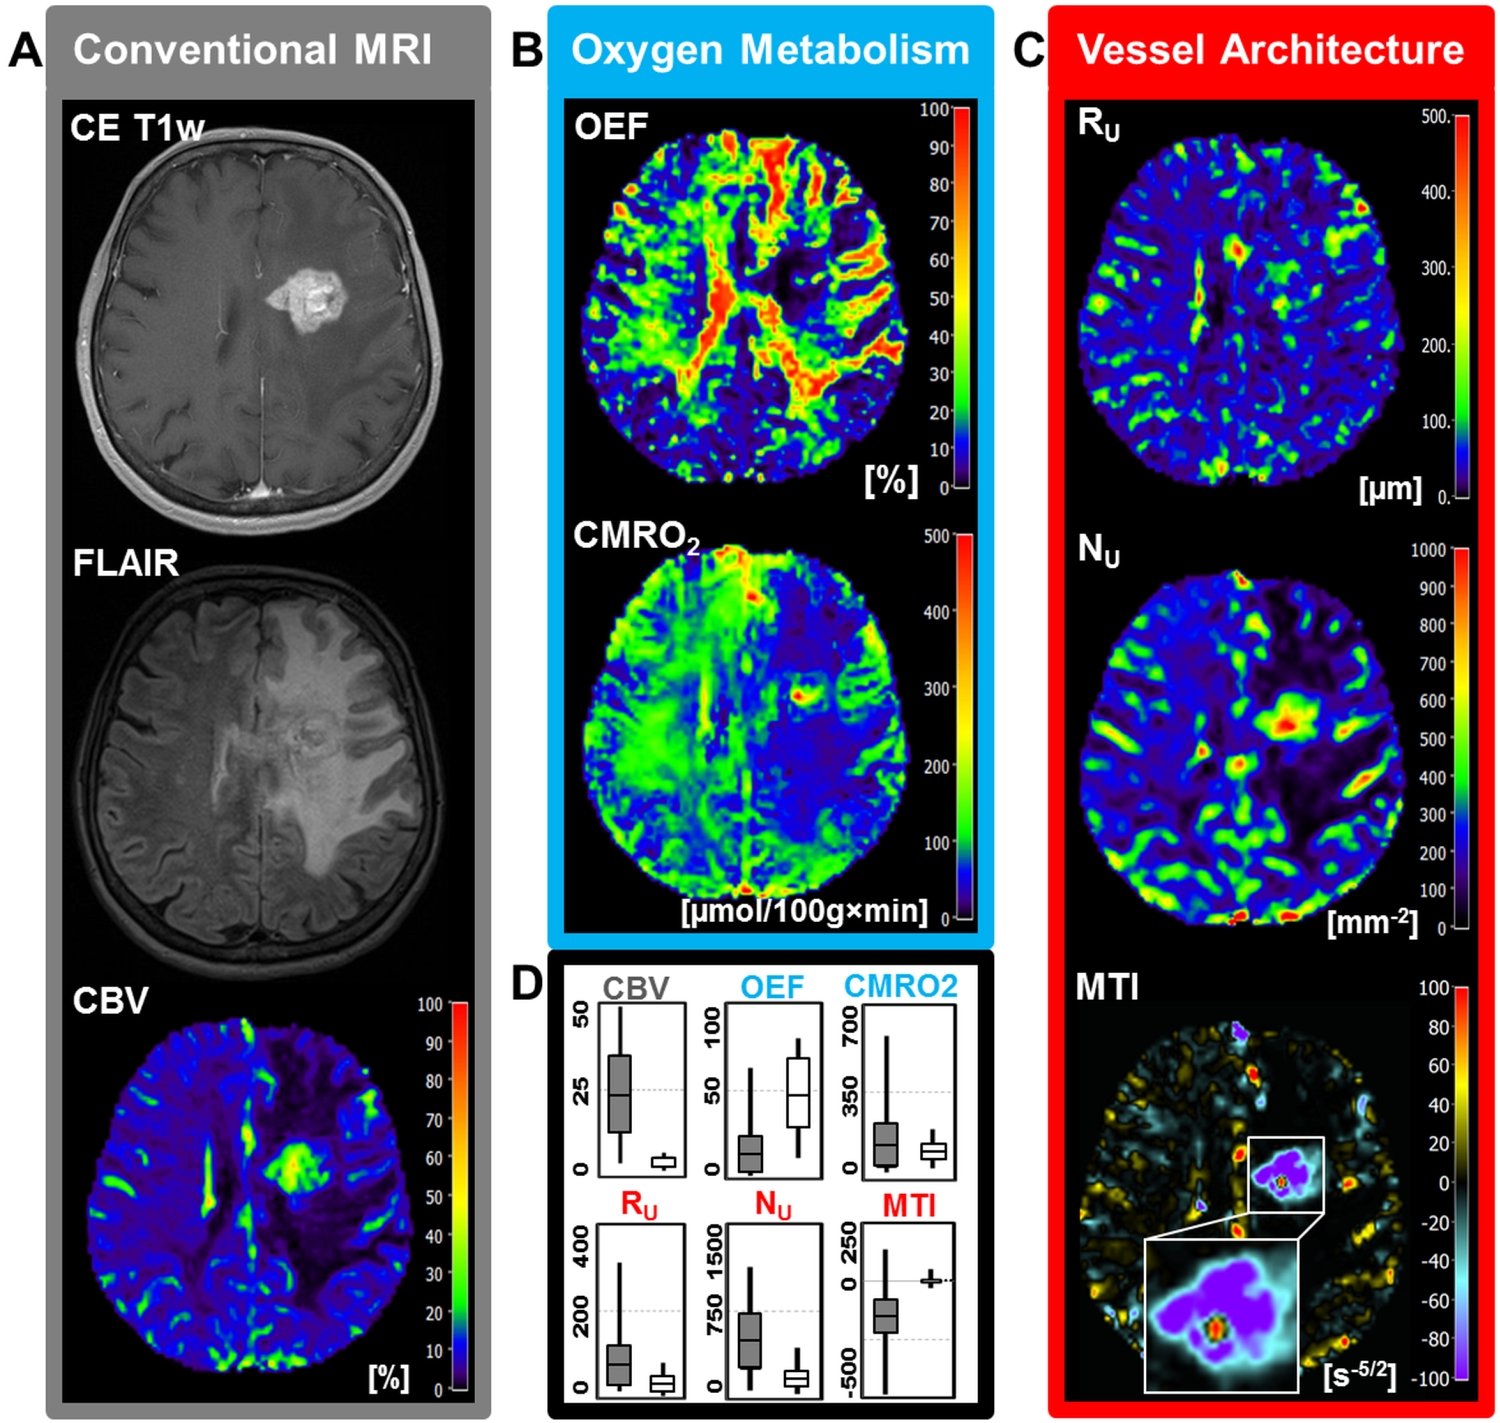
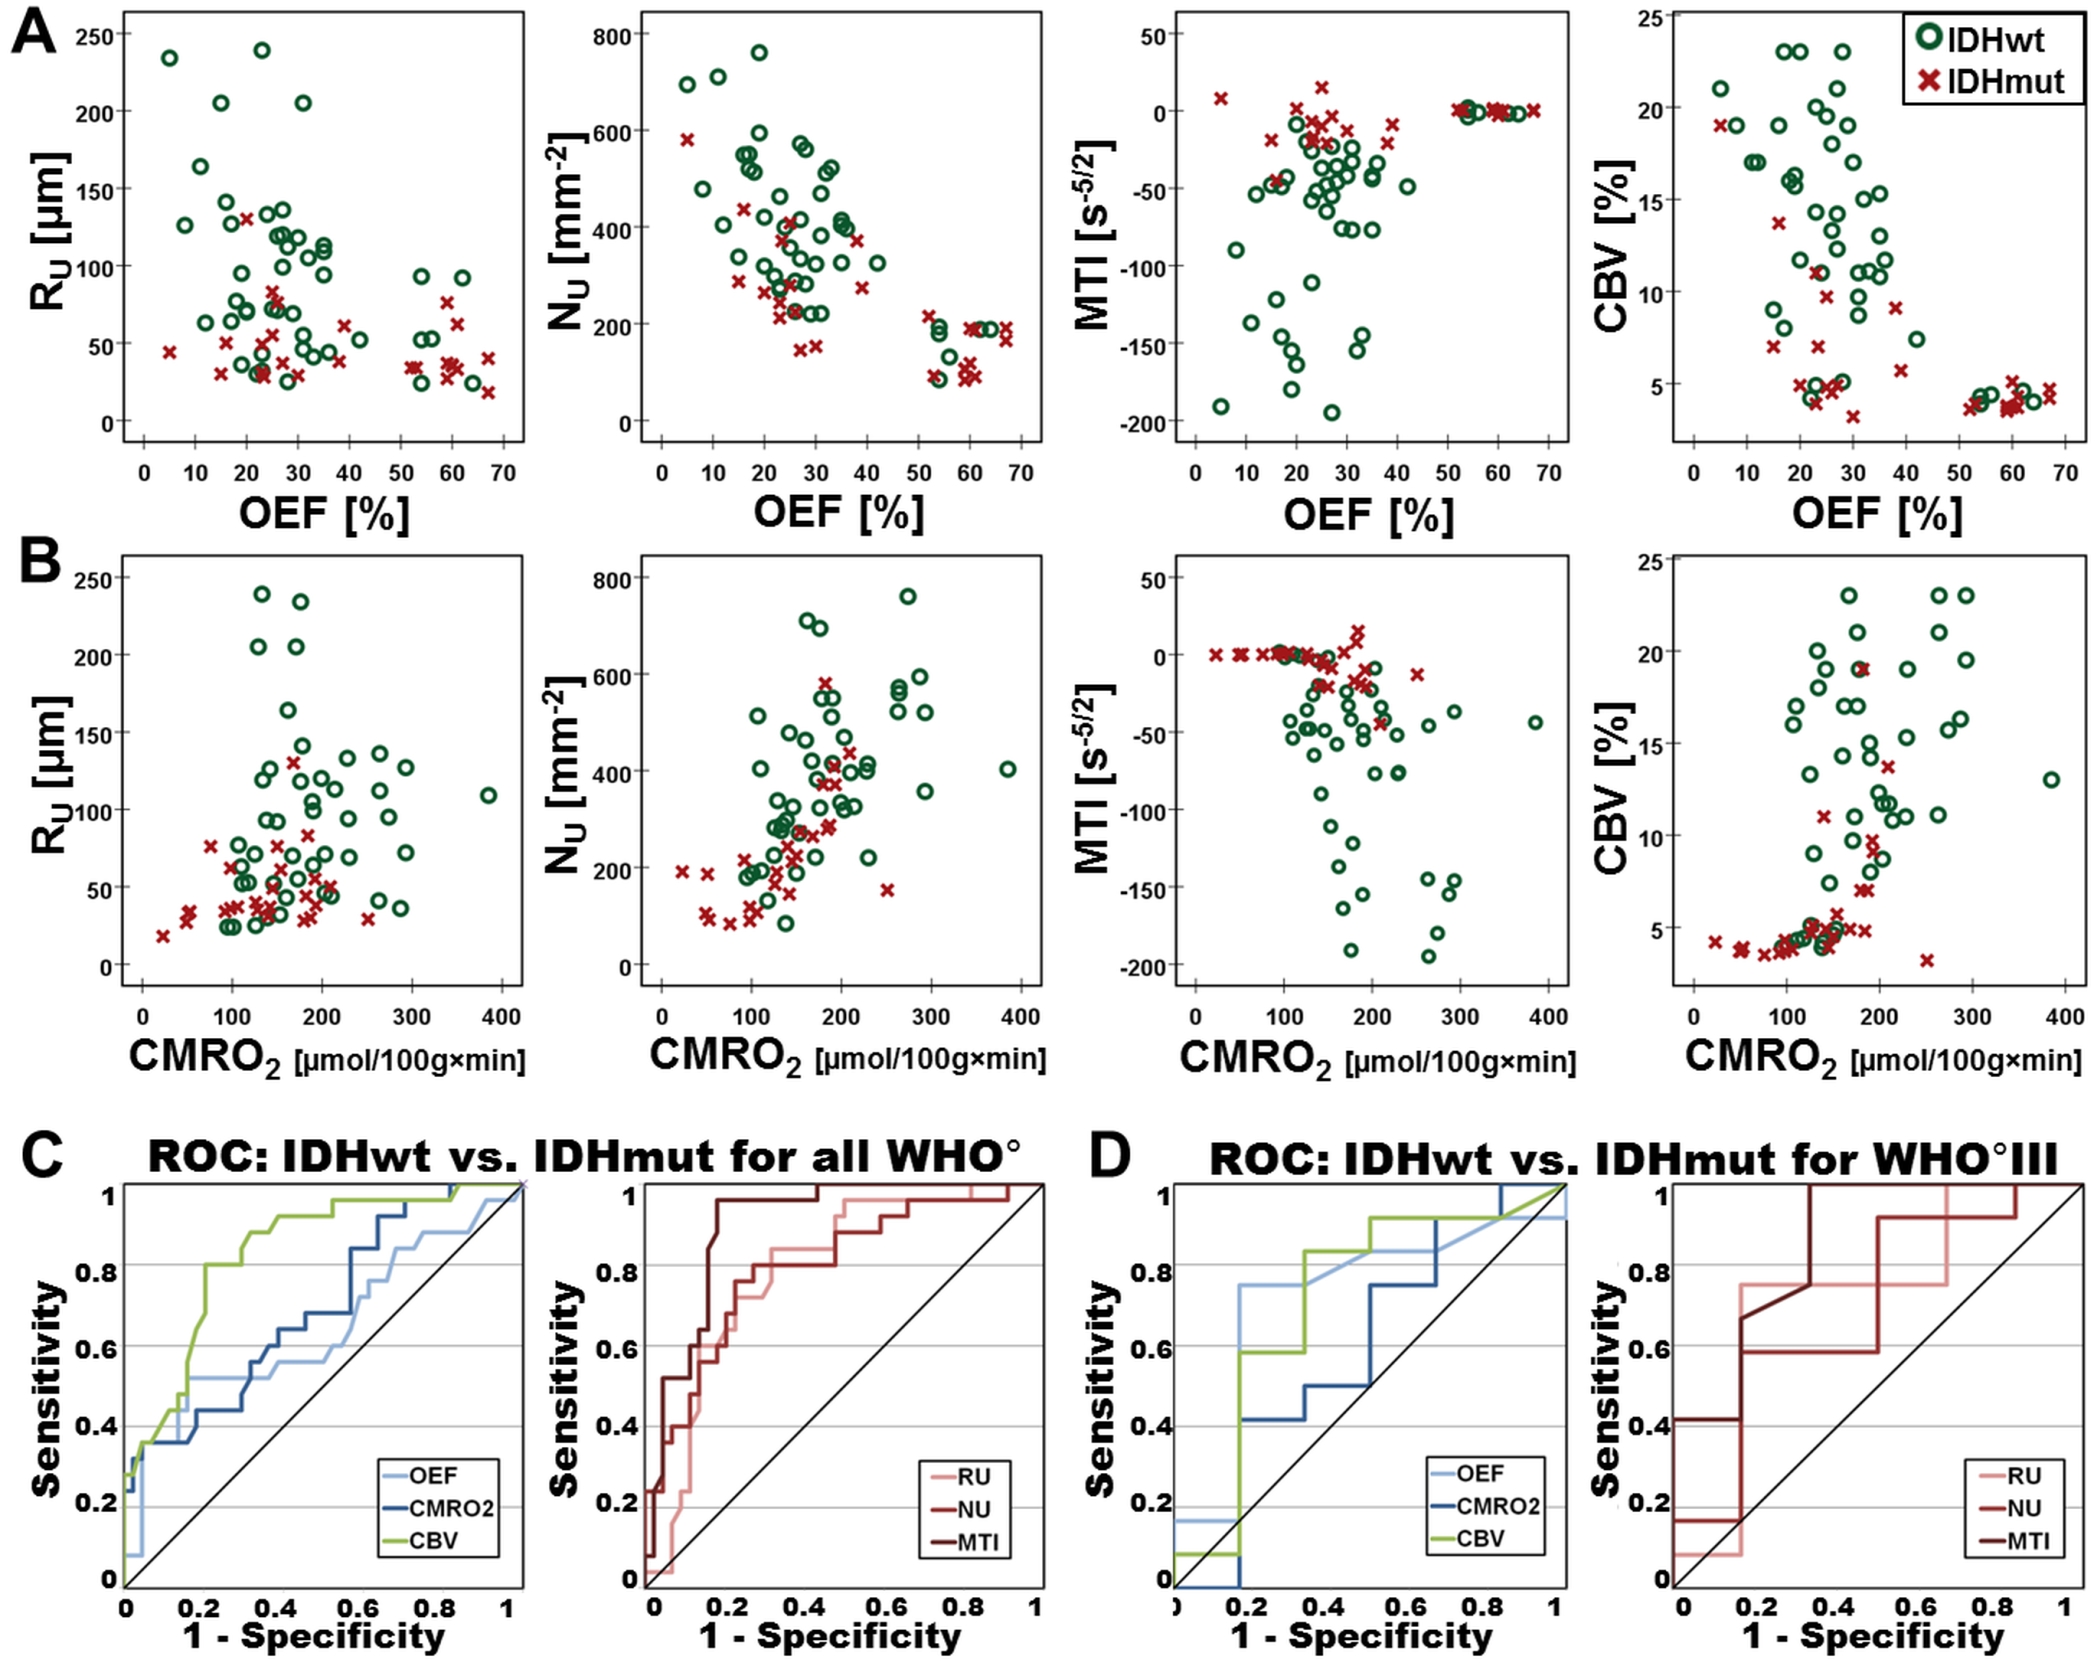
Low-grade glioma (LG, WHO° II) showed areas with increased oxygen extraction fraction (OEF, +18%; P < 0.001; N = 20; Fig. 1) whereas anaplastic glioma (WHO° III, Fig. 2) and glioblastoma (WHO° IV; Fig. 3) showed decreased OEF compared to normal brain: -54%; P < 0.001; N = 21; and -49%; P < 0.001; N = 41, respectively. This allowed clear differentiation between LG and HG (AUC = 1) for our patient cohort. MTI had the highest diagnostic performance (AUC = 0.782) for differentiation between glioma grade III and IV among all biomarkers (Fig. 4). CMRO2 was decreased (P = 0.037) in LG with mutated IDH1-gene, and MTI was significantly increased in glioma grade III with IDH1 mutation (P = 0.013) compared to their IDH1-wildtype counterparts. CMRO2 showed the highest diagnostic performance for IDH1-gene mutation detection in LG (AUC = 0.818), and MTI in HG (AUC = 0.854) and for all WHO grades (AUC = 0.899) among all biomarkers (Fig. 5).Discussion
Our findings are in accordance with commonly accepted knowledge about the mechanisms of glioma-associated neovascularization and the role of oxygen metabolism in these processes (9). While LG (WHO°II) grow along preexisting vessels via vascular co-option, HG (WHO°III and IV) start to generate own tumor vessels in the process of growing. Vascular co-option is the first mechanism by which gliomas achieve their vasculature, e.g. in LG or in the infiltration zone of HG (9). This is associated with additional oxygen consumption by the tumor cells and hence with increased extraction of oxygen from the co-opted vessels. Involution of co-opted vessels resulted in tumor hypoxia, upregulation of proangiogenic factors, and a shift toward an angiogenic phenotype. Vascular co-option is followed by the development of new vessels in high-grade glioma via the mechanisms of neovascularization which results in dilated and tortuous vessels as well as abnormal branching and arteriovenous shunts. The abnormal and inefficient vascular network is associated with abnormally increased perfusion which leads to decreased OEF with simultaneously increased CMRO2.Conclusion
MRI-derived oxygen metabolism and neovascularization characterization may be useful for grading and IDH1 mutation detection of gliomas and requires only seven minutes of extra scanning time.Acknowledgements
No acknowledgement found.References
1. Hanahan D, Weinberg RA. Hallmarks of cancer: The next generation. Cell 2011;144:646–674.
2. Abdulrauf SI, Edvardsen K, Ho KL, Yang XY, Rock JP, Rosenblum ML. Vascular endothelial growth factor expression and vascular density as prognostic markers of survival in patients with low-grade astrocytoma. J Neurosurg 1998;88:513–520.
3. Turkalp Z, Karamchandani J, Das S. IDH mutation in glioma: new insights and promises for the future. JAMA Neurol. 2014;71:1319–25.
4. Semenza GL. Targeting HIF-1 for cancer therapy. Nat. Rev. Cancer 2003;3:721–732..
5. Stadlbauer A, Zimmermann M, Heinz G, Oberndorfer S, Doerfler A, Buchfelder M, Rössler K. Magnetic resonance imaging biomarkers for clinical routine assessment of microvascular architecture in glioma. J. Cereb. blood flow Metab. 2017;37:632–643.
6. Emblem KE, Mouridsen K, Bjornerud A, et al. Vessel architectural imaging identifies cancer patient responders to anti-angiogenic therapy. Nat Med 2013;19:1178–1183.
7. Christen T, Schmiedeskamp H, Straka M, Bammer R, Zaharchuk G. Measuring brain oxygenation in humans using a multiparametric quantitative blood oxygenation level dependent MRI approach. Magn. Reson. Med. 2012;68:905–911.
8. Jensen JH, Lu H, Inglese M. Microvessel density estimation in the human brain by means of dynamic contrast-enhanced echo-planar imaging. Magn. Reson. Med. 2006;56:1145–1150.
9. Hardee ME, Zagzag D. Mechanisms of glioma-associated neovascularization. Am. J. Pathol. 2012;181:1126–1141.
Figures