4839
Brain Perfusion and Structure Variation of Patients with Unilateral Middle Cerebral Artery Stenosis1Radiology, Peking Union Medical College Hospital, Peking Union Medical College, Beijing, China, 2Siemens Healthcare, MR Collaborations NE Asia, Beijing, China, 3Peking Union Medical College Hospital, Peking Union Medical College, Chinese Academy of Medical Sciences, Beijing, China
Synopsis
To investigate the brain structure variation of patients with chronic unilateral middle cerebral artery (MCA) stenosis, a volume-based quantitative segmentation method was used to measure the morphological changes of brain structure. A correlation analysis was performed to find the relationship between the morphometry and cerebral blood perfusion. The results showed that the patients had atrophy in many brain regions within the MCA territory. And the perfusion status may have impact on the atrophy process.
INTRODUCTION
As one of the most important etiologic cause of ischemic stroke worldwide, intracranial atherosclerotic stenosis (ICAS) has attracted a great deal of attentions from both neurology and radiology societies. However, it still remains unclear if the chronic ICAS and its’ perfusion status would lead to brain structure changes. This research aims to use a volume-based segmentation MRI technique to investigate the brain structures’ variety in patients with MCA stenosis. The relationship between the variation of brain morphometry and cerebral blood flow (CBF) within MCA territory was further investigated.METHODS
The research consecutively recruited 35 patients (23 males, age: 55.0 ±12.2 years) with severe cerebrovascular stenosis (>70%) or occlusion of the unilateral MCA and 20 healthy volunteers (12 males, age: 59.7±7.8 years) as control.8 patients showed absence of symptoms before the exam, and 16 patients only experienced transient ischemic attack (TIA), the rest 12 patients had cerebral infarction (CI). All data were acquired on a MAGNETOM Skyra 3T MR scanner (Siemens Healthcare, Erlangen, Germany) with a 20-channel head-neck coil. A prototype MEMPRAGE sequence was used to collect the structure images with the following parameters: TI/TE1/TE2/TE3/TE4/TR/Voxel Size/FOV/number of slices = 900ms/1.69ms/3.3ms/4.91ms/6.52ms/2300ms/1x1x1mm3/256×256mm2/176. The sequence was combined with a prototype Morphobox post-processing algorithm[1] , the quantitative volume of 48 brain regions in two side hemisphere could be obtained right after scan. Quantitative CBF values were measured by applying a prototype multi-inversion time pulse arterial spin labeling (mTI-ASL) sequence with the following parameters[2] : TR/TE/slice thickness/FOV/voxel size/bolus length = 4600/22ms/4mm/220 × 220mm2/3.4 x 3.4 × 4.0mm3/700ms, 16 TIs from 480 to 4080ms, and total acquisition time = 5:09 min including an M0 scan. The volume change ratio (Rvolume) was calculated by dividing the volume of the stenosis side by the volume of the normal side, while for healthy controls the ratio was the volume of the left side divided by that of the right side. The CBF ratio (RCBF) was calculated in a similar way. The difference between the Rvolume of patients and controls were analyzed using a two sample t-test. The ANOVA analysis was applied to find the differences of Rvolume among three groups of patients and controls, and SNK analysis was further performed as the post-hoc test. The relationship between RCBF and Rvolume was investigated using Pearson Correlation Coefficient Analysis. All statistical analysis was performed by SPSS 20.RESULTS
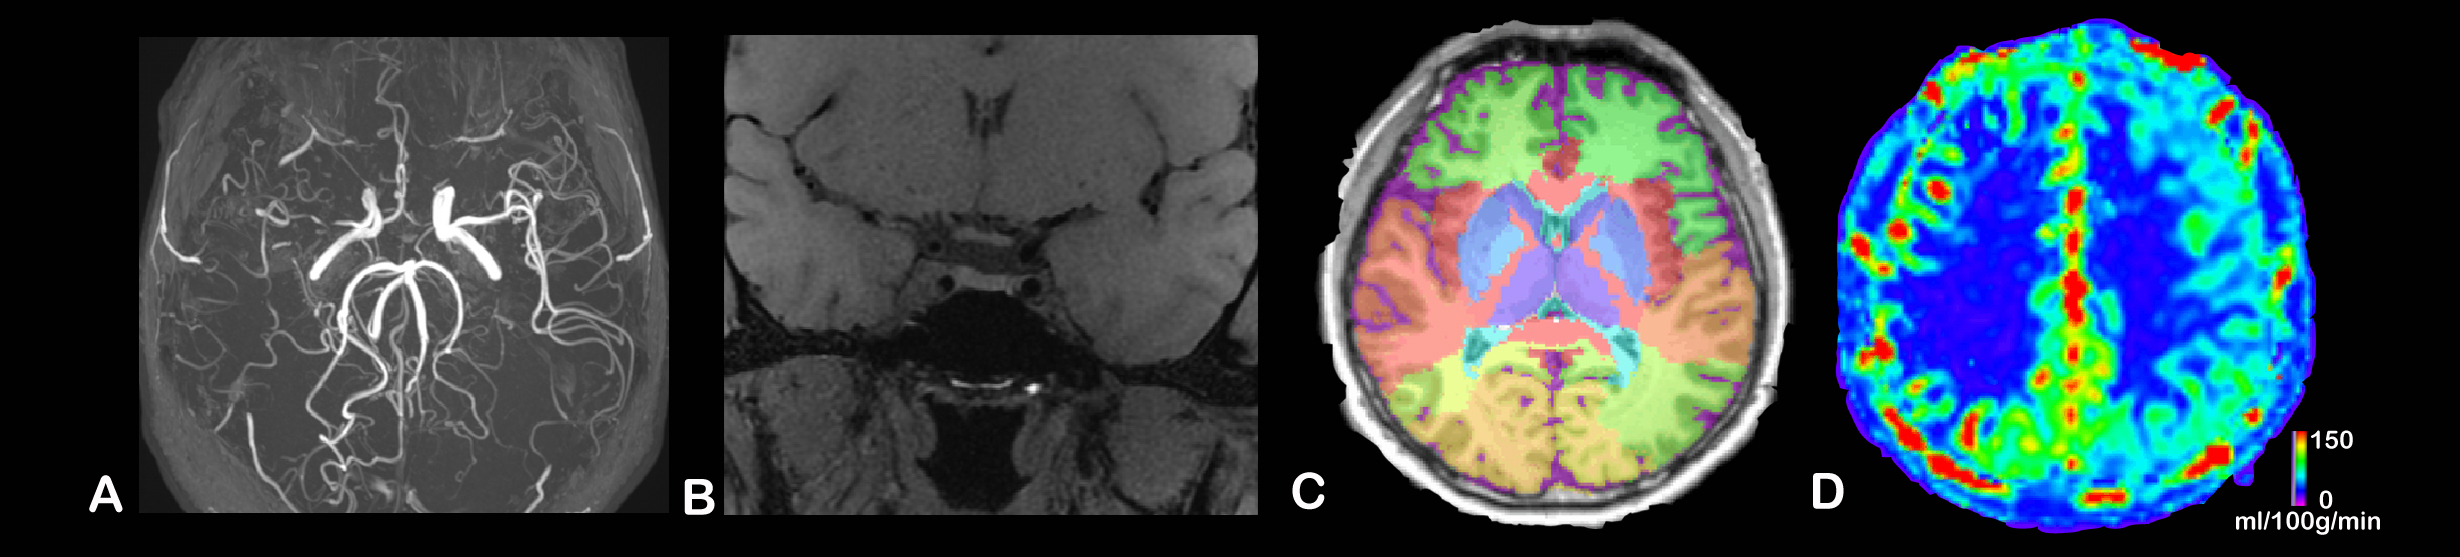
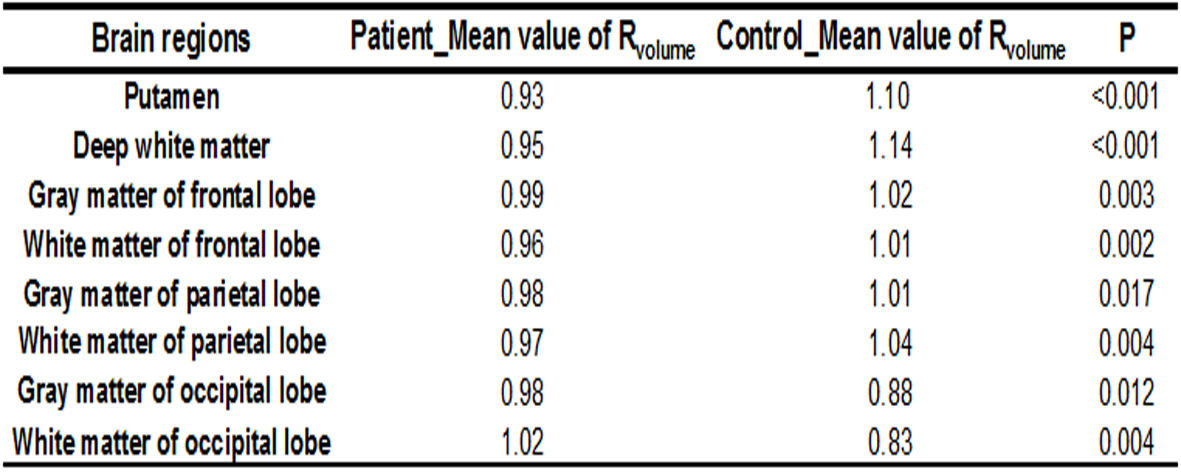
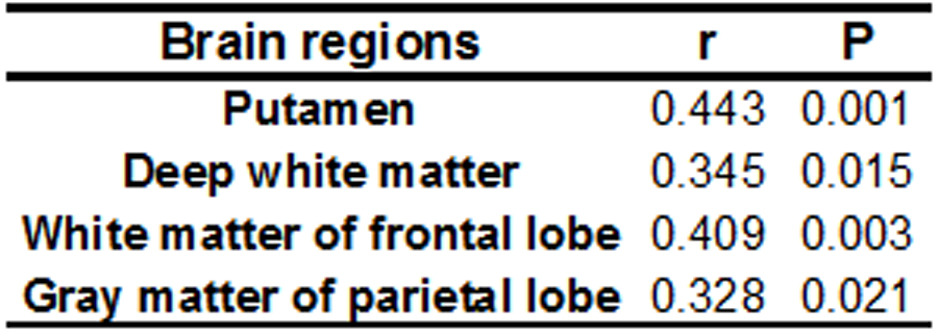
igure1 shows the MR images of one patient. Among all the brain regions, several regions showed volume reduction on the stenosis side in patients compared with healthy controls. Those regions were putamen, deep white matter,gray matter of frontal lobe, white matter of frontal lobe, gray matter of parietal lobe, and white matter of parietal lobe. Whereas in the regions of the gray matter of occipital lobe and white matter of occipital lobe, the Rvolume of patients was significantly higher than controls. Mean values of Rvolume and the P values are listed in Table1. After dividing the patients into three categories by their symptoms, we saw that compared with control group/ non-symptom group/TIA group, the CI group had significant lower Rvolume values in the following regions: thalamus, insula, gray matter of temporal lobe, and white matter of temporal lobe (table2). In addition, the outcomes showed positive correlation between the RCBF values and Rvolume values in some regions (putamen, deep white matter,white matter of frontal lobe and gray matter of parietal lobe), the r values and p values are listed in table3.DISCUSSION
The volume-based MRI morphometry analysis method can provide quantitative morphological information for analyzing the variation of patients’ brain structures. For chronic ICAS patients, the stenosis of MCA may induce the atrophy of brain regions in their territory. Meanwhile, the patients with symptoms show severer atrophy than healthy and symptomless patients.Considering about the correlation between perfusion and volume, it proves that the low CBF may result in the decrease of oxygen and nutrient providing for those regions, and the ischemic may finally cause the atrophy. Regarding the increase of some regions in patients group, it may result by the reason of compensation.The results of this study show a great potential of MRI in evaluating the prognosis of patients and may guide the treatments to slow down the development of diseases.Acknowledgements
The authors would like to thank Dr. Bénédicte Maréchal and Dr. Josef Pfeuffer from Siemens Healthcare for the development and sharing of the Morphobox post-processing and mTI-ASL sequence prototypes.References
1. Schmitter D, Roche A, Maréchal B, et al. An evaluation of volume-based morphometry for prediction of mild cognitive impairment and Alzheimer's disease[J]. NeuroImage: Clinical, 2015, 7: 7-17.
2. Yang S, Zhao B, Wang G, et al. Improving the Grading Accuracy of Astrocytic Neoplasms Noninvasively by Combining Timing Information with Cerebral Blood Flow: A Multi-TI Arterial Spin-Labeling MR Imaging Study[J]. American Journal of Neuroradiology, 2016.
Figures