4826
Oxygen extraction fraction is elevated in acute stroke with evidence of preserved metabolism: a quantitative susceptibility MRI study1Stanford University, Stanford, CA, United States, 2Charité Universitätsmedizin Berlin, Berlin, Germany, 3Max Planck Institute for Human Cognitive and Brain Sciences, Leipzig, Germany, 4Concordia University, Montreal, QC, Canada
Synopsis
We utilized a novel MRI susceptibility method to quantify oxygen extraction fraction (OEF) in cortical vessels of 22 patients with acute stroke. The observed OEF ratio between affected and contralateral hemispheres depended on patient perfusion status, and tended to normalize (decrease) in follow-up scans on average 3 days later. Stroke cases with substantial perfusion-diffusion mismatch (indicative of potentially salvageable penumbra) showed the greatest OEF elevation (OEF ratio = 1.2 ± 0.1). Patients with large mismatch also showed an inverse relationship between OEF and relative cerebral blood flow (from dynamic susceptibility contrast), suggestive of mechanisms to maintain tissue oxygen metabolism even in ischemic tissue.
Introduction
Several positive, multi-center clinical trials of new endovascular therapies [1] have recently reinvigorated the stroke community, highlighting the need for imaging biomarkers to identify good candidates for treatment. Elevated oxygen extraction fraction (OEF) is a known marker of potentially salvageable tissue (penumbra) in stroke that may benefit from therapy [2], but is notoriously challenging to quantify especially in clinical settings. This study tests whether a new MRI approach, quantitative susceptibility mapping (QSM) [3,4], can detect abnormal OEF (%) along cerebral veins in patients with ischemic stroke and how it relates to their perfusion status.Methods
Acute stroke patients were recruited from the LOBI study (clinicaltrials.org: NCT02007582) at the Center for Stroke Research Berlin, excluding cases who had undergone hemorrhagic transformation to avoid severe susceptibility artifacts. Twenty-two patients (ages 44-89 years) were admitted with median NIHSS score of 4 (interquartile range of 2 – 7.5) and were scanned on average 17.4 hours after stroke onset at 3T. Flow-compensated gradient echo phase images were acquired for OEF assessment: TR/TE = 20/12ms; 0.63x0.63x0.8 mm3; bandwidth = 220Hz/pixel; 2x GRAPPA acceleration; scan time ~5 min. We acquired dynamic susceptibility contrast MRI to evaluate mean transit time (MTT) and cerebral blood flow (CBF); diffusion weighted imaging (DWI) to characterize the infarct; and post-contrast T1-weighted scans to visualize vasculature. Eleven patients received a follow-up QSM scan on average 3.1 days after the first scan; 4 of these patients received thrombolysis before the first scan.
QSM volumes were reconstructed through a dipole inversion of the phase images, using a truncated k-division approach that corrects for the point spread function [5]. On the QSM images, susceptibility values in veins (χvein) are sensitive to oxygenation levels due to the presence of paramagnetic deoxyhemoglobin molecules in venous blood. At least 3 cortical veins were identified near the infarct (within 5mm of the DSC perfusion lesion) and 3 veins were identified in the contralateral hemisphere for OEF assessment. We quantified OEF = 1 – (χvein - χwater)/(Δχdo x Hct) where χvein was estimated from the 10% brightest voxels in the vessel, Δχdo = 0.27ppm, and χwater was estimated from CSF.
Results
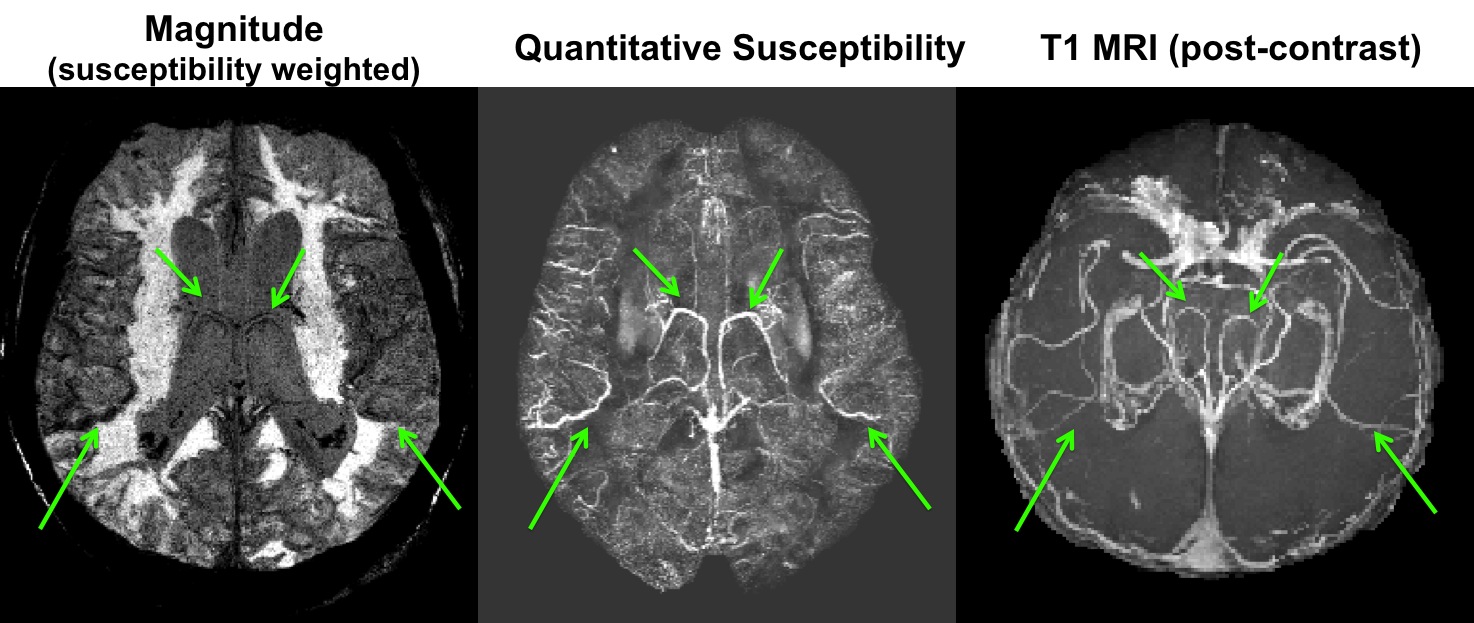
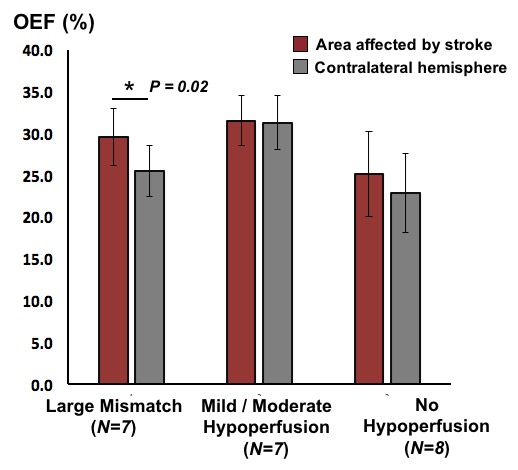
Bright signal on QSM maps corresponded to venous structures seen on post-contrast T1 scans that were amenable to OEF quantification (Figure 1). The DSC data was analyzed with Stroketool and patients were classified into groups with large perfusion-diffusion mismatch (N=7); with mild or moderate hypoperfusion (N=7); and with no hypoperfusion (N=8) by visually inspecting the MTT maps and DWI images. Patients with large mismatch showed significant OEF difference between affected and contralateral areas (P = 0.02), with mean OEF ratio of 1.2 ± 0.1 (Figure 2). On the other hand, no similar OEF difference was observed in patients with mild-moderate hypoperfusion (OEF ratio = 1.0 ± 0.1) or in patients with no hypoperfusion (OEF ratio = 0.9 ± 0.2).
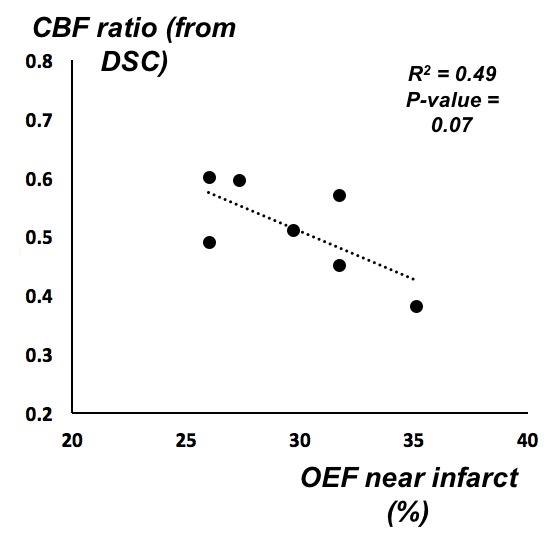
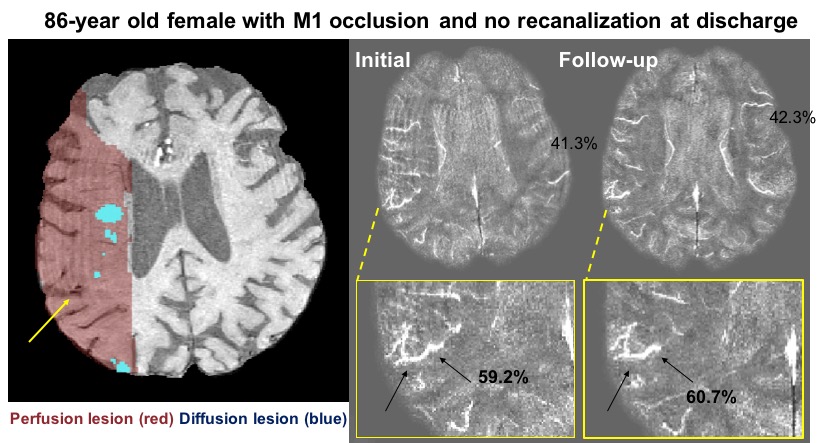
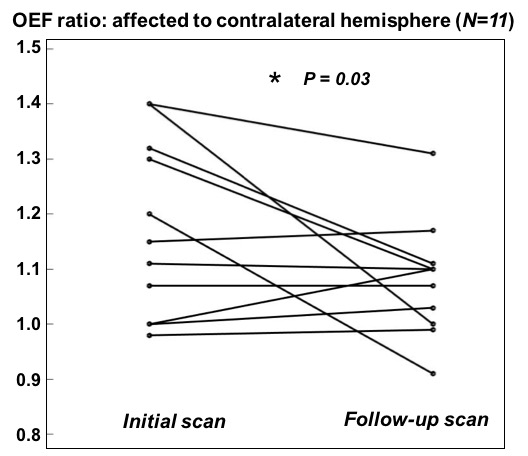
In the cohort with large mismatch, patients with higher OEF tended to have lower relative CBF (normalized to total brain blood flow) in the area of MTT deficit (Figure 3). In those cases with longitudinal follow-up, OEF characteristics related to the recanalization outcome in the individual patient. For instance, Figure 4 depicts an 86-year old female with M1 occlusion who exhibited high OEF in the area of mismatch compared to the contralateral hemisphere (OEF ratio = 1.4) on the initial scan. On the follow-up scan (three days later), the patient showed persistent high OEF near the infarct (OEF ratio = 1.4) that was consistent with lack of recanalization and persistent occlusion. Across the 11 patients who were imaged longitudinally, the mean OEF ratio decreased (normalized) between the initial and follow-up scans after treatment (P = 0.03, Figure 5).
Discussion
Quantitative OEF imaging with MRI susceptibility detects OEF differences between areas of infarct and normal-appearing tissue in acute stroke. The observed OEF difference depends on perfusion status, with stroke cases exhibiting a substantial perfusion-diffusion mismatch (indicative of potentially salvageable penumbra) having the greatest OEF elevation. Although neurovascular coupling is known to be perturbed in stroke [6], here the tissue oxygen metabolism was at least partly preserved even in cases with large mismatch, as patients with lower relative CBF tended to compensate with higher OEF (Figure 3). OEF imaging with MRI susceptibility is also repeatable and can be used in longitudinal follow-up, which will have great impact for stratification of cerebrovascular patients for endovascular treatments or evaluation of therapy success to improve stroke outcomes.Acknowledgements
GE Healthcare, Stanford Neuroscience Institute Interdisciplinary Scholar Award.
Funding support: Heart and Stroke Foundation and National Science and Engineering Research Council (RGPIN-2015-04665)
References
- Goyal M, Yu AY, Menon BK, Dippel DW, Hacke W, Davis SM et al. Endovascular Therapy in Acute Ischemic Stroke: Challenges and Transition From Trials to Bedside. Stroke 2016; 47(2): 548-53.
- Sobesky J., et al. “Does the mismatch match the penumbra? Magnetic resonance imaging and positron emission tomography in early ischemic stroke.” Stroke 36.5 (2005): 980-985.
- Fan A.P., et al. “Quantitative oxygenation venography from MRI phase.” Magnetic Resonance in Medicine 72.1 (2014): 149-159.
- Xu B., et al. “Flow compensated quantitative susceptibility mapping for venous oxygenation imaging.” Magnetic Resonance in Medicine 72.2 (2014): 438-445.
- Schweser F., et al. “Toward online reconstruction of quantitative susceptibility maps: superfast dipole inversion.” Magnetic Resonance in Medicine 69.6 (2012): 1581-1593.
- Girouard H., et al. “Neurovascular coupling in the normal brain and in hypertension, stroke, and Alzheimer’s disease.” J Applied Physiology 100 (2006): 328-335.
Figures