4825
Can susceptibility weighted imaging indicate the ischemic penumbra in patients with acute infarction in middle cerebral artery?1Radiology Department, Shanghai Forth People's Hospital, Shanghai, China, 2Shanghai Forth People's Hospital, Shanghai, China, 3Tianjin First Central Hospital, Tianjin, China, 4Wayne State University, Detroit, MI, United States
Synopsis
1.Purpose to evaluate the penumbra in acute ischemic stroke by quantitative mismatch between susceptibility weighted imaging(SWI) and diffusion weight imaging(DWI) in comparison with perfusion weighted imaging(PWI) and diffusion weight imaging(DWI) mismatch.
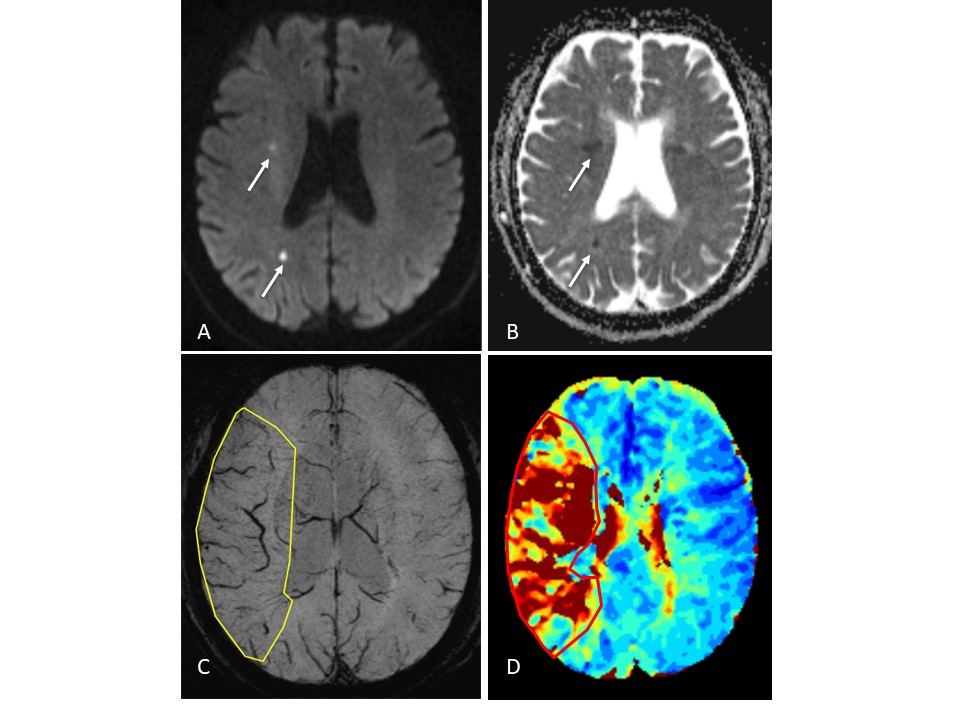
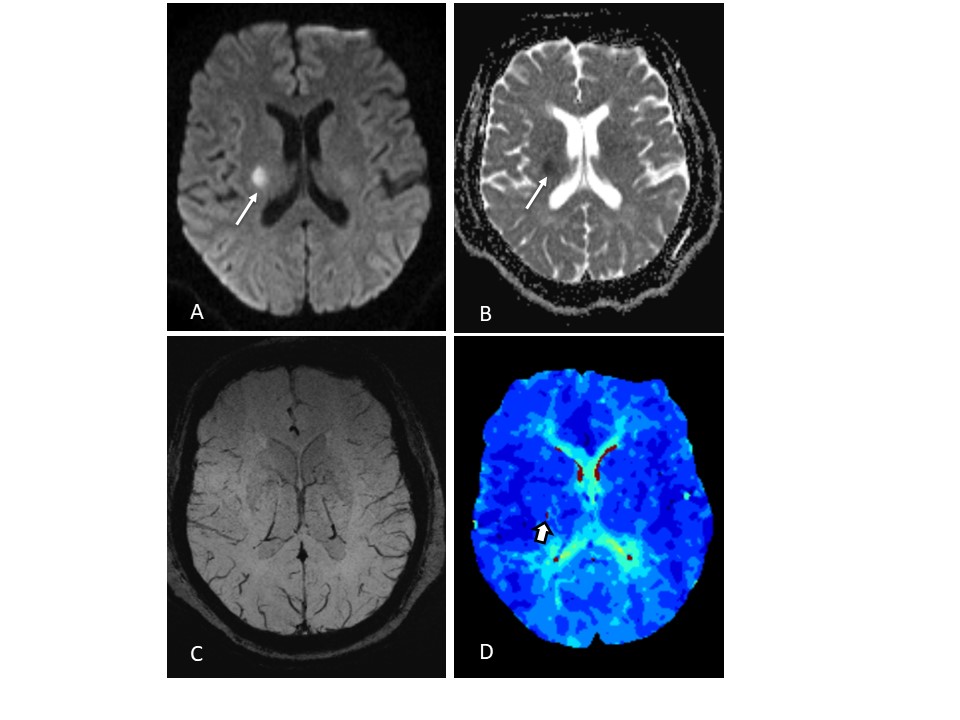
2.Method 85 eligible patients were enrolled with acute ischemic stroke who underwent MR scan including DWI, SWI and PWI before treatment within 12 hours after symptom onset. SWI-DWI mismatch was demarcated by the volume of asymmetrical prominent cortical veins(APCV)region in SWI MIP extending beyond the volume of infarct core segmentation of ADC maps. PWI-DWI mismatch was determined by using infarct core and perfusion deficits segmented from ADC and Tmax maps.
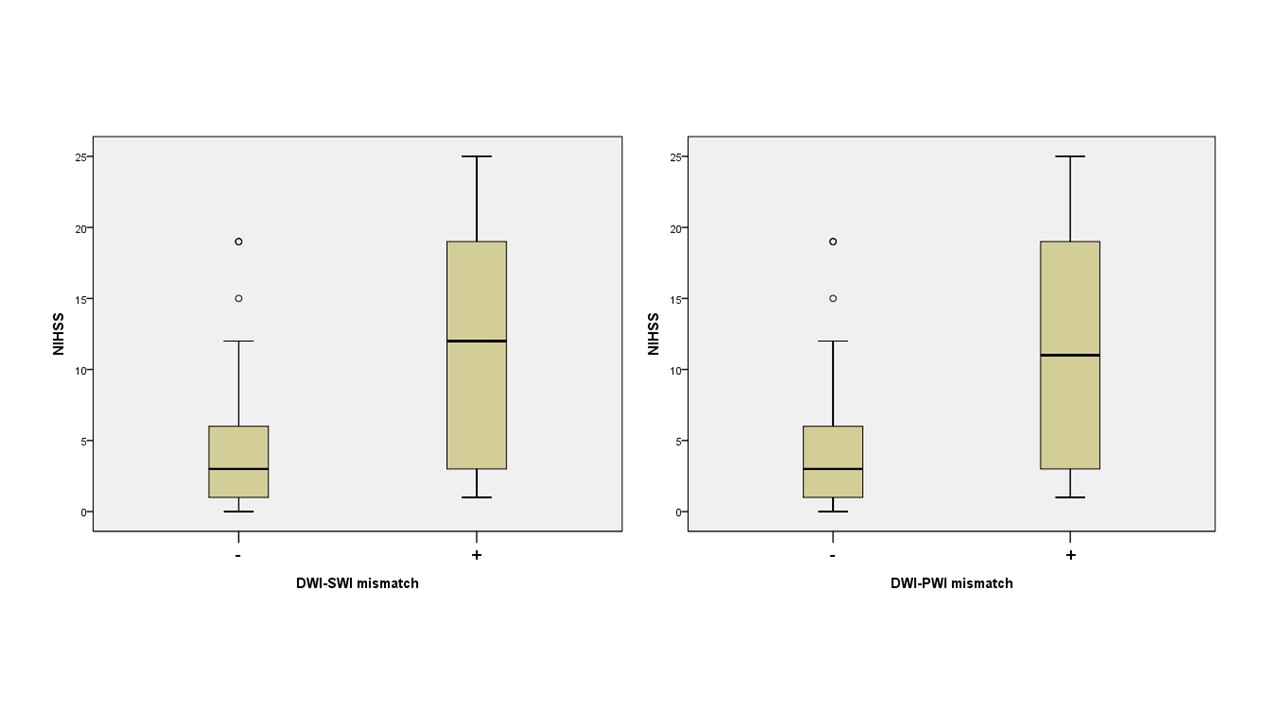
3.Result 41 cases have SWI-DWI mismatch,while 43 cases have PWI-DWI mismatch in totally 85 patients. 42 cases have neither SWI-DWI mismatch nor PWI-DWI mismatch. Only 2 cases have PWI-DWI mismatch without SWI-DWI mismatch. None has SWI-DWI mismatch without PWI-DWI mismatch. There is no a significant difference between SWI-DWI and PWI-DWI in showing mismatch with MCA stroke(P<0.01).The NIHSS of patients with SWI-DWI mismatch was statistically higher compared to the patients without SWI-DWI mismatch (t=-4.956, P<0.01). The NIHSS of patients was also statistically higher with PWI-DWI mismatch in comparison with none PWI-DWI mismatch(t=-4.481, P<0.01).
4.Conclusion APCV in SWI might to be a good instrument to indicate the ischemic penumbra as well as PWI. SWI may be an alternative to PWI in some stroke cases.
INTRODUCTION
In standard practice, most of the MRI-guided selection of patients for acute ischemic stroke diagnosis and treatment are based on assumption so-called ischemic penumbra.1 It almost be further considered that MRI can approximately indicate the ischemic penumbra as a mismatch between PWI and DWI, 2-5 In the past decade, susceptibility weight imaging(SWI) was reported as an important role in acute ischemic stroke. 6,7 The asymmetric prominent cortical veins(APCVs) have always been seen in the ischemic territory probably due to increasing deoxyhemoglobin in ischemic region compared to normal brain tissue. 8 Some literatures suggested that APCVs have been hypothesized to manifested the ischemic penumbra and correlated well with perfusion parameters .9-12 But there is no published report to quantitatively evaluate the penumbra in SWI compared with PWI. We performed SWI and PWI scan protocol in acute ischemic stroke of middle cerebral artery territory before treatment to assess the penumbra and determine whether SWI could manifest the penumbra as well as PWI or not.METHODS
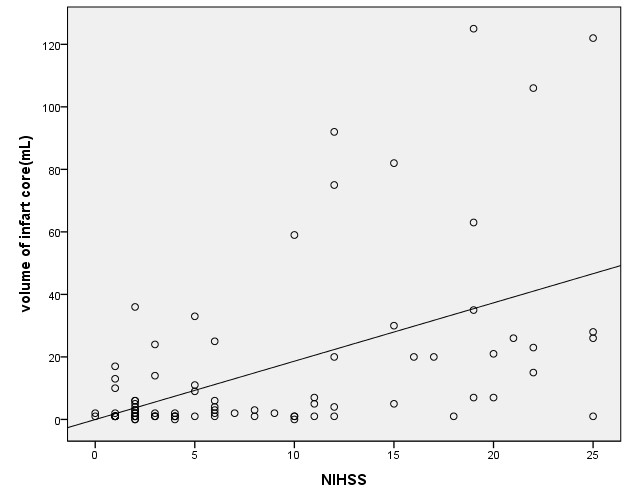
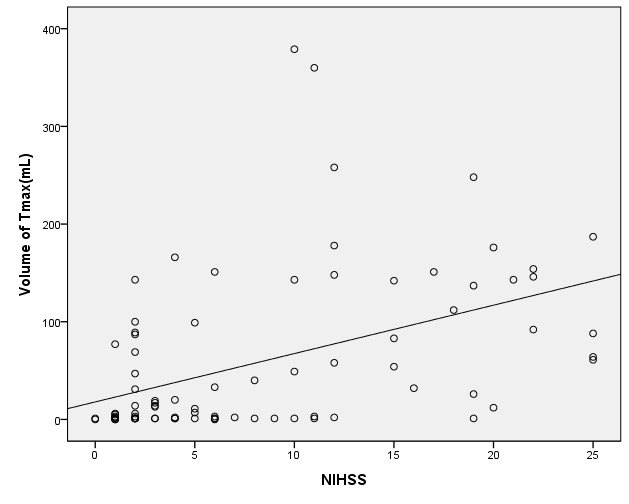
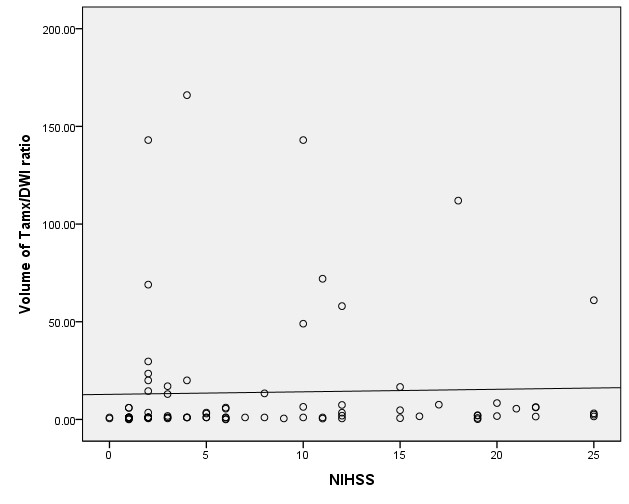
we randomly enrolled 85 eligible patients with acute ischemic stroke who underwent MR scan including DWI, SWI and PWI before treatment within 12 hours after symptom onset. We measured infarct core volume in ADC map. SWI-DWI mismatch was demarcated by the volume of asymmetrical prominent cortical veins(APCV)in SWI MIP extending beyond the volume of infarct core segmentation of ADC maps. SWI data was processed and analysed with NeuSPIN software(Neusoft, Shenyang, China). PWI-DWI mismatch was determined by using infarct core and perfusion deficits segmented from ADC and Tmax maps. PWI and DWI data were processed and analysed with the fully automated software (RAPID, iSchemaView, USA).Then SWI-DWI mismatch, PWI-DWI mismatch and National Institute of Health stroke scale (NIHSS) were estimated and compared separately.
Continuous variables were summarized by the mean and standard deviation. The Chi-square test was used to analyze categorical data. Correlation between SWI–DWI mismatch and PWI-DWI mismatch was determined using the Pearson analysis. Cohen’s Kappa inter-rater agreement was calculated to evaluate inter-reviewer reliability. A P value less than 0.05 was considered to indicate statistically significant. The data were carried out using SPSS 18.0 software (SPSS Inc., Chicago, IL, USA).
RESULTS
41 cases have SWI-DWI mismatch,while 43 cases have PWI-DWI mismatch in totally 85 patients. 42 cases have neither SWI-DWI mismatch nor PWI-DWI mismatch. Only 2 cases have PWI-DWI mismatch without SWI-DWI mismatch. None has SWI-DWI mismatch without PWI-DWI mismatch. There is no a significant difference between SWI-DWI and PWI-DWI in showing mismatch with MCA stroke(P<0.01), measure of Agreement Kappa=0.95. The NIHSS of patients with SWI-DWI mismatch was statistically higher compared to the patients without SWI-DWI mismatch (t=-4.956, P<0.01). The NIHSS of patients was also statistically higher with PWI-DWI mismatch in comparison with none PWI-DWI mismatch(t=-4.481, P<0.01).DISCUSSION
In prior smaller sample studies, SWI-DWI mismatch was evaluated as an important role of representing penumbra in acute ischemic stroke as well as PWI[10,11]. In a larger sample research [12], Dejobert, et al found that SWI-DWI mismatch was good correlated with PWI-DWI mismatch. But there are still some problems to figure out with SWI and PWI. Can SWI indicate the penumbra area accurately which wasn’t including benign hypoperfusion in acute stage stroke? How credible is SWI compared with PWI? In our study, instead of calculating ASPECTS value to estimate SWI-DWI and PWI-DWI mismatch[11,12,13], we try to quantify all the data including the volume of APCV area in SWI, infarct core in DWI and penumbra in PWI.As for the volume of APCV area, we found SWI MIP images could good represent accurate ischemic area cause its high resolution and clearly veins image rather than susceptibility weighted image and quantitative susceptibility mapping (QSM). Hence, we prefer SWI MIP to get the volume of APCV region. Meanwhile, we used automatic PWI analysis software(RAPID) to get the volume of infarct core in DWI and penumbra in PWI. Finally, the results of our study showed that SWI can assess the penumbra very well in comparison of PWI.CONCLUSION
APCV in SWI might to be a good instrument to indicate the ischemic penumbra as well as PWI. SWI may be an alternative to PWI in some stroke cases.Acknowledgements
Supported by grants from Shanghai Health Bureau of Science and Technology (Grant No.201740137 to Yu Luo)References
1. Astrup J, Siesjo BK, Symon L. Thresholds in cerebral ischemia - the ischemic penumbra. Stroke.1981; 12(6):723–725.
2. Schlaug G, Benfield A, Baird AE, Siewert B, Lovblad KO, Parker RA, et al. The ischemic penumbra: operationally defined by diffusion and perfusion MRI. Neurology. 1999; 53(7):1528–1537.
3. Albers GW, Thijs VN, Wechsler L, et al. Magnetic resonance imaging profiles predict clinical response to early reperfusion: the Real-Time DWI/PWI Mismatch (RAPID) diffusion and perfusion imaging evaluation for understanding stroke evolution (DEFUSE) study. Ann Neurol. 2006; 60:508–517.
4. Hjort N, Butcher K, Davis SM, Kidwell CS, Koroshetz WJ, Rother J, et al. Magnetic resonance imaging criteria for thrombolysis in acute cerebral infarct. Stroke. 2005; 36(2):388–397.
5. Davis SM, Donnan GA, Parsons MW, et al. Effects of alteplase beyond 3 h after stroke in the echoplanar imaging thrombolytic evaluation trial (EPITHET): a placebo-controlled randomised trial.Lancet Neurol. 2008;7:299–309.
6. Hermier M and Nighoghossian N. Contribution of susceptibility-weighted imaging to acute stroke assessment. Stroke. 2004; 35: 1989–1994.
7. Haacke EM, Mittal S, Wu Z, et al. Susceptibility weighted imaging: technical aspects and clinical applications, part 1. AJNR Am J Neuroradiol 2009; 30:19–30.
8. Mittal S1, Wu Z, Neelavalli J, et al. Susceptibility-weighted imaging: technical aspects and clinical applications, part 2. AJNR Am J Neuroradiol. 2009 Feb;30(2):232-52.
9. Luo Y, Gong Z, Zhou Y et al. Increased susceptibility of asymmetrically prominent cortical veins correlates with misery perfusion in patients with occlusion of the middle cerebral artery. Eur Radiol. 2017 Jun;27(6):2381-2390.
10. Kao HW, Tsai FY, Hasso AN. Predicting stroke evolution: comparison of susceptibility-weighted MR imaging with MR perfusion. Eur Radiol. 2012 Jul;22(7):1397-403.
11. Luo S, Yang L, Wang L. Comparison of susceptibility-weighted and perfusion-weighted magnetic resonance imaging in the detection of penumbra in acute ischemic stroke. J Neuroradiol. 2015 Oct;42(5):255-60.
12. Dejobert M, Cazals X, Annan M, et al. Susceptibility-Diffusion Mismatch in Hyperacute Stroke: Correlation with Perfusion-Diffusion Mismatch and Clinical Outcome. J Stroke Cerebrovasc Dis. 2016 Jul;25(7):1760-6.
13. Albers GW, Thijs VN, Wechsler L, et al. Magnetic resonance imaging profiles predict clinical response to early reperfusion: the diffusion and perfusion imaging evaluation for understanding stroke evolution (DEFUSE) study. Ann Neurol. 2006;60: 508–517.
Figures