4823
Reproducibility of BOLD delay perfusion measurements in acute stroke patients1Center for Stroke Research Berlin, Charité Universitätsmedizin Berlin, Berlin, Germany, 2Berlin School of Mind & Brain, Humboldt Universität zu Berlin, Berlin, Germany, 3Department of Neurology, Max Planck Institute for Human Cognitive and Brain Sciences, Leipzig, Germany, 4Department of Biostatistics and Clinical Epidemiology, Charité Universitätsmedizin Berlin, Berlin, Germany
Synopsis
To assess perfusion in ischemic stroke is an important task in clinical diagnosis. In this context, a technique sensitive to the delay of blood-oxygenation-level-dependent (BOLD) oscillations at rest called BOLD delay has been proposed. In this study, the reproducibility of this technique in acute stroke patients was examined. Magnitude differences between perfusion measurements from two
Introduction
Assessment of blood flow in acute ischemic stroke is important for identifying tissue at risk of progressing from reversible to irreversible damage and for monitoring treatment aimed at restoring normal perfusion. Typically, this is done using techniques such as bolus-tracking MRI that require intravenous administration of paramagnetic contrast agents. Non-invasive methods, such as arterial spin labeling, do exist but are less reliable in patients with severe cerebrovascular disease.1 An alternative method, based on lags in low-frequency blood-oxygenation-level-dependent (BOLD) signal oscillations, has recently been developed.2 Known as BOLD delay, this reflects tissue perfusion and has been validated in several settings.3,4 However, the BOLD signal is a complex amalgam of the hemodynamic consequences of neural activity, blood flow, head motion, and systemic cardiovascular and respiratory factors, all of which may potentially affect the reliability of this method. In this study, we investigated the reproducibility of BOLD delay measurements in a cohort of acute stroke patients.Methods
Thirty-one acute stroke patients (24 males and 7 females) were scanned at rest using a multiband echo planar imaging (EPI) sequence5 (TR = 400 ms, TE = 30 ms, FA = 43, multiband factor = 6, matrix = 64 x 64, FOV = 192 x 192 mm, slice thickness = 4 mm, 850 volumes, acquisition time = 340 s) and a standard stroke MR protocol6 within 24 hours of symptom onset (day 0) and one day later (day 1). Clinical characteristics of the patients were as follows (median [IQR]): age = 73 years [61 – 78], time from symptom onset to imaging = 8.8 h [3 - 11], stroke severity (NIHSS) = 1 [1 – 3]. None of the patients had a visible perfusion deficit. The EPI data underwent realignment, spatial smoothing with a 4 mm FWHM Gaussian kernel, and bandpass filtering to 0.01 – 0.15 Hz.
Head motion was quantified for each dataset using the mean framewise displacement across all volumes.7 This was then averaged across day 0 and day 1 scanning sessions for each patient. BOLD delay was calculated using rapidtide8 as the time shift to maximum cross-correlation between the BOLD signal in a given voxel and a reference time course from the major venous sinuses.4 BOLD delay maps were warped to a custom EPI template (derived from a similar acute stroke cohort).
To assess reproducibility, the magnitude of the absolute differences in BOLD delay values per voxel between day 1 and day 0 was calculated. A mask was used to exclude voxels within the ventricles from all quantitative analyses. The overall mean difference of perfusion measures was calculated using a linear mixed model to account for the clustering of the data in individuals (random intercept model, two levels: first level: voxel-specific differences, second level: patients, motion as a covariate). The relationship between the spread of differences (standard deviation [SD]) and extent of head motion was investigated using linear regression.
Results
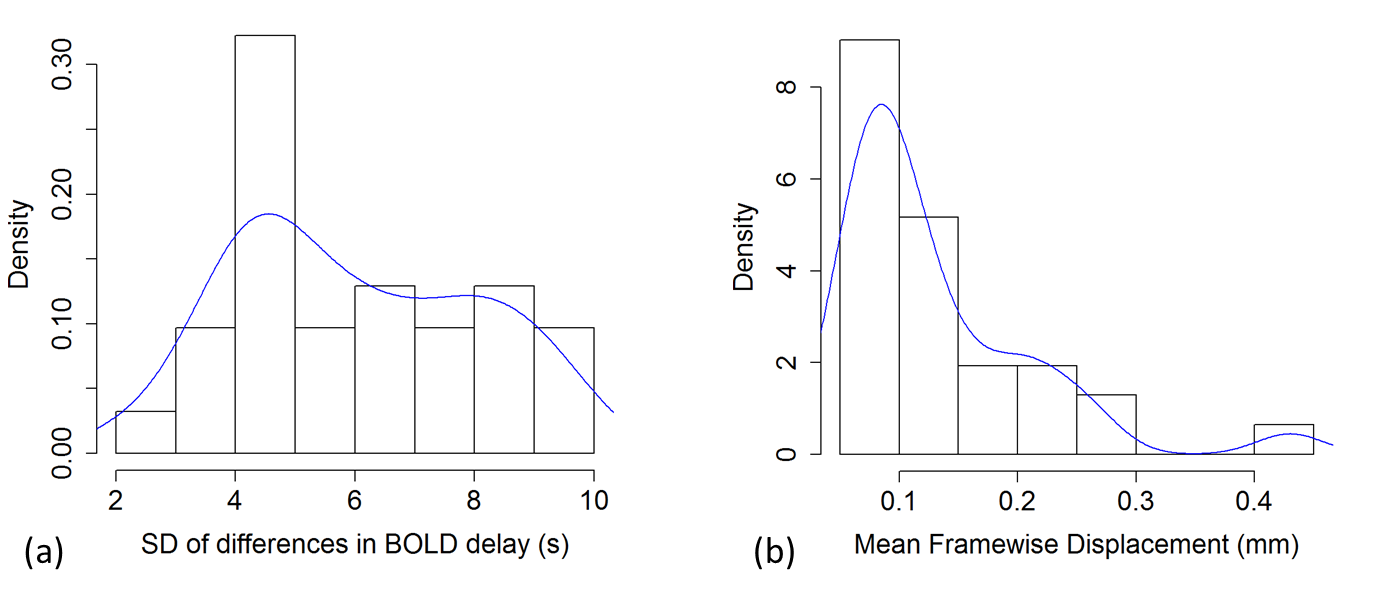
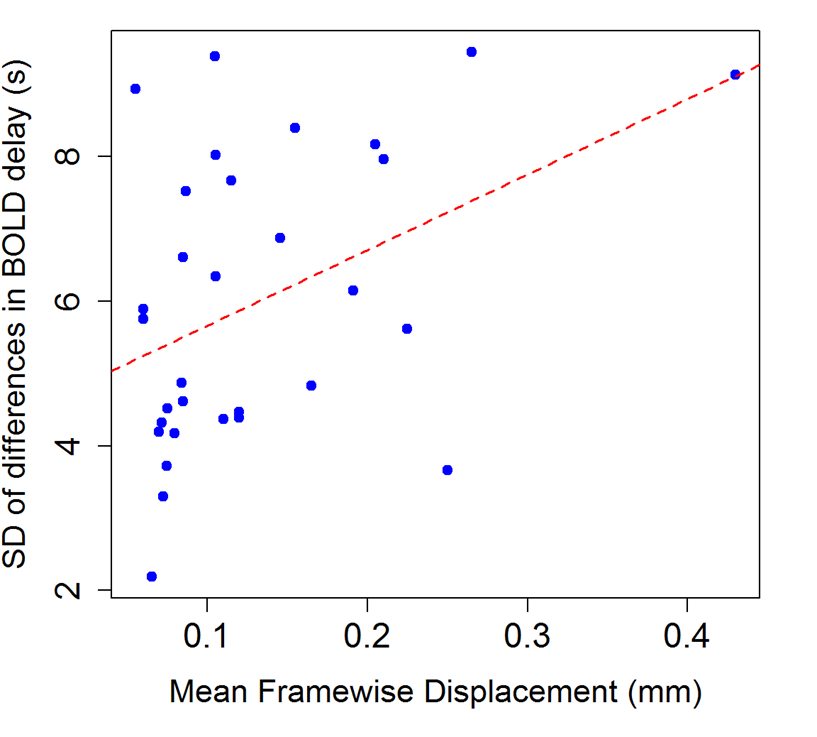
The distributions of the spread of differences and head motion in the sample are shown in Fig. 3. Overall mean absolute BOLD delay difference (the intercept of the mixed model), including subjects as a random effect and motion as a covariate, was 3.0 s (95% CI = 1.5 s – 4.5 s, t = 2.280). Motion was positively associated with absolute differences in BOLD delay (b = 18.8, 95% CI = 8.8 – 28.8, t = 6.305). In addition, the linear regression showed an association between motion and the spread of BOLD delay differences (adjusted R2 = 0.15, b = 10.4, 95% CI = 2.2 – 18.6, p = 0.0187, Fig. 4).Discussion
We observed some differences in BOLD delay measurements over time in acute stroke patients without ischemic hypoperfusion. The magnitude of these differences is small compared to delays observed due to hypoperfusion in patients with cerebrovascular diseases.2–4 These differences, and their spread, are only partially accounted for by head motion. Other potential causes may be physiological delays due to differences in neural activity9,10, cardiovascular function11, or subtle changes in perfusion across timepoints. The most obvious differences were identified in areas of EPI susceptibility artifacts, around the edge of the brain, in the large arteries, and (less obviously) in occipital areas (Fig. 1 and Fig. 2).Conclusion
The reproducibility of BOLD delay perfusion in acute stroke patients is limited by head motion but likely sufficient for differentiating adequately perfused from hypoperfused tissue. Observed variations may also be attributed to other physiological factors that have not been investigated thus far.Acknowledgements
We thank the University of Minnesota Center for Magnetic Resonance Research (CMRR) for providing the multiband EPI sequence used in this study.References
1. Bokkers RPH, Hernandez DA, Merino JG, et al. Whole-brain arterial spin labeling perfusion MRI in patients with acute stroke. Stroke 2012; 43: 1290–1294.
2. Lv Y, Margulies DS, Cameron Craddock R, et al. Identifying the perfusion deficit in acute stroke with resting-state functional magnetic resonance imaging. Ann Neurol 2013; 73: 136–139.
3. Christen T, Jahanian H, Ni WW, et al. Noncontrast mapping of arterial delay and functional connectivity using resting-state functional MRI: A study in moyamoya patients. J Magn Reson Imaging 2015; 41: 424–430.
4. Khalil AA, Ostwaldt AC, Nierhaus T, et al. Relationship between Changes in the Temporal Dynamics of the Blood-Oxygen-Level-Dependent Signal and Hypoperfusion in Acute Ischemic Stroke. Stroke 2017; 48: 925–931.
5. Xu J, Moeller S, Auerbach EJ, et al. Evaluation of slice accelerations using multiband echo planar imaging at 3T. Neuroimage 2013; 83: 991–1001.
6. Hotter B, Pittl S, Ebinger M, et al. Prospective study on the mismatch concept in acute stroke patients within the first 24 h after symptom onset - 1000Plus study. BMC Neurol 2009; 9: 60.
7. Power JD, Barnes KA, Snyder AZ, et al. Spurious but systematic correlations in functional connectivity MRI networks arise from subject motion. Neuroimage 2012; 59: 2142–2154.
8. Erdoğan SB, Tong Y, Hocke LM, et al. Correcting resting state fMRI-BOLD signals for blood arrival time enhances functional connectivity analysis. Front Hum Neurosci 2016; 10: 311.
9. Mitra A, Snyder AZ, Blazey T, et al. Lag threads organize the brain’s intrinsic activity. Proc Natl Acad Sci 2015; 112: E2235–E2244.
10. Amemiya S, Takao H, Hanaoka S, et al. Global and structured waves of rs-fMRI signal identified as putative propagation of spontaneous neural activity. Neuroimage 2016; 133: 331–340.
11. Katura T, Tanaka N, Obata A, et al. Quantitative evaluation of interrelations between spontaneous low-frequency oscillations in cerebral hemodynamics and systemic cardiovascular dynamics. Neuroimage 2006; 31: 1592–1600.
Figures
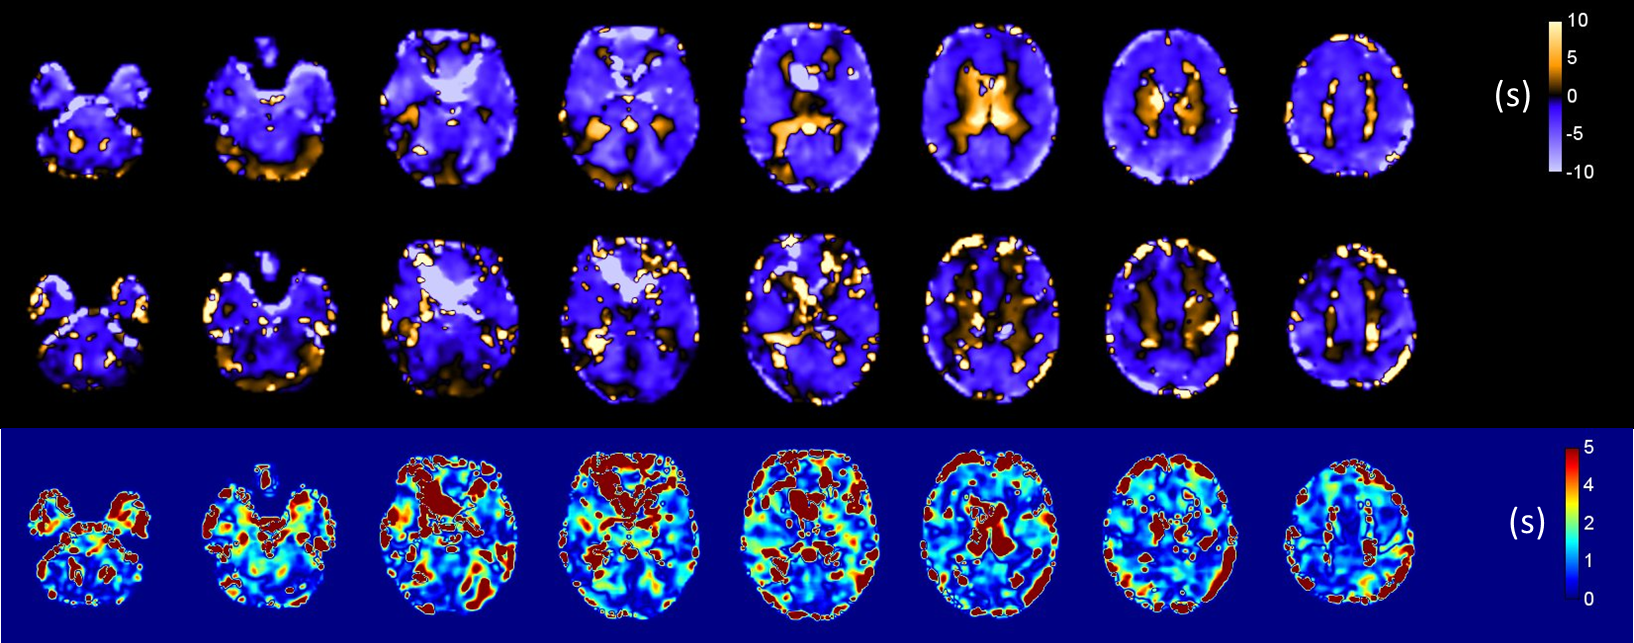
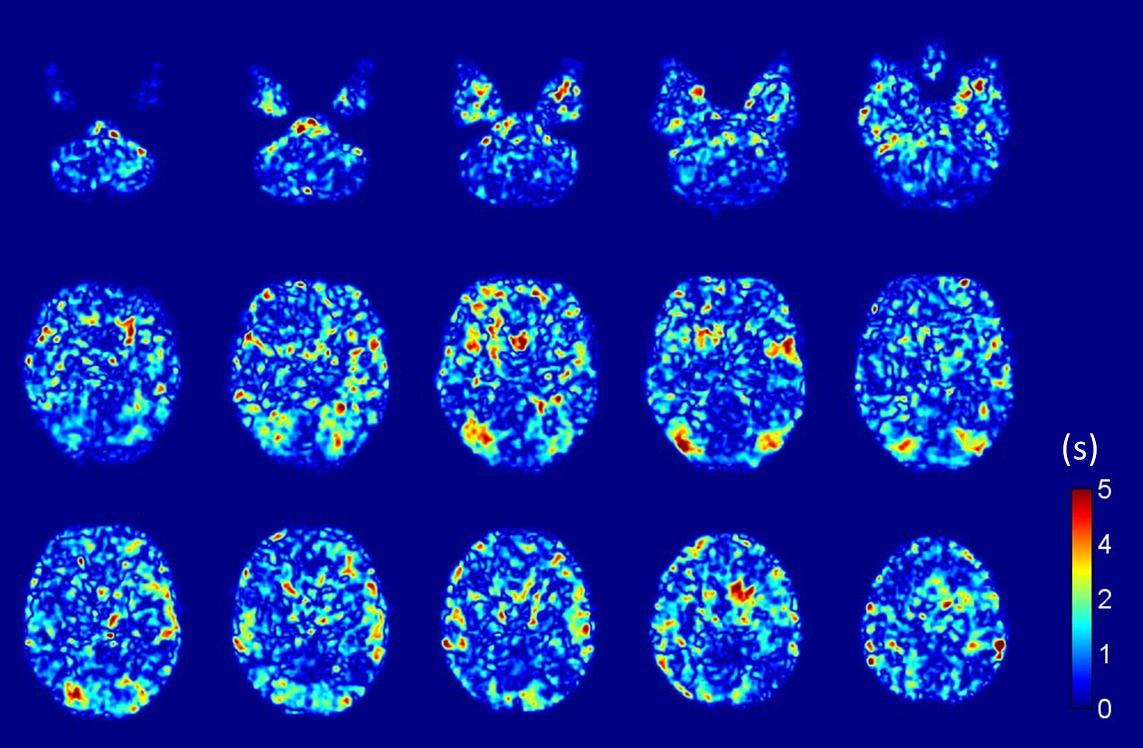
Fig.1: Sample BOLD delay perfusion maps in units of s for selected slices from one patient for (top row) day 0 and (center row) day 1; (bottom row) the magnitude of absolute differences between maps for day 0 and day 1. Note that, for most parts of the brain, the magnitude of differences between day 0 and day 1 were small, i.e. below 2 s, but increased around the edges of the brain and in areas of susceptibility artifacts.