4817
Rapid Quantitative Susceptibility Mapping of Intracranial Hemorrhage using Echo Planar Imaging1Biomedical Engineering, University of Alberta, Edmonton, AB, Canada, 2Radiology & Diagnostic Imaging, University of Alberta, Edmonton, AB, Canada, 3Division of Neurology, University of Alberta, Edmonton, AB, Canada
Synopsis
Intracranial hemorrhage(ICH) accounts for about 20% of strokes. Quantitative Susceptibility Mapping (QSM) may be valuable for tracking iron changes in ICH. Here we apply Echo Planar Imaging (EPI) for rapid QSM at 3.0 T in hemorrhage patients. The acquisition time is only 9 sec without parallel imaging and 27 sec if parallel imaging is considered to maintain high resolution, appropriate echo time and minimize blurring effects. High correlation was observed for ICH area and mean susceptibility between standard QSM and EPI-QSM in hemorrhage. Hence EPI-QSM method has potential for clinical ICH studies when time is a limiting factor.
Introduction
Stroke is a leading cause of disability and death worldwide. Intracranial hemorrhage (ICH) is a type of stroke where blood vessels rupture and lead to blood leakage in the brain. The leaked hemoglobin is toxic to the tissue and can lead to inflammation and increased injury1. Quantitative Susceptibility Mapping (QSM) offers a means to study iron changes in hematoma. Previous studies have used single or multiple gradient echo sequences2-4. However, these acquisitions have used long acquisition times, typically around 5 minutes. Clinical stroke studies are not always amenable to such long scan times and these scans often suffer from motion artifact particularly in cases of severe disease. Recently, QSM obtained from Echo Planar Imaging (EPI) has been introduced, where whole brain QSM was obtained with single shot 2D EPI within 7 seconds at 1.5 T in healthy volunteers5, which essentially freezes motion within each slice.Purpose
To investigate the value of rapid EPI-QSM for hemorrhage in comparison to a standard QSM sequence.Methods
Sequences: Ten patients (8 male/ 2 female, age: 68±15 yrs.), diagnosed with ICH by day 0 or day 1 CT received a follow-up MRI scan from day 3 to day 39 after symptom onset. All patients were scanned at 3.0 T with a 3D SWI (Susceptibility Weighted Imaging) sequence (TE=20ms, TR=27ms, resolution=0.85mmX0.85mmX1.3mm, acquisition time= 5 min) and a 2D single-shot gradient EPI sequence (TE=25ms, resolution=1.5mmX1.5mmX1.5mm, acquisition time time=27s). The EPI acquisition used parallel imaging which required 27s but only 9s without parallel imaging. Parallel imaging required 2 additional TRs for a separate calibration scan and dummy scan. Parallel imaging was chosen to maintain high resolution, appropriate echo time and minimize blurring effects.
Reconstruction: Construction of susceptibility maps included phase unwrapping with best path unwrapping technique6 and reconstructing images using superposed dipole inversion4. In this method the ICH field was separated from the remaining brain using RESHARP (Regularization Enabled Sophisticated Harmonic Artifact Reduction for Phase data) or LBV (Laplacian Boundary Value) technique. Same background removal technique was used for both methods corresponding to each patient. This was followed by total variation dipole inversion with and without the ICH dipole field to produce two susceptibility maps which were combined to produce the final susceptibility map.
Analysis: ICH area and susceptibility values were compared between the two methods. The CT and QSM images were registered with the GRE magnitude images using SPM. 2D region-of-interests were drawn on magnitude and QSM slices around the largest hemorrhage area for each subject.
Results
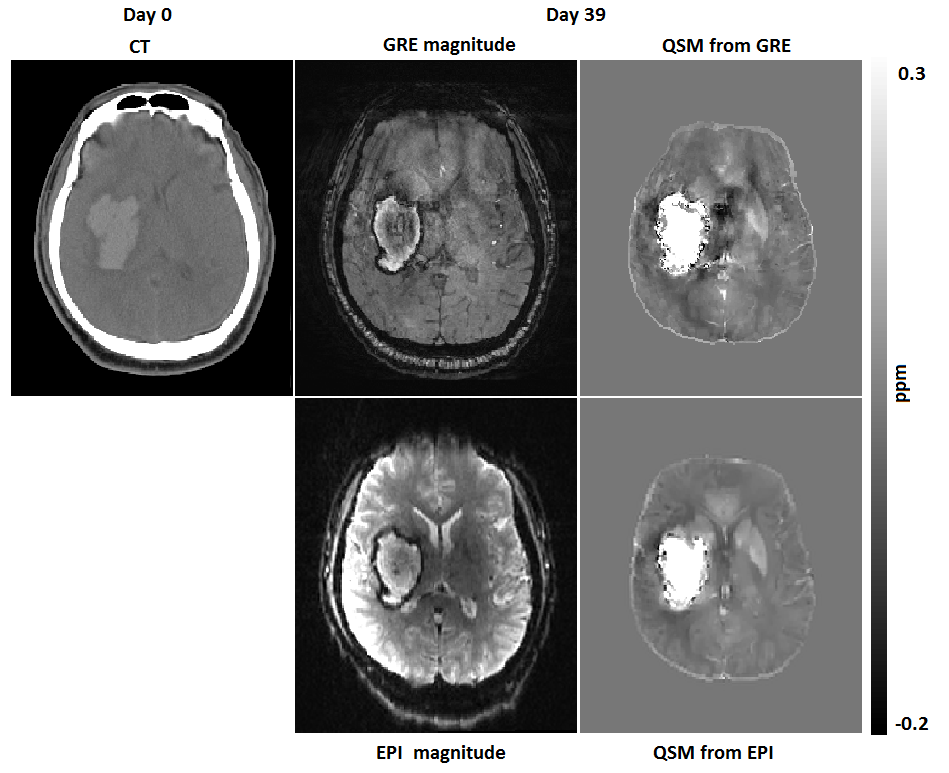
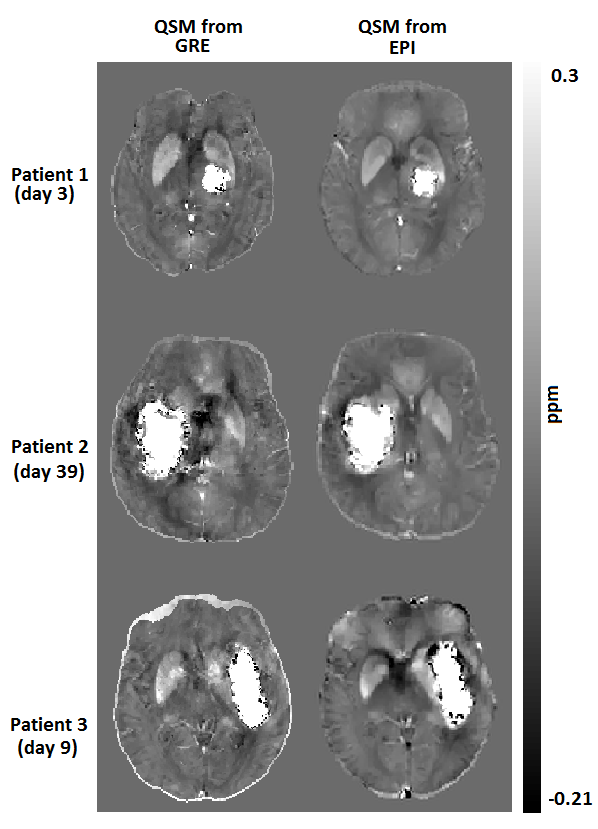
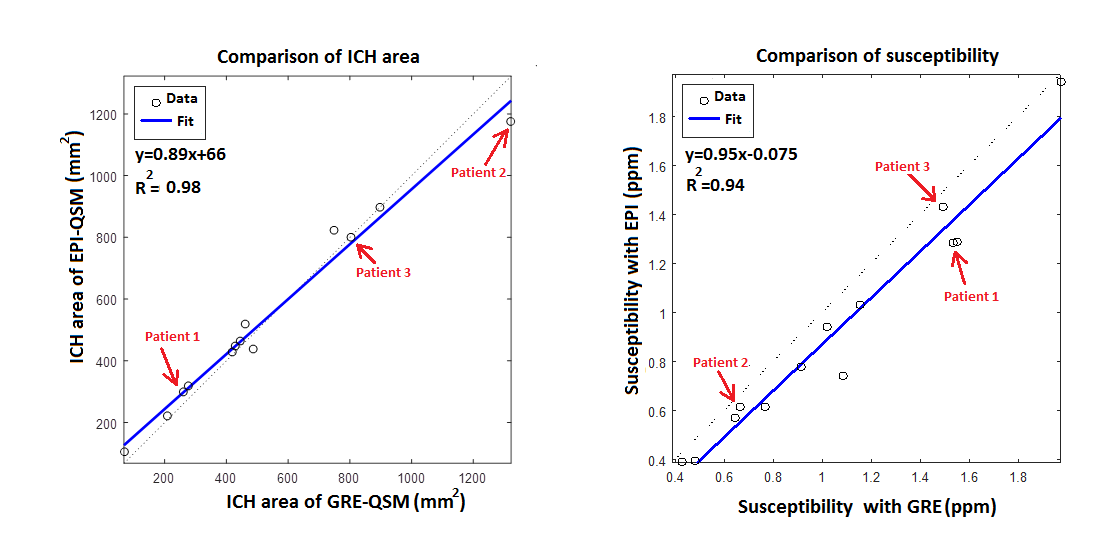
Fig. 1 shows CT, magnitude and QSM obtained from both sequences for one patient (patient 2 in Fig.2). The CT scan was done in day 0 whereas the MRI was done on day 39 after the onset of the symptoms. The ICH regions in the magnitude and QSM from standard GRE show close resemblance to the corresponding magnitude and QSM from EPI. A comparison of QSM from standard GRE and EPI for 3 patients is shown in Fig. 2. Patients 1-3 were scanned on day 3, day 39 and day 9 after the symptom onset respectively. Fig. 3 shows excellent correlation between GRE and EPI versions of QSM for area (R2=0.98) and susceptibility values (R2=0.94) of the ICH regions. The three patients from Fig. 2 have been labelled in the regression plots. Four out of ten patients had motion artifact on magnitude images ranging from ringing artifact to substantial signal destruction resulting in masking out of frontal brain in the corresponding QSM. On the other hand, rapid EPI scans had negligible motion artifacts.Discussion
EPI-QSM was equally robust as GRE-QSM in area estimation of hemorrhage and there was good correlation of the susceptibility values between the two methods. Despite the short T2* in many hemorrhage cases, which can lead to increased blurring in the phase encode direction for EPI, mean susceptibility on GRE and EPI was similar. Moreover, the longer GRE sequences are much more prone to motion artifact causing variation in the susceptibility values. Hence the short scan time of EPI-QSM makes it a possible addition for emergent scanning of patients suspected with ICH.Conclusion
Mean susceptibility and area measurements of hemorrhage on QSM obtained from 2D single-shot gradient EPI sequence provided similar results to that of QSM obtained from a standard GRE sequence. Moreover, EPI-QSM minimized effects of patient motion relative to standard QSM. The much faster EPI-QSM method has potential for clinical ICH studies when time is a limiting factor or as a sequence addition when standard QSM has excessive motion artifact.Acknowledgements
Research support from Canadian Institutes of Health Research.
We thank Mitacs for their Globalink Graduate Fellowship to A.D.
References
1. Bradley WG Jr. MR appearance of hemorrhage in the brain. Radiology. 1993 Oct; 189(1):15-26.
2. Wang S, Lou M, Liu T, Cui D, Chen X, Wang Y. Hematoma volume measurement in gradient echo MRI using quantitative susceptibility mapping. Stroke. 2013 Aug;44(8):2315-7
3. Chang S, Zhang J, Liu T, Tsiouris AJ, Shou J, Nguyen T, Leifer D, Wang Y, Kovanlikaya I. Quantitative Susceptibility Mapping of Intracerebral Hemorrhages at Various Stages. J Magn Reson Imaging. 2016 Aug;44(2):420-5.
4. Sun H, Kate M, Gioia LC, Emery DJ, Butcher K, Wilman AH. Quantitative susceptibility mapping using a superposed dipole inversion method: Application to intracranial hemorrhage. Magn Reson Med. 2016 Sep; 76(3): 781-91.
5. Sun H, Wilman AH. Quantitative susceptibility mapping using single-shot echo-planar imaging. Magn Reson Med. 2015 May;73(5):1932-8.
Figures