4816
Hemodynamic Biomarkers to Assess Disease Severity in Patients with Intracranial Atherosclerotic Disease using Dual-Venc 4D Flow MRI1Radiology, Northwestern University, Chicago, IL, United States, 2Neurology, Northwestern University, Chicago, IL, United States, 3Neurological Surgery, Northwestern University, Chicago, IL, United States
Synopsis
To conduct a comprehensive assessment of hemodynamics in patients with intracranial atherosclerotic disease (ICAD), an automated analysis tool was developed to quantify 4D flow MRI data, including extraction of pressure gradient and flow resistance across the ICAD stenosis and flow and peak velocity asymmetry indices. For three ICAD cases with identical degree of stenosis, the results demonstrated variability in both flow resistance and flow asymmetry indices. With the inclusion of more patients spanning a spectrum of stenosis degrees, it may be possible to demonstrate the utility of flow resistance as a new metric for characterizing the hemodynamic impacts of ICAD.
Introduction
Intracranial atherosclerotic disease (ICAD) is one of the main causes of ischemic stroke worldwide1. Patients with symptomatic ICAD have approximately a 12% chance of stroke recurrence within one year, even with aggressive medical management2, suggesting more effective patient management is needed. Hemodynamic compromise has been recognized as a risk factor for stroke in ICAD patients3. Previous studies showed that ICAD not only affects flow in the stenotic artery but also significantly influences the hemodynamics in other vascular territories4. The degree of stenosis, currently used clinically as a measure of lesion severity is based on percentage of luminal narrowing, and is not a suitable metric for characterizing the impact of stenosis on intracranial hemodynamics5,6. Therefore, this study aims to develop a measure for the hemodynamic significance of stenosis based on pressure gradient across the stenosis. We investigate flow resistance which is the ratio of regional pressure gradient and flow rate in the affected vessel. We use dual-venc 4D flow MRI to provide a large dynamic range for measuring both slow and fast flows in the stenotic vessel.Methods
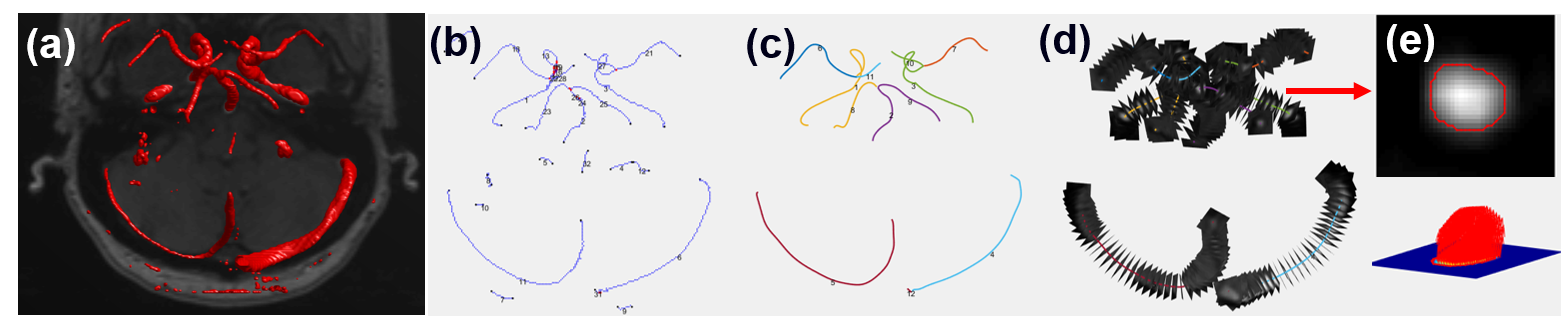
Intracranial k-t GRAPPA accelerated dual-venc 4D flow MRI7 was acquired in three ICAD patients on a 3T scanner (Skyra or Prisma, Siemens, Germany). Patient demographics and sequence parameters are presented in Table 1. 4D flow MRI data were corrected for noise, velocity aliasing and phase offset errors, and a 3D phase-contrast MR angiogram (PC-MRA) of cerebral vessels was calculated. A new in-house automated flow analysis tool8 developed in MATLAB (MathWorks, MA, USA) was used to segment cerebral vessels in the PC-MRA, extract centerlines of all vessels, and place multiple 2D perpendicular planes for individual vessels (Figure 1). Using these analysis planes, regional anatomical and hemodynamic parameters including cross-sectional area of the vessel, peak velocity, and time-averaged flow rate were calculated every 1 mm along the length of all major arteries in the Circle of Willis. Regional pressure gradients, ΔP (mmHg), were calculated using the extended Bernoulli equation9: ΔP = 4Vvc2(1-(EOA/A)2) with Vvc (m/s, peak velocity at stenosis [vena contracta]), EOA (effective orifice area: the minimum area of the stenosis), and A (cross-sectional area of the vessel proximal to the stenosis). Flow resistance, R (mmHg·s/ml), was obtained from R = ΔP/Q (with Q time-averaged flow rate, ml/s). Furthermore, asymmetry indices of flow rate and peak velocity between the affected and non-affected sides were used as reference indicators for hemodynamic significance of the disease (the smaller the asymmetry indices, the more significant is the hemodynamic impact of the lesion).Results
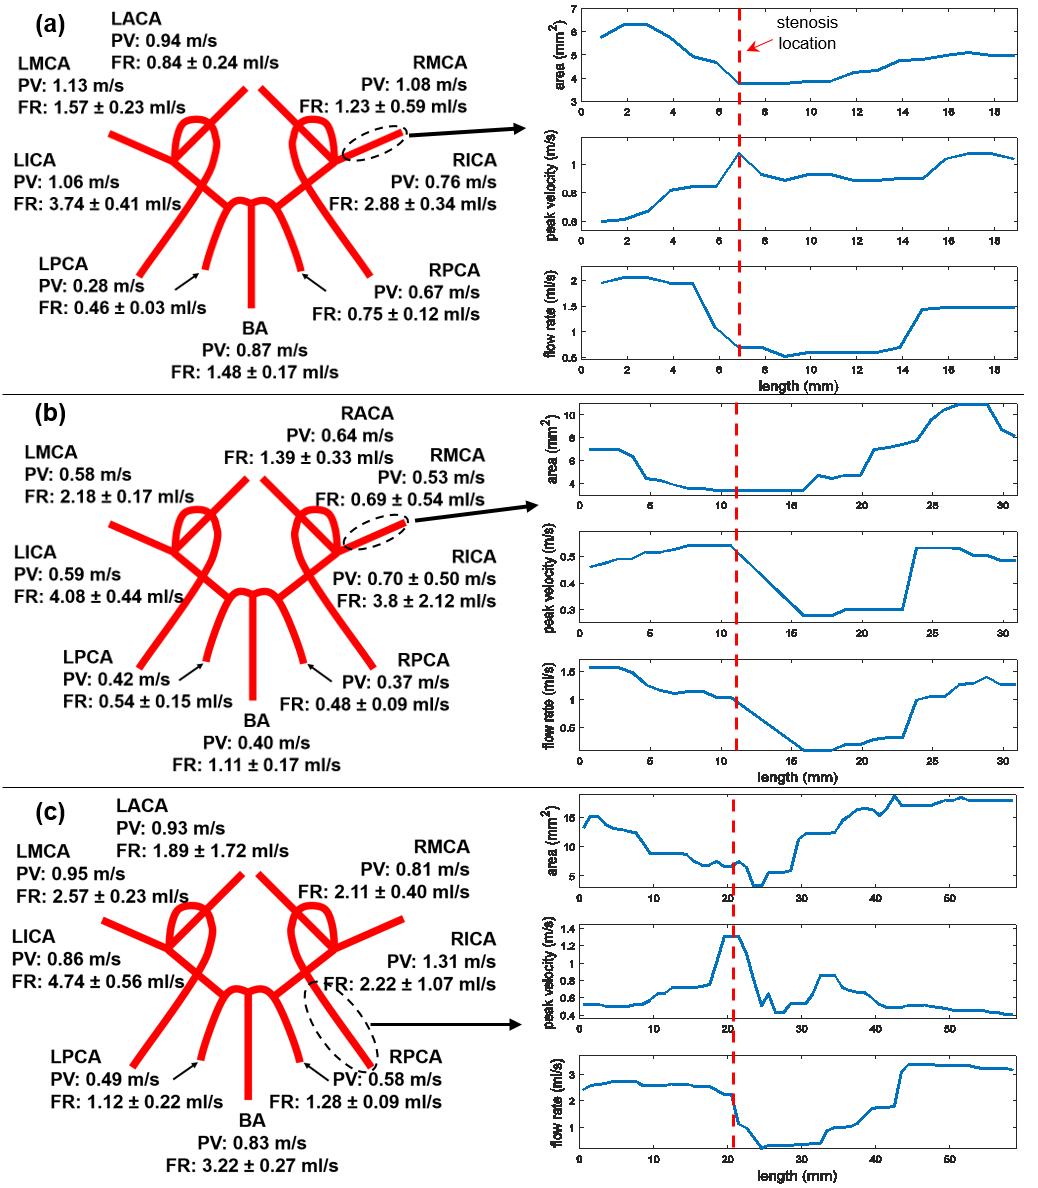
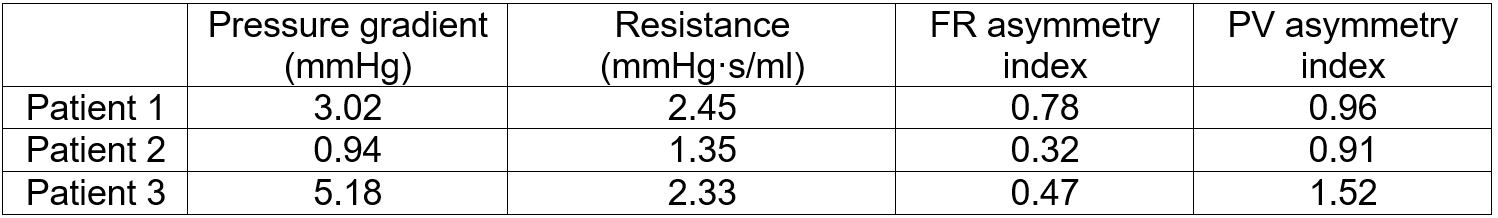
Figure 2 presents flow rate (FR) and peak velocity (PV) for each individual vessel for each patient separately in a simplified schematic of the Circle of Willis. Changes in cross-sectional area, peak velocity, and time-averaged flow rate along the affected artery are shown on the right. It can be seen that the cross-sectional area decreased while peak velocity increased due to stenosis. The flow rate dropped distal to the stenosis and then recovered, likely due to intravoxel dephasing as a consequence of flow instability in this region. The estimated pressure gradient and flow resistance of ICAD stenosis, and asymmetry indices of the affected vessels are summarized in Table 2. Although the stenosis in all three cases was classified as moderate (50% to 70%), there was variability in both resistance and asymmetry indices, suggesting possible correlation between these two parameters. However, in this feasibility study it is not possible to find the relationship with only three cases.Discussion
In this pilot study, assessment of intracranial hemodynamics in three ICAD patients was performed. An automated analysis tool was successfully developed to extract novel hemodynamic parameters: flow rate and peak velocity asymmetry indices, pressure gradient and flow resistance from 4D flow MRI data. The analysis result for three cases of moderate stenosis showed that there was variability in both flow resistance and flow asymmetry indices. However, more ICAD cases would be included in future studies to find relationships between stenosis resistance and asymmetry indices. In addition, the Bernoulli equation is limited by some assumptions, such as that there is no viscous energy loss. Although these assumptions are not valid for the case of blood flow through a narrow stenosis, this method was used here as a first approximation of the pressure gradient. A more suitable method would be using MR-based computational fluid dynamics (CFD) modeling where the boundary conditions and geometry would be based on MR images.Acknowledgements
Grant support by AHA 16SDG30420005 and NIH R01HL115828References
1. Gorelick PB, Wong KS, Bae H-J, Pandey DK. Large artery intracranial occlusive disease. A Large Worldwide Burden but a Relatively Neglected Frontier. 2008;39:2396-2399
2. Sacco RL, Kargman DE, Gu Q, Zamanillo MC. Race-ethnicity and determinants of intracranial atherosclerotic cerebral infarction. The Northern Manhattan Stroke Study. 1995;26:14-20
3. Arenillas JF. Intracranial atherosclerosis. Current Concepts. 2011;42:S20-S23
4. Wu C, Schnell S, Vakil P, Honarmand AR, Ansari SA, Carr J, et al. In vivo assessment of the impact of regional intracranial atherosclerotic lesions on brain arterial 3d hemodynamics. AJNR. American journal of neuroradiology. 2017;38:515-522
5. Derdeyn CP, Powers WJ, Grubb RL. Hemodynamic effects of middle cerebral artery stenosis and occlusion. American Journal of Neuroradiology. 1998;19:1463-1469
6. Liebeskind DS, Cotsonis GA, Saver JL, Lynn MJ, Cloft HJ, Chimowitz MI. Collateral circulation in symptomatic intracranial atherosclerosis. Journal of Cerebral Blood Flow & Metabolism. 2011;31:1293-1301
7. Schnell S, Ansari SA, Wu C, Garcia J, Murphy IG, Rahman OA, et al. Accelerated dual-venc 4d flow mri for neurovascular applications. Journal of magnetic resonance imaging : JMRI. 2017;46:102-114
8. Vali A, Schrauben E, Aristova M, Wu C, Prabhakaran S, Markl M, et al. Automatic quantification of the impact of intracranial atherosclerotic lesions on cerebrovascular hemodynamics using 4d flow mri. SMRA. 2017
9. Keshavarz-Motamed Z, Garcia J, Maftoon N, Bedard E, Chetaille P, Kadem L. A new approach for the evaluation of the severity of coarctation of the aorta using doppler velocity index and effective orifice area: In vitro validation and clinical implications. Journal of Biomechanics. 2012;45:1239-1245
Figures