4812
Oxygen Extraction Fraction and R2* Mapping in Cerebrovascular Disease using an Acetazolamide Challenge.1Radiology and Imaging Sciences, Emory University, Atlanta, GA, United States, 2Neurology, Emory University, Atlanta, GA, United States
Synopsis
Increased cerebral oxygen extraction fraction (OEF) in cerebrovascular disease is linked with a greatly elevated risk of recurrent ischemic stroke. The current gold standard for OEF imaging is Oxygen-15 PET; which is less widely available and more expensive than MRI, and includes an ionizing radiation dose. We studied quantitative susceptibility mapping derived OEF maps and R2* mapping combined with an Acetazolamide challenge in a group of unilateral CVD patients, and found increased OEF and reduced cerebrovascular reactivity in the disease-affected hemisphere using these methods. With further refinement, these techniques may provide a clinical alternative to 15O-PET for OEF imaging.
Introduction
Elevated oxygen extraction fraction (OEF) in patients with internal carotid artery (ICA) occlusion (termed misery perfusion) is linked with a fivefold increase in the two-year rate of recurrent ischemic stroke1. While Oxygen-15 positron emission tomography (15O-PET) remains the gold standard for OEF imaging; quantitative susceptibility mapping (QSM) derived OEF in cerebrovascular disease (CVD) has been shown to correlate well with 15O-PET2,3. Cerebrovascular reactivity (CVR) measurements using an Acetazolamide (ACZ) challenge have also been shown to detect brain regions with compromised hemodynamics4. We aimed to evaluate relative OEF in unilateral CVD patients at baseline and after ACZ challenge using QSM OEF and R2* maps. We also assessed susceptibility changes on QSM maps in the middle cerebral artery (MCA) and straight sinus (SS) for comparison.Methods
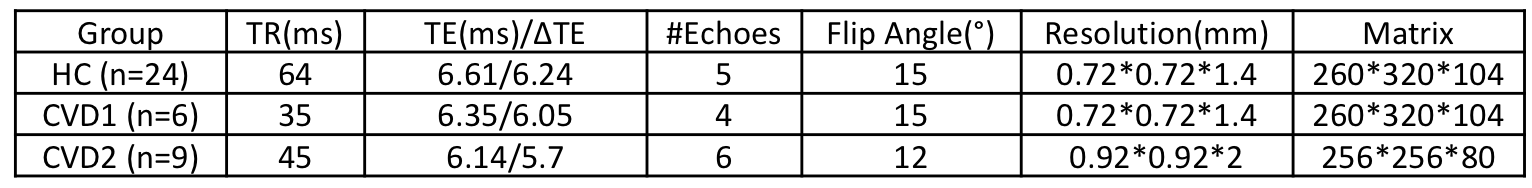
15 CVD patients (8 females, average age 56, range 34-79) with unilateral steno-occlusive disease of the ICA or MCA, and 24 healthy controls (HC) (17 females, average age 27, range 22-37) were studied. All data were acquired using a multi-echo GRE sequence at 3T, with patients scanned on a Trio Tim scanner, and HCs on a Prisma (Siemens, Erlangen, Germany). There were three sets of acquisition parameters, as the data were combined from different studies; these are shown in Table 1. The two CVD patient groups in Table 1 were combined for group level analysis.
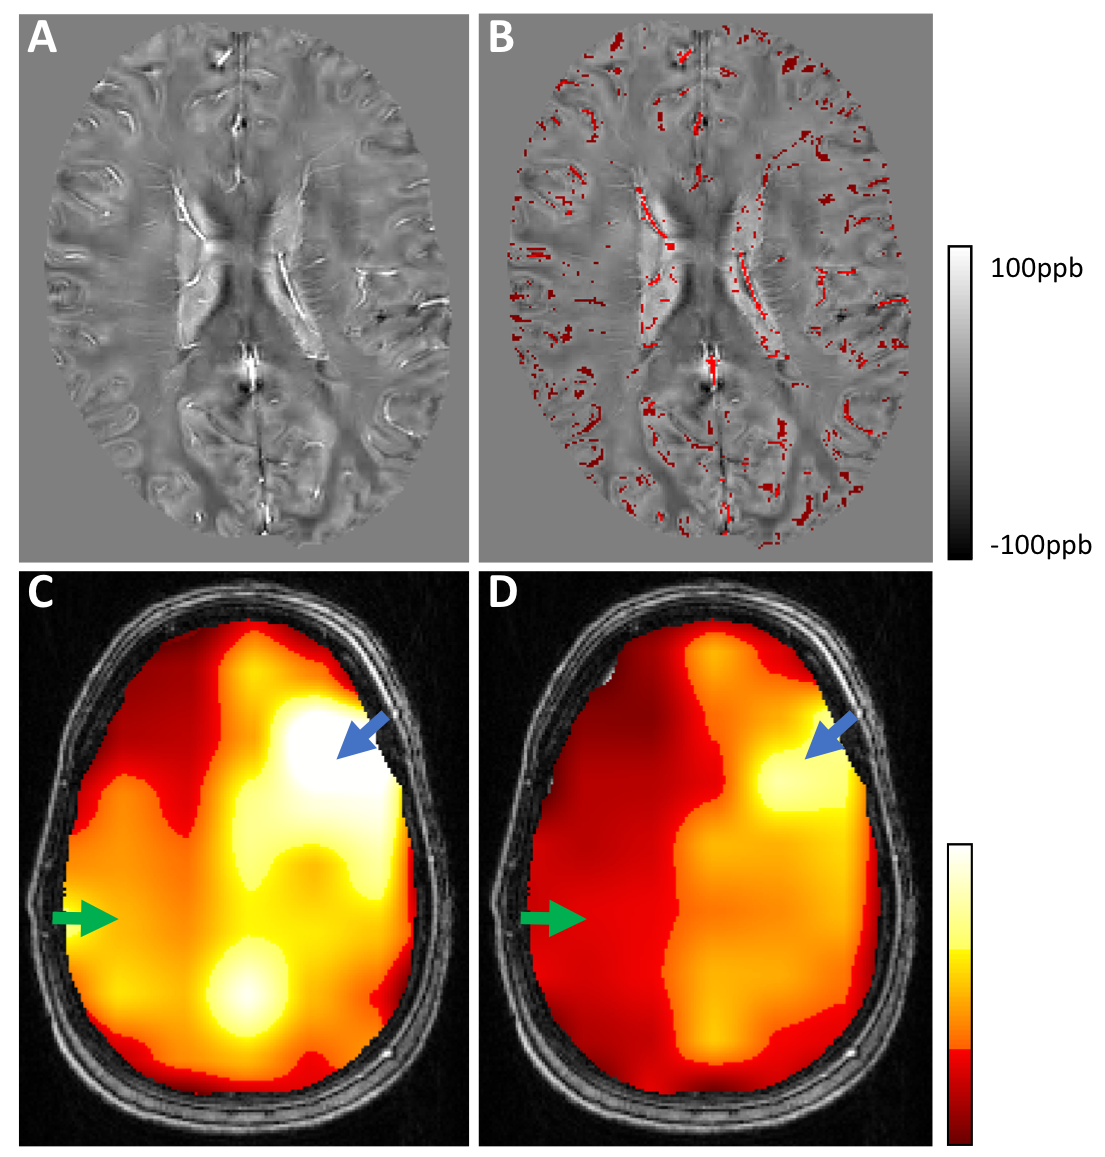
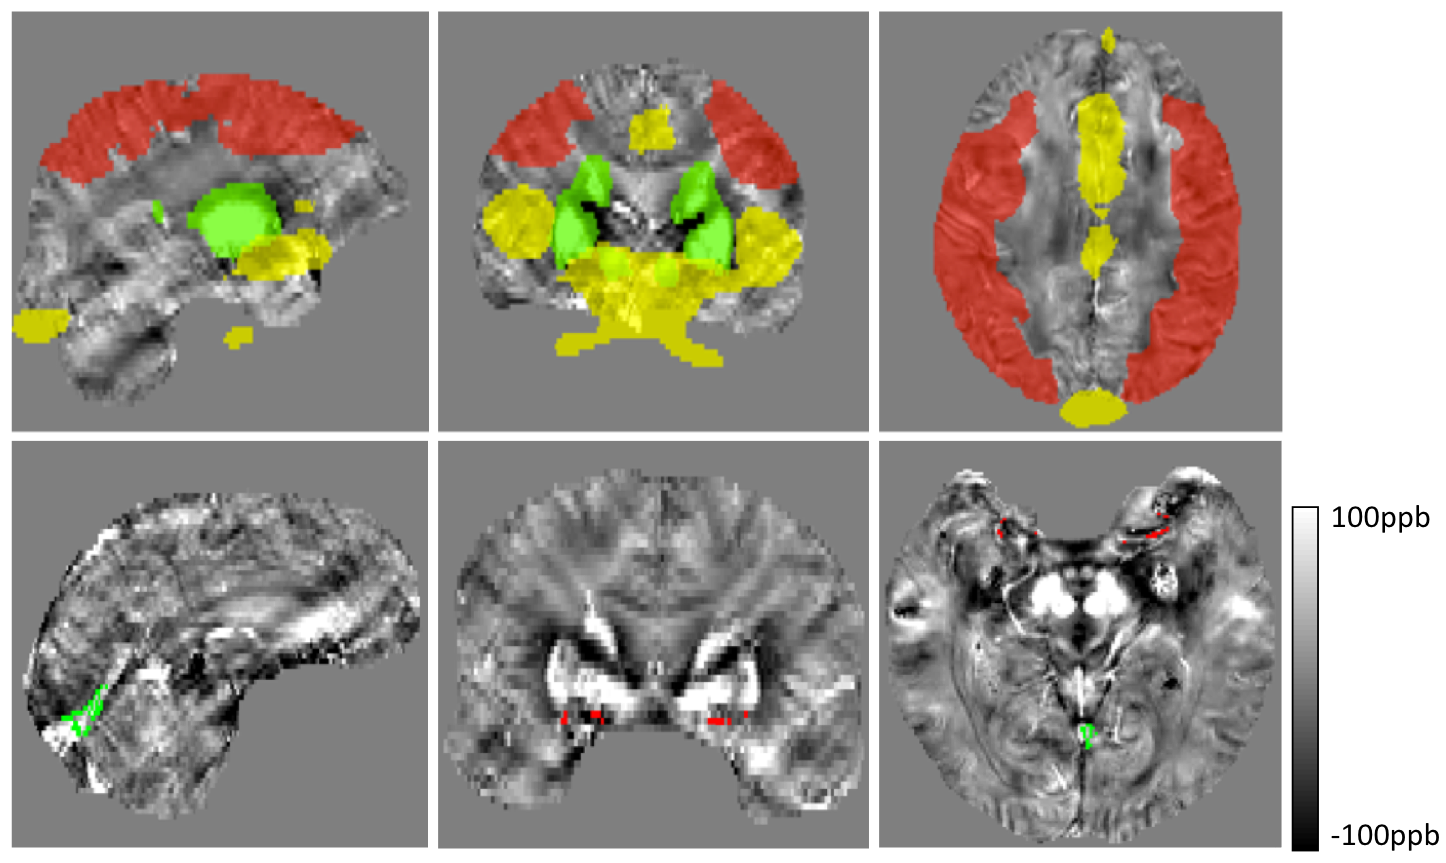
Patient images were acquired at baseline, and 16 minutes after intravenous administration of 1 gram ACZ. QSM reconstruction was completed using a previously described L1-norm optimization based method5. Voxelwise R2* maps were derived by fitting a single exponential decay to the multi-echo magnitude signal. Small veins were detected on QSM images by identifying voxels with susceptibility values greater than the mean plus 1.5 SD of a 16x16 voxel convolution kernel (Figure 1, part B); brain tissue was defined as susceptibility values less than the kernel mean minus 1 SD. Large veins and basal ganglia nuclei were masked out using templates (Figure 2 top row, yellow and green regions)6,7. Relative OEF was based on the susceptibility difference between venous blood and brain tissue as has been reported previously, and was calculated within non-overlapping ~2x2x2cm VOIs2,3. Average OEF and R2* values in the MCA territories (Figure 2 top row, red regions) were used to calculate intrasubject interhemispheric ratios. To determine large vessel susceptibility changes, the SS was identified from vein masked QSM images; and the MCA was masked by applying the convolution kernel method to the first echo magnitude image, which has high arterial blood signal intensity (Figure 2 bottom row).
Results
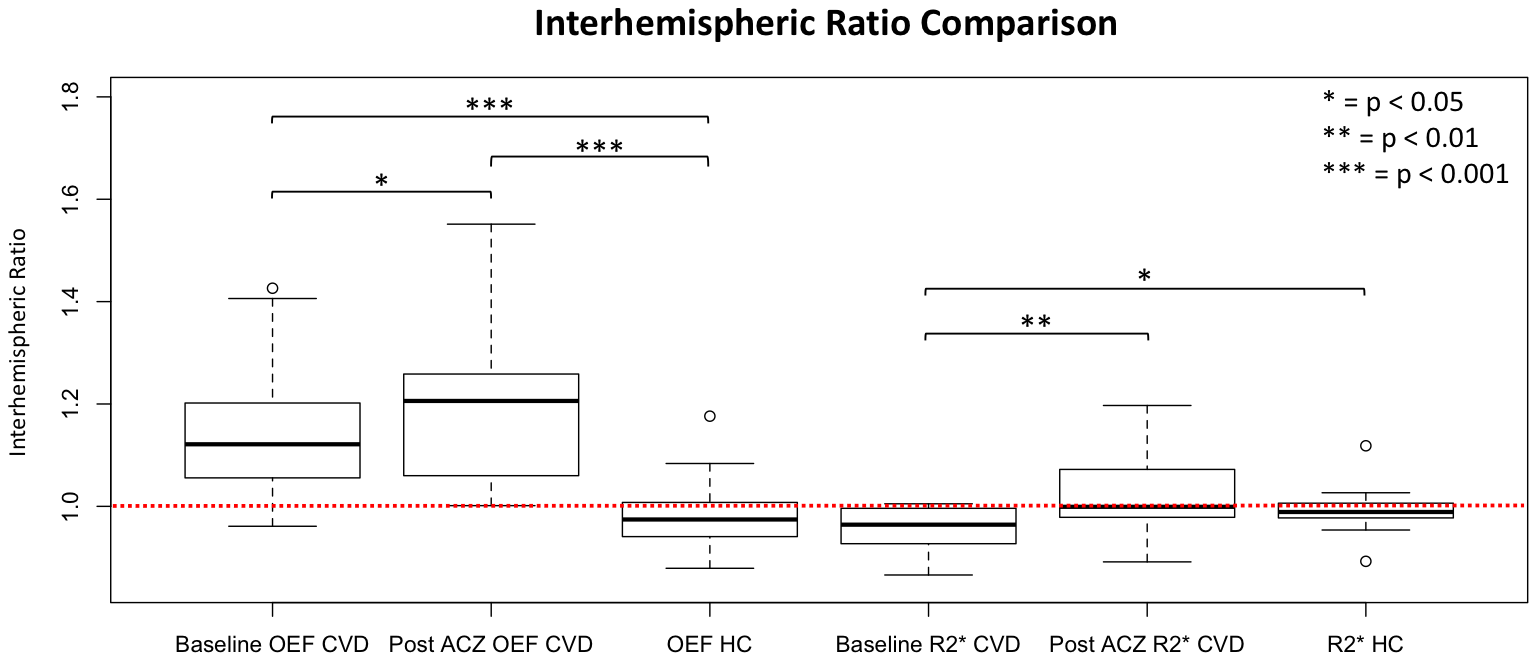
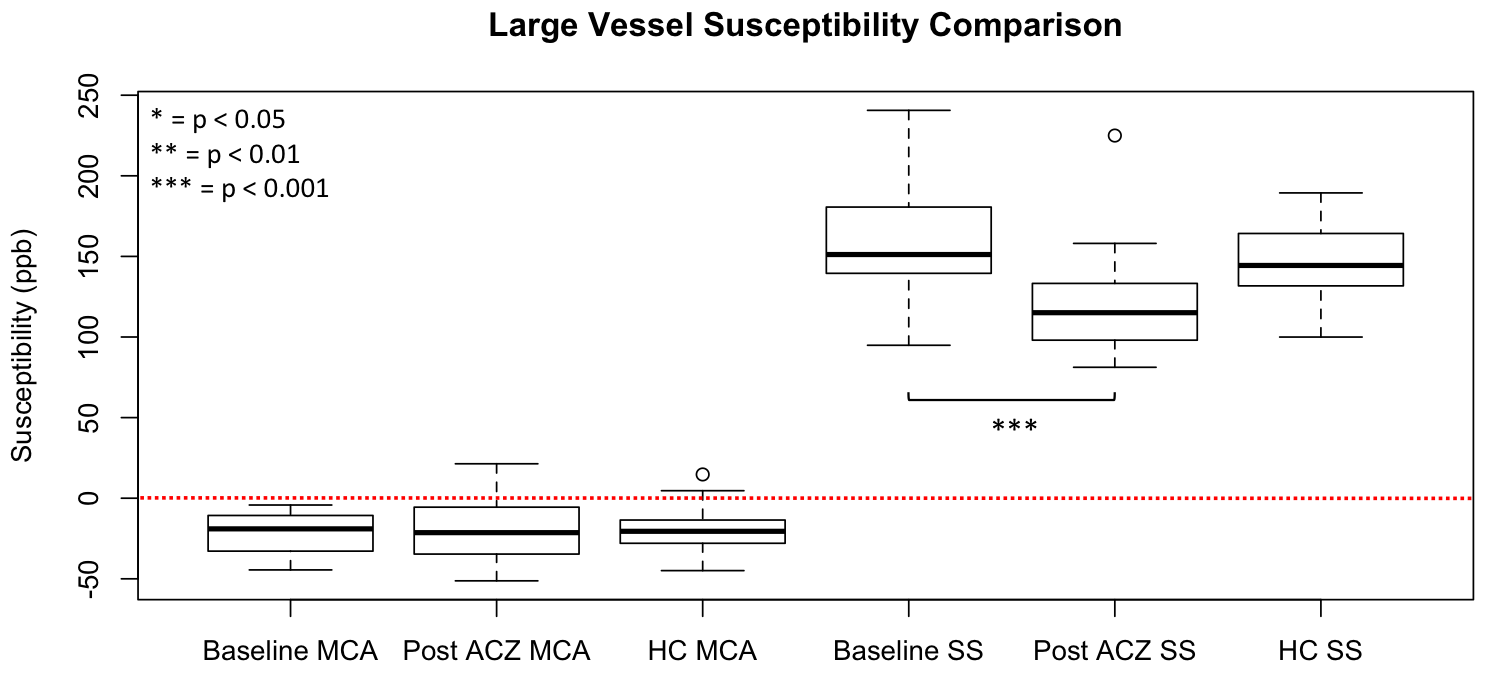
Figure 1 (parts C and D) shows the OEF map of a left ICA stenosis patient at baseline and post-ACZ. Average baseline left hemisphere OEF was higher than the right, this difference increased after ACZ administration. The CVD group interhemispheric OEF ratio was significantly greater than 1.0 at baseline and post ACZ after Bonferroni correction (p<0.001, one-sample t-test). Interhemispheric (diseased/healthy) OEF and R2* ratios increased from baseline to post-ACZ (p=0.019, 0.005 respectively, one-sided paired t-test) (Figure 3). SS susceptibility decreased significantly from baseline to post-ACZ in CVD patients (p=0.005, one-sided paired t-test), but MCA susceptibility did not (Figure 4). CVD group OEF ratios at baseline and post-ACZ were significantly different to the HC (left/right) ratios after Bonferroni correction (p = 0.0002 and 0.0001 respectively, unpaired t-test).Discussion & Conclusion
We evaluated QSM-based OEF and R2* measurements in CVD patients before and after an ACZ challenge. We showed that QSM-OEF and R2* maps are sensitive to compromised diseased hemisphere hemodynamics. OEF map interhemispheric ratios in CVD patients were significantly greater than 1.0, and greater than that of HC subjects. While decreased SS blood susceptibility was detected, no difference was found for MCA blood susceptibility, as expected. These findings suggest that QSM is sensitive to blood oxygenation. Furthermore, the ACZ challenge may improve OEF-QSM map sensitivity by indirectly utilizing depleted CVR in ischemic tissue to boost venous blood susceptibility differences between healthy and diseased brain regions. Previous studies using 15O-PET established a link between increased OEF and higher risk of recurrent stroke in CVD patients 1. Further development of this MR-based technique could provide a method that is more cost-effective and widely available for stroke risk stratification in this patient group.Acknowledgements
No acknowledgement found.References
1. Grubb RL, Jr., Powers WJ, Derdeyn CP, et al. The carotid occlusion surgery study. Neurosurg Focus. 2003;14:e9
2. Kudo K, Liu T, Murakami T, et al. Oxygen extraction fraction measurement using quantitative susceptibility mapping: Comparison with positron emission tomography. J Cereb Blood Flow Metab. 2016;36:1424-1433
3. Uwano I, Kudo K, Sato R, et al. Noninvasive assessment of oxygen extraction fraction in chronic ischemia using quantitative susceptibility mapping at 7 tesla. Stroke. 2017;48:2136-2141
4. Knop J, Thie A, Fuchs C, et al. 99mtc-hmpao-spect with acetazolamide challenge to detect hemodynamic compromise in occlusive cerebrovascular disease. Stroke. 1992;23:1733-1742
5. Qiu D, Chan GC, Chu J, et al. Mr quantitative susceptibility imaging for the evaluation of iron loading in the brains of patients with beta-thalassemia major. AJNR Am J Neuroradiol. 2014;35:1085-1090
6. Keuken MC, Bazin PL, Crown L, et al. Quantifying inter-individual anatomical variability in the subcortex using 7 t structural mri. Neuroimage. 2014;94:40-46
7. Viviani R. A digital atlas of middle to large brain vessels and their relation to cortical and subcortical structures. Front Neuroanat. 2016;10:12
Figures