4811
Hypertension induces changes in brain network organization1Department of Computer Science, University of Illinois at Chicago, Chicago, IL, United States, 2Shanghai Institute for Advanced Communication and Data Science, Fudan University, Shanghai, China, 3Department of Radiology, Northwestern University, Chicago, IL, United States
Synopsis
Hypertension is a risk factor for dementia and age-related neurological disorders. Analysis of resting state fMRI for brain network organization may capture early changes induced by hypertension. This investigation examined characteristic network metrics in young, otherwise asymptomatic adults (n=27; mean age 34) classified for hypertension. Path length was the most discriminating global metric. Differences in node clustering were identified using machine learning, including for subcortical regions that have been identified as brain network hubs (thalamus, hippocampus and putamen). These are critical structures for memory, supporting a potential role in cognitive deterioration and dementia and the premise of hub vulnerability.
Introduction
Chronic elevation of blood pressure has injurious effects on the brain. Hypertension is a major risk factor for dementia and other age-related neurological disorders [1, 2]. Hypertension may be clinically asymptomatic for long periods. Cerebral autoregulation, collateralization and compensatory strategies may mask ongoing brain injury, complicating efforts to clarify underlying pathophysiologic mechanisms. Graph theoretic approaches provide expansive new capabilities for analysis of brain network organization. Various global and node (i.e. region) specific metrics can be quantified [3]. These metrics may capture early changes in brain network organization induced by hypertension. This investigation analyzed resting state fMRI (rsfMRI) for network organization in young adults classified for hypertension [4-7]. Machine learning was used to investigate how node clustering differs in hypertensive participants.Methods
The study included 27 participants (mean age: 33.37±9.2; 18 males, 9 females) classified for hypertension at scan based on AHA criteria, with 21 normo- or prehypertensive (age: 34.19±8.7; 13 males, 8 females) and 6 hypertensive (age: 30.50±11.2; 5 males, 1 female). rsfMRI (gradient echo EPI (TR 2500 ms, TE 20 ms, fov 220 mm, 1.72 x 1.72mm, 128 x 128, 3mm, 40 slices, GRAPPA, PAT:2, reference line = 24, phase partial Fourier = 6/8). DPARSF toolbox [8] was used for rsfMRI post-processing using standard procedures, as detailed in [9,10] to extract time series from 116 anatomical volumes, determine correlations, excluding 26 cerebellar regions, each brain was represented as a graph with 90 nodes.Results
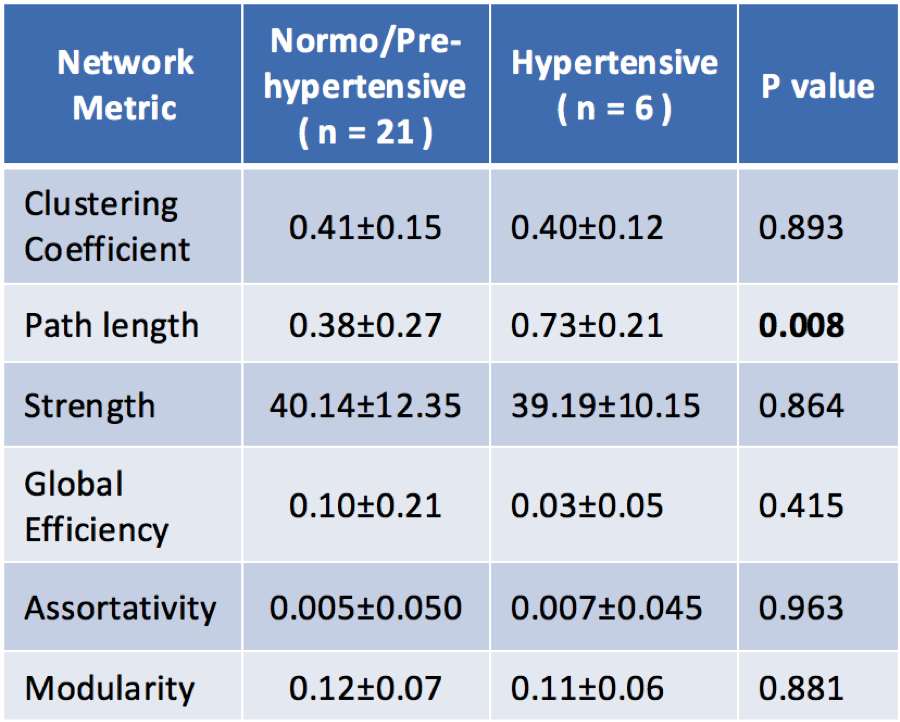
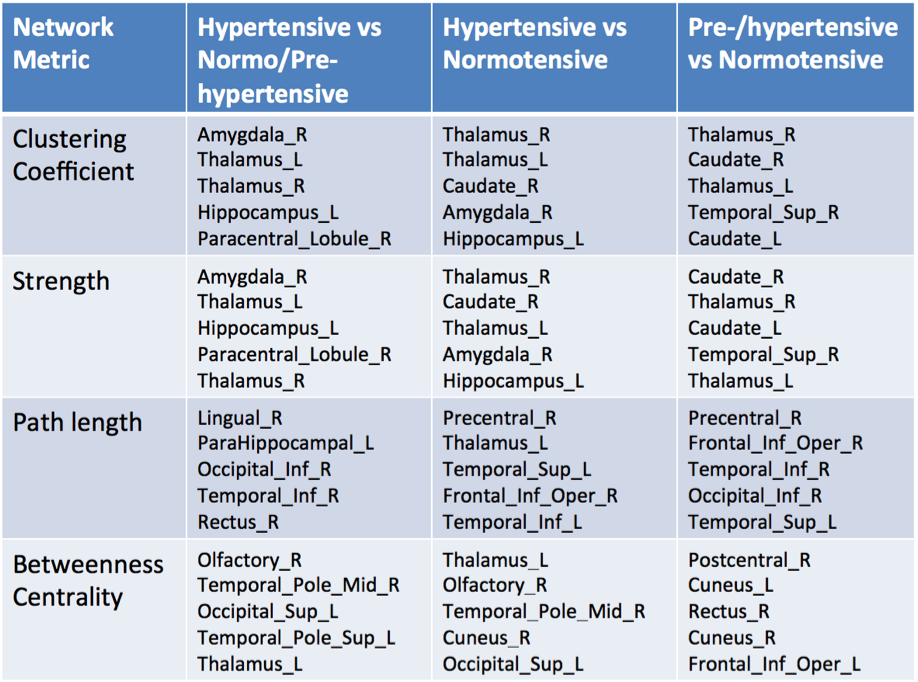
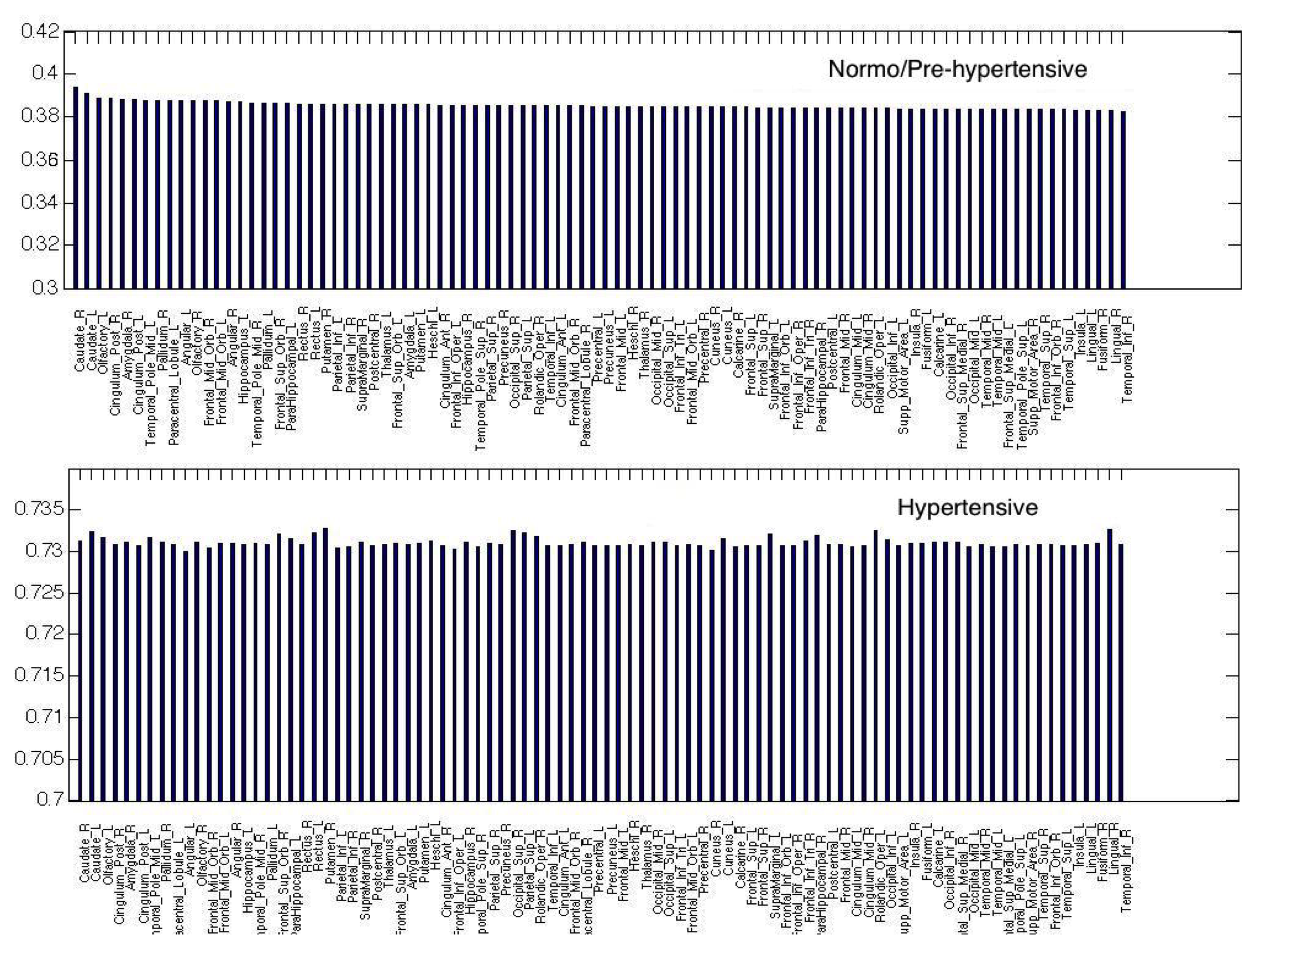
Global metrics (clustering coefficient, path length, strength, global efficiency, assortativity, modularity) were compared in normo/pre- and hypertensive using t-tests (Table 1). Significant differences were indicated for path length. Clustering coefficient, strength, path length and betweenness centrality for all 90 regions were examined to determine the most discriminating in hypertensives (Table 2). Path length measures for all hub regions [7] were significantly correlated with clinical HTN measures (N=27), including Body Mass Index (Superior Frontal; p=0.01, Superior Parietal; p<0.01, Hippocampus; p=0.01; Thalamus; p<0.01; Putamen; p=0.01 and Precuneus (p<0.01) and diastolic pressure (all, p<0.05). Machine learning was used to compare node clustering patterns [9, 11] using the Unified Cut algorithm [11] to obtain a single unified clustering result for each group. Based on Spectral Clustering algorithm [12], the Unified Cut algorithm finds a single unified cut for a collection of weighted graphs with the same node set, solving the optimization problem:
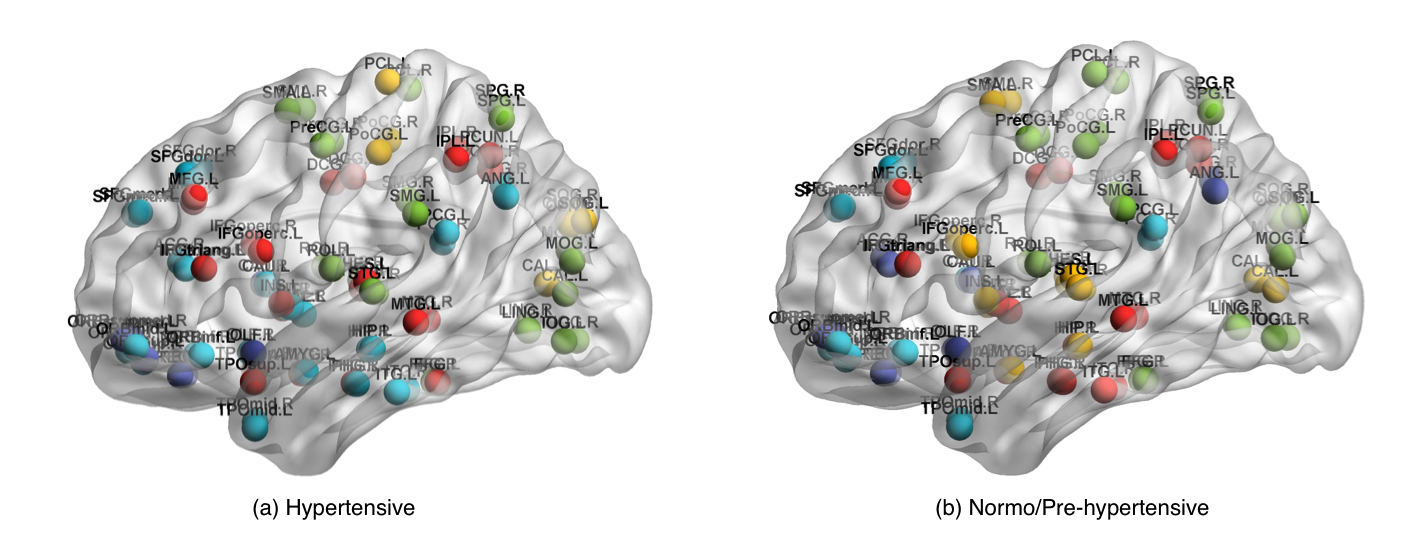
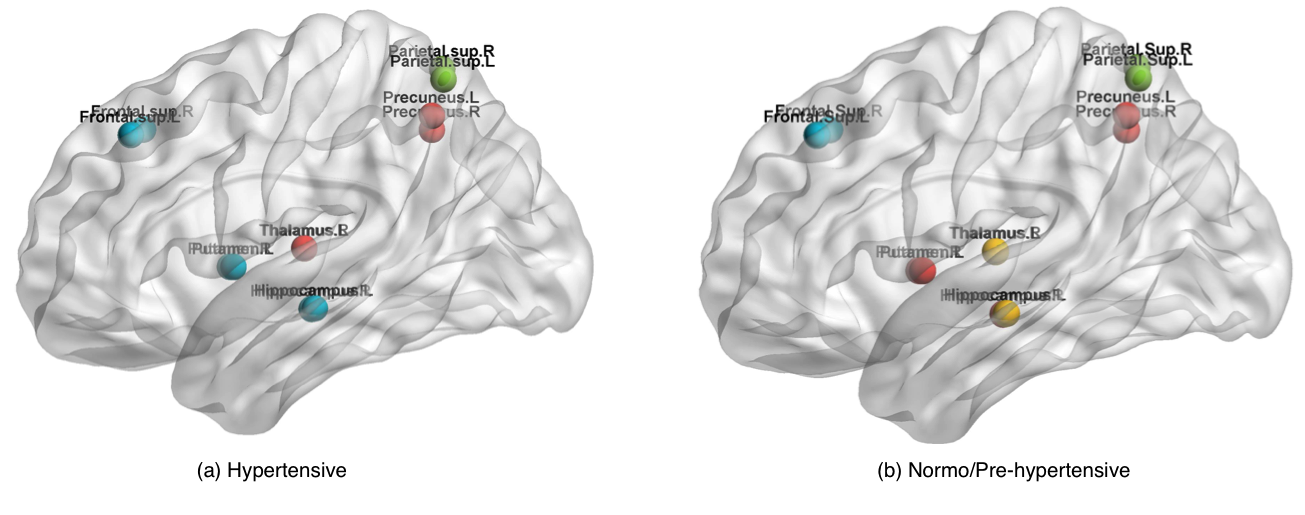
$$\scriptsize \min_{u,u^Tu=1}\frac{1}{k}\sum_{i=1}^{k}u^TL_iu - \alpha(\sum_{i=1}^{k}(u^Tv_i)^2)$$ where $$$u$$$ is unified cut, and $$$v_i$$$ is individual min-cut of graph $$$i$$$, computed as eigenvector of the Laplacian $$$L_i$$$ corresponding to second smallest eigenvalue, and $$$k$$$ is the number of node clusters. K-means [13] clustering was applied on $$$u$$$ to obtain single unified node clustering results, setting 6 node clusters (i.e., $$$k = 6$$$), as suggested in [9]. Figure 2 shows the visualized brain networks with clusters indicated by different colors (Brain Net Viewer toolbox [14]). Each node represents a brain region and nodes that were clustered together were marked with the same color. Node clustering patterns differed in hypertensives (Figure 2), particularly for subcortical hub regions, including thalamus, hippocampus and putamen (Figure 3).
Discussion
These findings support brain network analysis for investigating early changes induced by hypertension. Path length was the most discriminating global metric in young (mean age 30), otherwise clinically asymptomatic hypertensive adults. While clinically silent, early alterations induced by hypertension may necessitate functional reorganization at the network level. Differences in node clustering were indicated for subcortical regions identified as network hubs, including thalamus, hippocampus and putamen [4-7]. This finding is consistent with results indicating longer path lengths in the hypertensives. These subcortical regions are critical structures for memory, supporting a role in cognitive deterioration and dementia. The findings also support the premise of hub vulnerability [4-7].Conclusion
Graph theoretic analysis of rsfMRI provides new strategies for capturing early subclinical changes in network organization induced by hypertension and for investigating underlying pathophysiologic mechanisms.Acknowledgements
No acknowledgement found.References
1. Chockalingam, A., Impact of World Hypertension Day. Can J Cardiol, 2007. 23(7): p. 517-9.
2. Iadecola, C., et al., Impact of Hypertension on Cognitive Function: A Scientific Statement From the American Heart Association. Hypertension, 2016. 68(6): p. e67-e94.
3. Rubinov, M. and O. Sporns, Complex network measures of brain connectivity: uses and interpretations. Neuroimage, 2010. 52(3): p. 1059-69.
4. Guimera, R. and L.A. Amaral, Cartography of complex networks: modules and universal roles. J Stat Mech, 2005. 2005(P02001): p. nihpa35573.
5. Guimera, R. and L.A. Nunes Amaral, Functional cartography of complex metabolic networks. Nature, 2005. 433(7028): p. 895-900.
6. Zamora-Lopez, G., C. Zhou, and J. Kurths, Cortical hubs form a module for multisensory integration on top of the hierarchy of cortical networks. Front Neuroinform, 2010. 4: p. 1.
7. van den Heuvel, M.P. and O. Sporns, Rich-club organization of the human connectome. J Neurosci, 2011. 31(44): p. 15775-86.
8. http: ://rfmri.org/DPARSF.
9. G. Ma, L. He, B. Cao, J. Zhang, P. Yu, and A. Ragin. Multi-graph clustering based on interior-node topology with applications to brain networks. In Joint European Conference on Machine Learning and Knowledge Discovery in Databases, Springer International Publishing, 2016. p. 476-492.
10. B. Cao, X. Kong, J. Zhang, P. Yu, A. Ragin. "Identifying HIV-induced subgraph patterns in brain networks with side information." Brain informatics 2.4 (2015): 211-223.
11. C. Kuo, X. Wang, P. Walker, O. Carmichael, J. Ye, and I. Davidson. "Unified and contrasting cuts in multiple graphs: Application to medical imaging segmentation." In Proceedings of the 21th ACM SIGKDD International Conference on Knowledge Discovery and Data Mining, pp. 617-626. ACM, 2015.
12. V. Luxburg, Ulrike. "A tutorial on spectral clustering." Statistics and computing 17.4 (2007): 395-416.
13. C. Deng. "Litekmeans: the fastest matlab implementation of kmeans." Software available at: http://www. zjucadcg. cn/dengcai/Data/Clustering. html (2011).
14. M. Xia, J. Wang, and Y. He. "BrainNet Viewer: a network visualization tool for human brain connectomics." PloS one 8.7 (2013): e68910.
Figures