4807
The relationship between advanced perfusion MRI and measurements of vessel size in human gliomas using image-guided stereotactic biopsies and quantitative immunohistochemistry1Brain Tumor Imaging Laboratory, UCLA, Los Angeles, CA, United States, 2Dept. of Radiological Sciences, UCLA, Los Angeles, CA, United States, 3Division of Neuropathology, Department of Pathology and Laboratory Medicine, UCLA, Los Angeles, CA, United States, 4Department of Neurology, UCLA, Los Angeles, CA, United States, 5Department of Neurosurgery, UCLA, Los Angeles, CA, United States, 6Neurology, UCLA, Los Angeles, CA, United States, 7Radiological Science, UCLA, Los Angeles, CA, United States
Synopsis
Following an accurate sampling of glioma tissues with 3D T1w-MRI coordinates, we quantified VSI from multi-echo spin-and-gradient echo DSC perfusion as well as from CD31 staining. Eleven patients were included in this retrospective study with in total 30 evaluated targets. We demonstrated the robustness of VSI quantification by MRI. These maps showed a high sensibility and specificity for tumor grading. Finally, in comparison with classical DSC approaches for rCBV estimations, the quantification of VSI could be automated in clinical settings and enhance our understanding of micro and macro-vessel evolution in glioma patients.
Objective: The creation of new blood vessels (angiogenesis) is critical for brain tumor development and malignant transformation, influencing both prognosis and response to therapy. Traditional MRI methods used to estimate tumor vascularity are based on single echo dynamic susceptibility contrast (DSC) MRI and relative measurements of blood volume (rCBV) and flow (rCBF).1 These measurements, however, are qualitative and are prone to a variety of technical issues that effect sensitivity, including vessel orientation, type of contrast agent, and specific MR acquisition strategies (e.g. gradient echo vs. spin echo; flip angle; TR; use of preload, etc.). The “vessel size index” (VSI) is a quantitative parameter that reflects the mean diameter of a distribution of vessels within an image voxel by using multi-echo DSC MRI information. While VSI has been investigated in animal models, no studies have examined the accuracy of VSI in human gliomas using stereotactic image-guided biopsies and quantitative immunohistochemistry. In the current study we compared standard rCBV estimates and VSI estimates obtained using the Kiselev method2 to histology-equivalent estimates of vessel diameter using stereotactic image-guided biopsies in human gliomas.
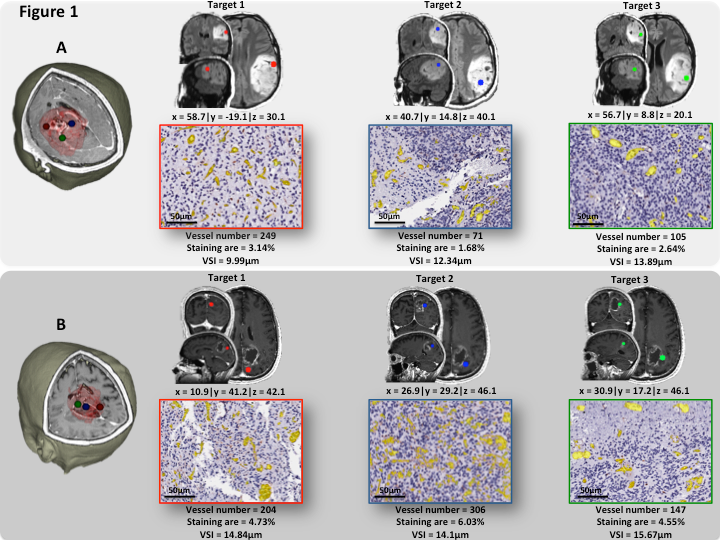
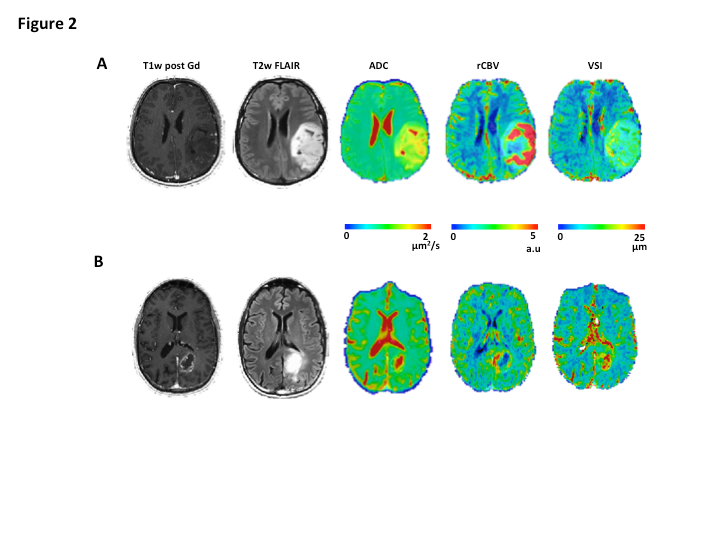
Methods: A total of 30 image-guided biopsies were obtained in 11 patients with histology confirmed glioma (5 low grade (LGG, WHO II) and 6 high grade gliomas (HGGs, WHO III-IV)) in this prospective study. MRI examinations were acquired prior to surgery on a 3T Siemens Prisma or Skyra, including standard anatomical (T1w and T2w-Flair), DWI, and multi-echo spin-and-gradient echo (SAGE) DSC perfusion. The SAGE-EPI readout consisted of two gradient echoes (TE1=14.0ms; TE2=34.1ms), an asymmetric spin echo (TE3 = 58.0ms) and finally a spin echo (TE4=92.4ms) train. The repetition time was 1500ms with a slice thickness of 5mm and spatial resolution set to 1.875x1.875mm. A pre-dose 0.025mmol/kg of Gd-DTPA was administrated to saturated leaky tumor tissue before starting the tracking of contrast agent bolus with a total dose of 0.075mmol/kg. 1-4 biopsy targets (5mm radius) were defined in regions of T2/FLAIR hyperintensity or contrast enhancement (Figure1A-B). Relative cerebral blood volume (rCBV) maps were calculated using dynamic DSC data from the 2nd gradient-echo (TE2=34.1ms) and an in-house leakage correction algorithm.3 Estimates of VSI were obtained by VSI_μm= 0.867(ADC.rCBV)^(1/2) ((ΔR2*)/ΔR2^(3/2) ), where ADC is the water diffusion coefficient (mm2/s), rCBV the relative cerebral blood volume, ΔR2* and ΔR2 are transverse relaxation rates. Histologically equivalent estimates of VSI were obtained by modeling vessels as randomly oriented cylinders with different radii:4 $$ where is the number of vessels with radius .
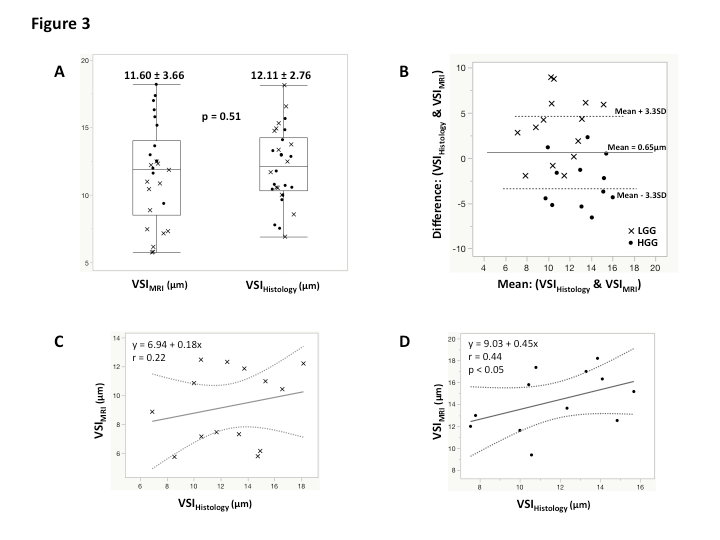
Results: The global immunohistochemical staining quantification displays a relatively low median vessel density in LGG (79mm-2) compared to HGG (86mm-2), with a median staining area of 1.41% and 1.88%, respectively. A median VSI of 12.91um (interquartile range: 10.4-15.0um) was quantified for LGG, while for HGG, the VSI was 11.28um (interquartile range: 10.1-13.7um). A comparison study of VSI quantified by MRI and histology (Figure 2A) demonstrates no significant difference between these two modalities (11.60±3.66um vs. 12.11±2.76um, p=0.51). Bland Altman plot (Figure 2B) confirmed that the VSI measurements were not significantly different between MR and histological measurements. The association between MR and histological measures of VSI were relatively poor in LGG patients thought to have relatively low levels of vascularity (Figure 2C), whereas we observed a strong correlation between MR and histological measures of VSI in HGG (r=0.44, p<0.05). We found an improvement of grade prediction with VSI quantified with the Kiselev model (AUC=0.91, Sens=0.75, Spec=0.75) compared to rCBV (AUC=0.89, Sens=0.83, Spec=0.69) and histologically quantified VSI (AUC=0.59, Sens=0.75, Spec=0.25). No relationships were observed between estimates of rCBV and histology.
Conclusion: MR measures of VSI exhibit a strong relationship to histological measures of vessel diameter, suggesting that VSI may be a more valuable and accurate method for assessing tumor vascularity in primary brain tumor patients at high magnetic field. A large-scale study is however warranted to better underlay vessel caliber properties.
Acknowledgements
No acknowledgement found.References
1. Digernes et al. A theoretical framework for determining cerebral vascular function and heterogeneity from dynamic susceptibility contrast MRI. JCBFM 2017
2. Kiselev et al. Vessel size imaging in humans. MRM 2005
3. Leu et al. Bidirectional contrast agent leakage correction of dynamic susceptibility contrast (DSC)-MRI improves cerebral blood volume estimation and survival prediction in recurrent glioblastoma treated with bevacizumab. JMRI 2016
4. Tropres et al. In vivo assessment of tumoral angiogenesis. MRI 2004
Figures