4806
Myelin imaging may reveal ischemic microstructural damage correlated with neurocognitive dysfunction in patients with moyamoya disease1Neurosurgery, Tokyo Medical and Dental University, Tokyo, Japan, 2Radiology, Juntendo University, Tokyo, Japan, 3Radiology, Kenshinkai Tokyo Medical Clinic, Tokyo, Japan
Synopsis
To investigate myelin structural damage caused by chronic ischemia, we applied myelin imaging using magnetization transfer saturation (MTsat) method to 15 patients with moyamoya disease (36.6±11.6-year-old) and 10 normal volunteers (28.4±5.2-year-old). Although many patients received bypass surgery in the past and currently had good hemodynamic status, we found myelin volume fraction (MVF) was significantly lower and g-ratio was significantly higher in the patient group compared to normal controls. Moreover, regional MVF values showed some correlation with neurocognitive tests. This finding suggests myelin damage occurs in moyamoya disease, is associated with neurocognitive dysfunction, and is perhaps irreversible.
INTRODUCTION
Moyamoya disease is a progressive cerebrovascular disease which causes neurocognitive dysfunction in relatively younger population1. Little is known how chronic ischemia affect myelin structure in patients with moyamoya disease, and its correlation with neurocognitive dysfunction. Therefore, we applied myelin imaging to these patients and investigated correlation with neurophysiological tests.METHODS
Participants
This prospective study was approved by ethical committee of local institutes with registration to the University Hospital Medical Information Network Clinical Trials Registry (UMIN-CTR ID: 000027949). From Jun to Oct 2017, 15 patients with moyamoya disease (36.6±11.6-year-old, 3 males; 11 postoperative; all asymptomatic except for one with recent transient ischemic attacks) and 10 normal volunteers (28.4±5.2-year-old, 6 males) were recruited to this study. All patients underwent a series of MRI scan and a neurocognitive test WAIS-III within an interval of 0-20 days (7 days on average).
MRI acquisition and postprocessing
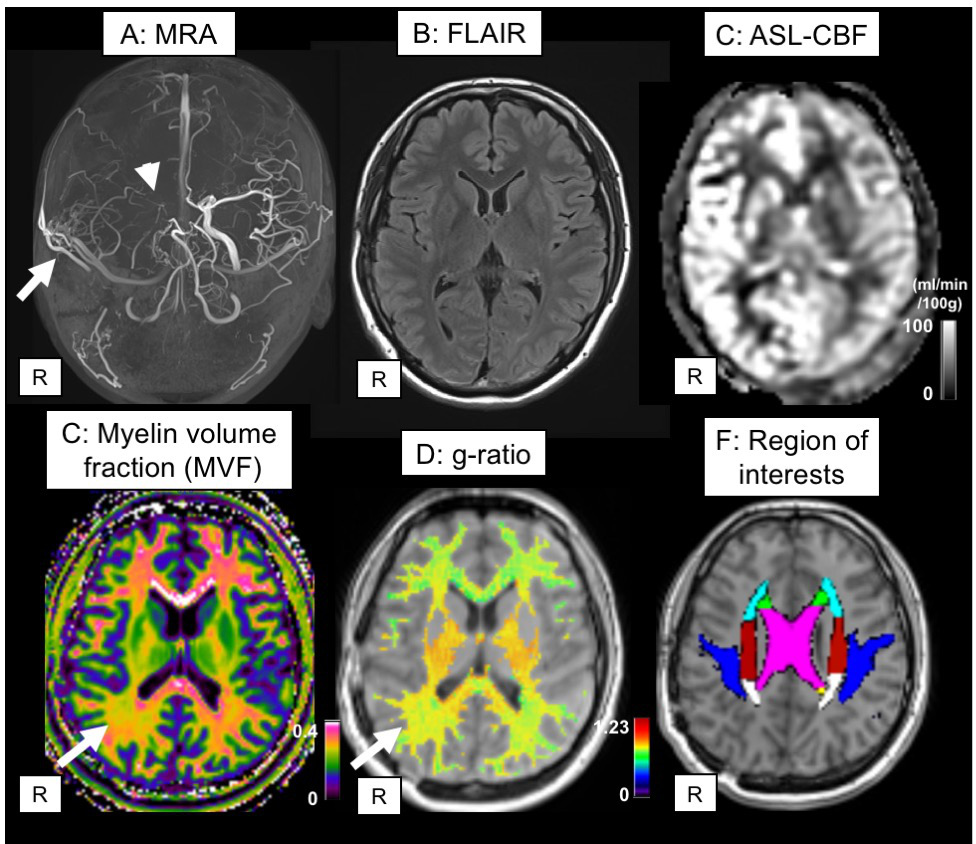
By using a 3.0-T MRI system (Magnetom Skyra; Siemens AG, Erlangen, Germany), three 3-dimensional multi-echo fast low-angle shot (FLASH) sequences were performed with predominant T1-, proton density (PD)-, and magnetization transfer (MT)-weighting. These images were converted to magnetization transfer saturation (MTsat2) index and was calibrated to have a mean value of 0.4 in the splenium of corpus callosum of normal volunteers. Diffusion MRI using multi-band Echo-Planner Imaging for Neurite Orientation Dispersion and Density Imaging (NODDI3: b=0,700: 30 axes,2850: 60 axes) and 3-dimensional T1-weighted imaging were acquired at the same time, and converted to intracellular volume fraction (Vic), isotropic volume fraction (Viso) maps and white matter segment. MR fiber g-ratio maps were created using MVF, Vic and Viso from the following equations4:
- Axon volume fraction (AVF)=(1-MVF)×(1-Viso)×Vic
- g-ratio= sqrt[1/(1+MVF/AVF)]}
Calculating regional values and correlation with neurocognition
White matter masks with a probability threshold of 0.9 were applied to MVF and g-ratio maps to minimize partial volume effect, and lesions visible on conventional MRI were manually deleted from each map. JHU DTI-based white-matter atlas5 available in FSL was converted to each subject’s space by linear and nonlinear image registration tool6. T test was used to compare regional values of moyamoya patients and normal subjects, and Pearson correlation coefficient was calculated among MVF, g-ratio and WAIS-III scores.
RESULTS
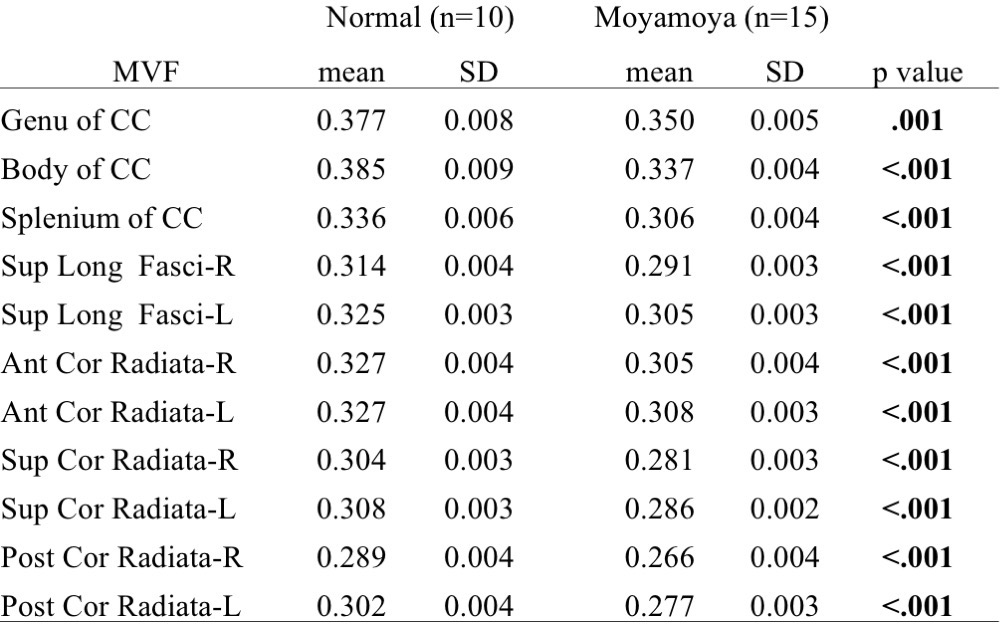
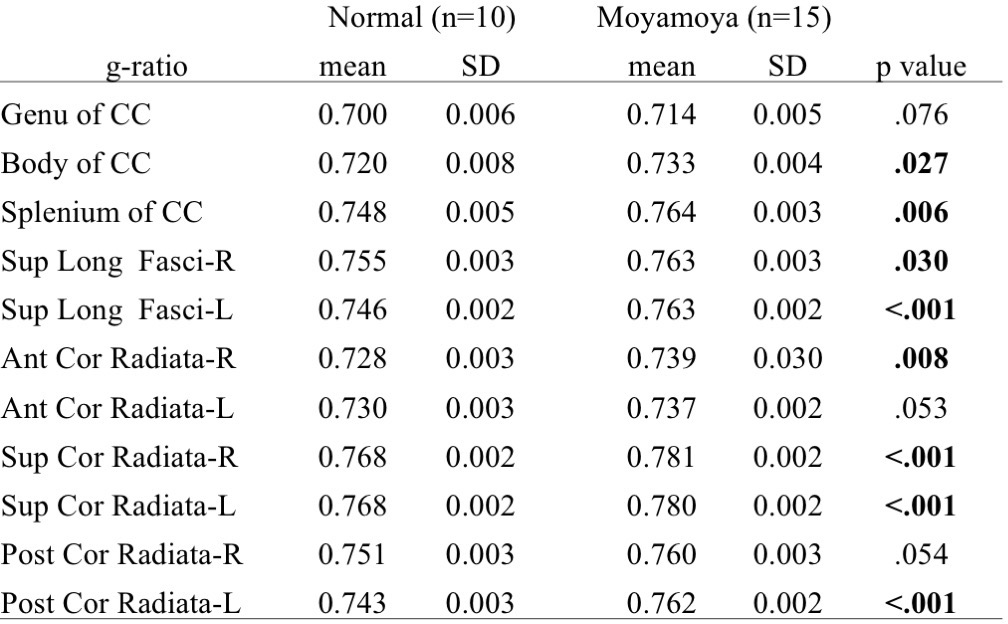
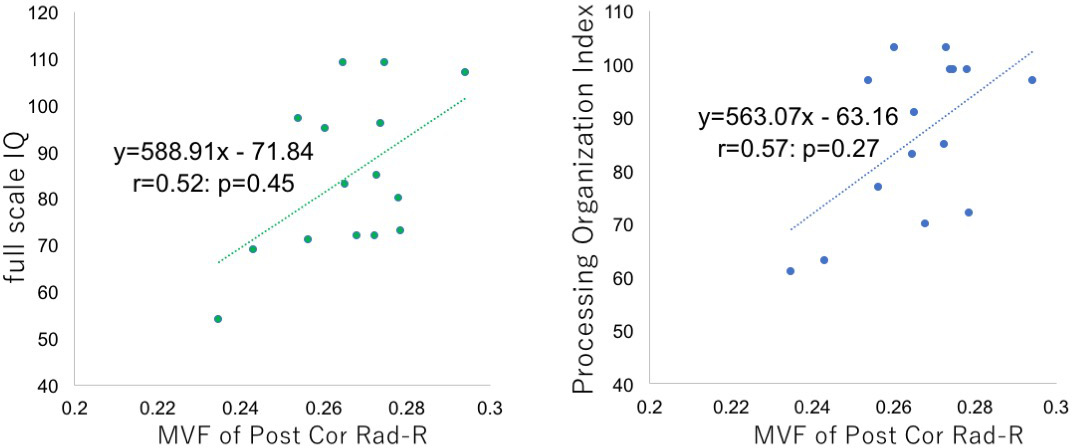
A representative case was shown in Figure 1. Compared to normal volunteers, moyamoya patients showed significantly lower MVF in all regions (Table 1). The increase of g-ratio was observed in most regions (Table 2), but not as clear as the decrease of MVF. There was also significant correlation among some WAIS-III scores and MVF of some region (Figure 2). No correlation was observed among any regional g-ratio values and WAIS-III scores.DISCUSSION
Numerous studies have shown myelin damage as well as neuronal damage in ischemic animal models7, 8 and human white matter lesions. However, myelin damage in the human normal appearing white matter related to chronic ischemia, as caused by moyamoya disease, was rarely investigated so far. We evaluated normal-appearing white matter of mostly asymptomatic moyamoya patients and observed significant decrease of MVF and increase of g-ratio. The results suggests myelin damage do occur in moyamoya disease. Moreover, we also found some correlation between regional MVF and WAIS-III scores, suggesting that MVF could be a biomarker of microstructural damage related to neurocognitive dysfunction. The absent correlation between g-ratio and WAIS-III scores maybe related to the axonal disruption concurrent with myelin damage, which lead to the decrease of fiber g-ratio.
It should be noted that although many participants of this study received bypass surgery in the past and have good hemodynamic condition at the timing of the study, myelin damage was still suggested by MVF and g-ratio images. If myelin damage caused by chronic ischemia is irreversible, we should consider to restore hemodynamic compromise of the moyamoya patients as soon as possible, to prevent microstructural damage leading to neurocognitive dysfunction.
CONCLUSION
Myelin imaging may be a potential biomarker of microstructural damage caused by chronic ischemia and neurocognitive dysfunction in patients with moyamoya disease.Acknowledgements
No acknowledgement found.References
1. Karzmark P, Zeifert PD, Bell-Stephens TE, et al. Neurocognitive impairment in adults with moyamoya disease without stroke. Neurosurgery 2012;70:634-638
2. Helms G, Dathe H, Kallenberg K, et al. High-resolution maps of magnetization transfer with inherent correction for RF inhomogeneity and T1 relaxation obtained from 3D FLASH MRI. Magnetic Resonance in Medicine 2008;60:1396-1407
3. Zhang H, Schneider T, Wheeler-Kingshott CA, et al. NODDI: practical in vivo neurite orientation dispersion and density imaging of the human brain. Neuroimage 2012;61:1000-1016
4. Stikov N, Campbell JS, Stroh T, et al. In vivo histology of the myelin g-ratio with magnetic resonance imaging. Neuroimage 2015;118:397-405
5. Mori S, Wakana S, Zijl PCMv, et al. MRI Atlas of Human White Matter. Elsevier Science; 2005 6. Jenkinson M, Beckmann CF, Behrens TE, et al. Fsl. Neuroimage 2012;62:782-790
7. Shibata M, Ohtani R, Ihara M, et al. White Matter Lesions and Glial Activation in a Novel Mouse Model of Chronic Cerebral Hypoperfusion. Stroke 2004;35:2598-2603
8. Farkas E, Luiten PG, Bari F. Permanent, bilateral common carotid artery occlusion in the rat: a model for chronic cerebral hypoperfusion-related neurodegenerative diseases. Brain Res Rev 2007;54:162-180
Figures