4804
Dynamic Susceptibility Contrast and Dynamic Contrast Enhanced Perfusion Performed in a Single Acquisition Using mDIXON Quant1Philips, Dallas, TX, United States, 2Philips Healthcare, Gainesville, FL, United States, 3Advanced Imaging Research Center, University of Texas Southwestern Medical Center, Dallas, TX, United States, 4Advanced Imaging Research Center, University of Texas Southwestern Medical Center, DALLAS, TX, United States
Synopsis
This work investigates the use of mDIXON Quant as a perfusion technique to acquire dynamic susceptibility contrast (DSC) and dynamic contrast enhanced (DCE) scans in a single acquisition. The use of multi-echo mDIXON Quant for assessment of perfusion can be used to eliminate the need for split dosing and allows for acquiring DCE and DSC in a single acquisition. Elimination of a split contrast dose will remove contamination from changes in T1, T2, and T2*. This technique can potentially simplify the workflow for the DCE- based perfusion MRI imaging and reduce overall scan time.
Introduction
Dynamic contrast-enhanced (DCE) and dynamic susceptibility contrast (DSC) magnetic resonance imaging (MRI) are the perfusion imaging techniques most frequently used to assess brain neoplasms and have become standard of care in the clinical setting1. Both techniques evaluate different tissue properties after administration of gadolinium based contrast agents. DCE characterizes T1 changes and looks at leakage/permeability of the tissue1. DSC measures changes in T2*/R2* properties and flow dynamics of the tissue1. The current clinical protocol is to use a split dose of gadolinium to acquire the DCE and DSC metrics in separate acquisitions in a single scan session. However, the administration of gadolinium based contrast agent leads to shortening of T1, T2, and T2* which compromises the diagnostic utility and accuracy of both tests2. In addition, split dosing leads to a smaller contrast bolus delivered for each dose and theaccuracy of the sequence acquired second will be confounded from the gadolinium already present from the initial dose. Therefore, acquiring both DCE and DSC in a single acquisition is advantageous to reduce contamination from using a split dose, eliminates the need for a follow up separate scan session for the patient, and allows for a larger bolus.Methods
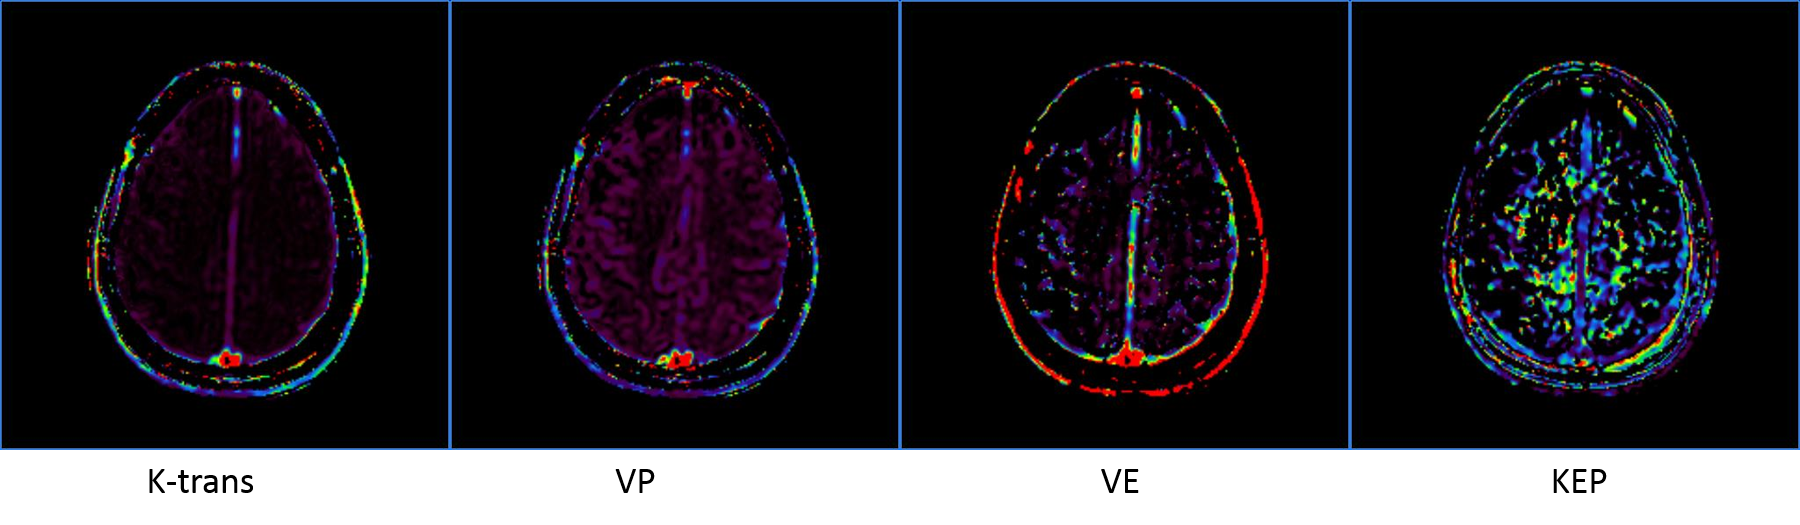
Imaging was performed on a 3T Ingenia Philips MRI scanner (Philips Healthcare, Best, The Netherlands) equipped with a multi-transmit body coil and 32 channel head receive coil. 3D T1 weighted mDIXON Quant images were acquired with 6 echoes (TE= 1.2, 2.0, 2.9, 3.7, 4.6, & 5.4ms, TR=7ms , resolution= 1.75x1.75x5.0mm, SENSE= 1, 8 slices, 80 dynamics). T2* maps were automatically calculated by the scanner console. Source images were separated and sorted by echo. The first echo was used for DCE analysis using IntelliSpace Portal to calculate permeability metrics: transfer constant (Ktrans), the rate constant or reflux rate (kep = Ktrans/ve), the EES fractional volume (ve), and fractional plasma volume (vp). The last echo and T2* maps were used to for DSC analysis using IntelliSpace Portal to calculate cerebral blood flow (CBF), cerebral blood volume (CBV), and mean transit time (MTT). The study adhered to the local Institutional Review Board guidelines.Results and Discussion
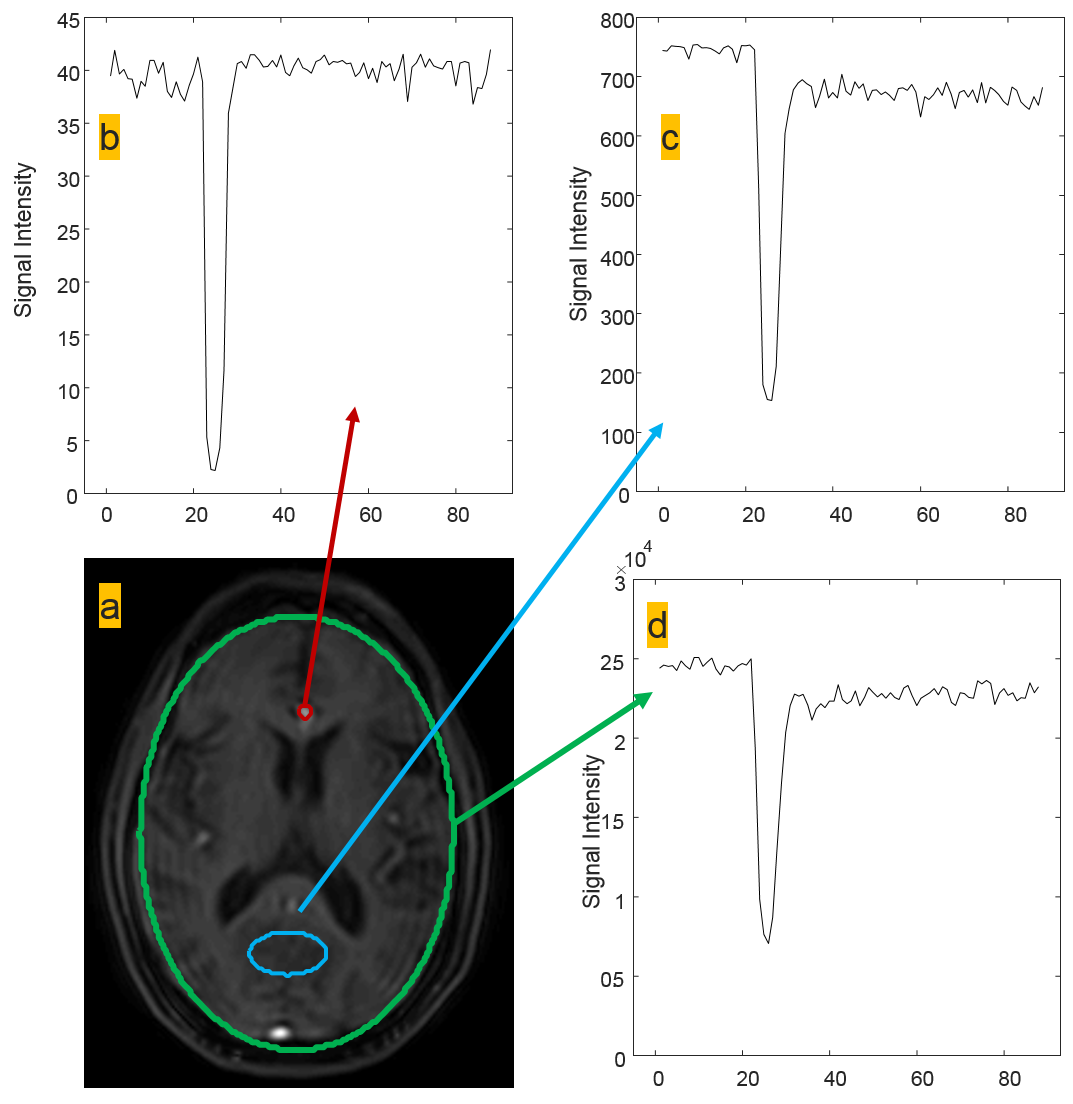
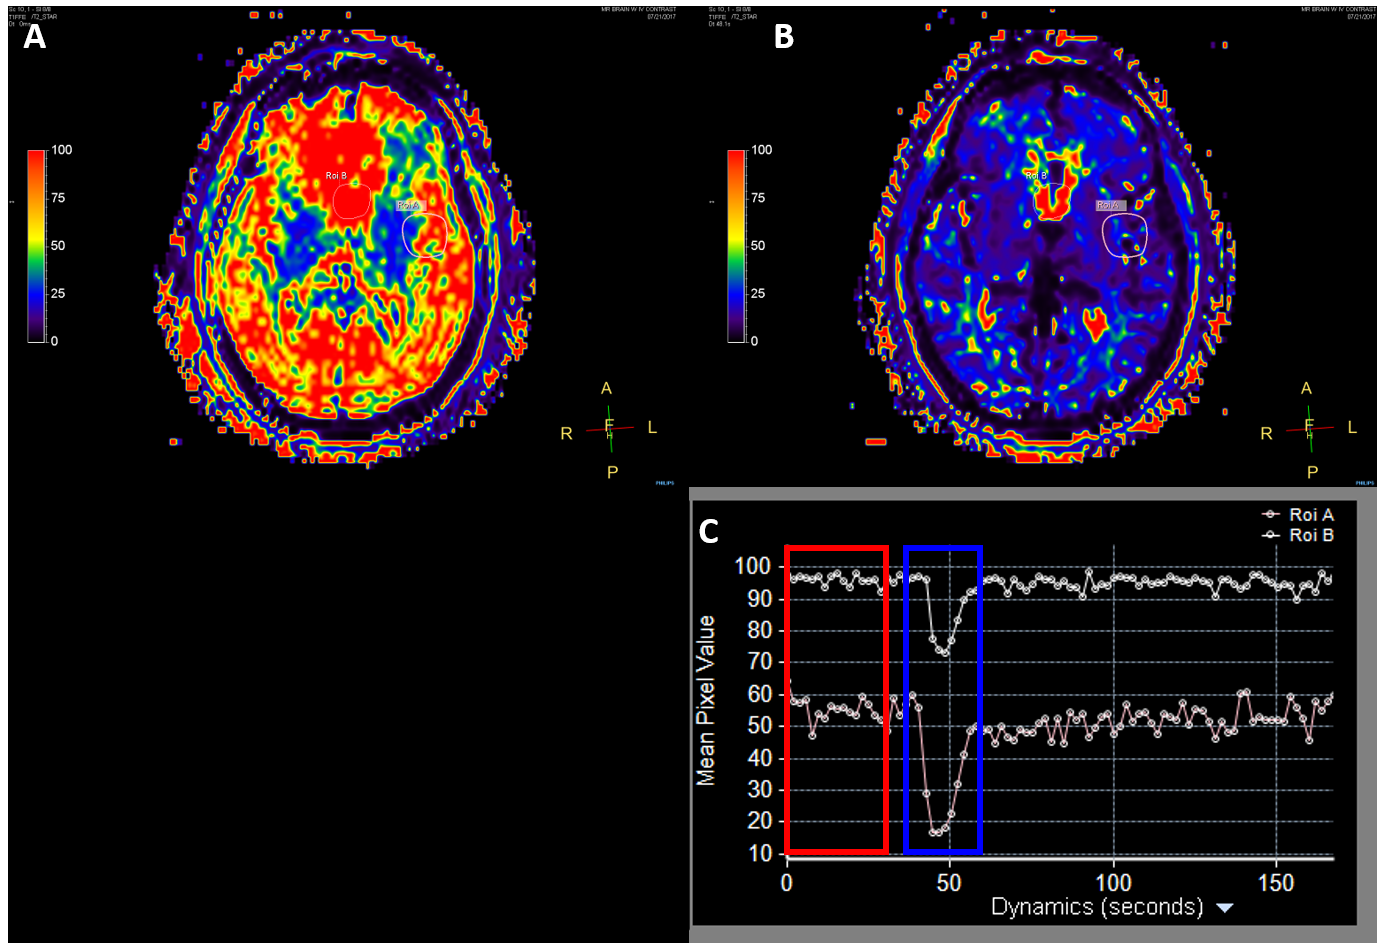
Figure one shows region of interest (ROI) analysis of several areas on the last acquired echo for DSC analysis. The time signal intensity curves show good arteria in put functions (AIF) typical of current T2* DSC approaches. Figure 2 shows permeability analysis of the first echo, with the resultant calculated maps appearing similar to current DCE techniques with no pathology present. Figure 3 shows the utility of using the T2* as another way to calculate DSC with the signal intensity curve mimicking the AIF seen in the last echo DSC analysis. As this was a proof of concept study, the final protocol needs to be optimized and meet current clinical guidelines. Following the American College of Radiology (ACR) guidelines3 and Quantitative Imaging Biomarkers Alliance (QIBA) recommendations for DSC and DCE perfusion should have an in-plane resolution between 1-2mm with a slice thickness of 5mm4. The temporal resolution should be 1.5s, ideally with whole brain coverage. Whole brain coverage that meets these guideline criteria can be achieved with the use of acceleration techniques (SENSE, compressed SENSE, Half-scan, etc.).Conclusion
The use of multi-echo mDIXON Quant for assessment of perfusion can eliminate the need for split dosing and allows for acquisition of DCE and DSC in a single acquisition. Elimination of a split contrast dose will remove contamination from changes in T1, T2, and T2* leading to a more accurate quantification with current perfusion models. Repeat visits and additional contrast doses will no longer needed with this new method. This technique can simplify the workflow for the contrast based MRI imaging and reduce overall scan time for the patient.Acknowledgements
No acknowledgement found.References
1. Jahng G-H, Li K-L, Ostergaard L, Calamante F. Perfusion Magnetic Resonance Imaging: A Comprehensive Update on Principles and Techniques. Korean Journal of Radiology. 2014;15(5):554-577. doi:10.3348/kjr.2014.15.5.554.
2. Paulson ES, Prah DE, Schmainda KM. Spiral Perfusion Imaging With Consecutive Echoes (SPICETM) for the Simultaneous Mapping of DSC- and DCE-MRI Parameters in Brain Tumor Patients: Theory and Initial Feasibility. Tomography : a journal for imaging research. 2016;2(4):295-307. doi:10.18383/j.tom.2016.00217. 3. ACR–ASNR–SPR PRACTICE PARAMETER FOR THE PERFORMANCE OF INTRACRANIAL MAGNETIC RESONANCE PERFUSION IMAGING. https://www.acr.org/~/media/949FBB83FEDB4DB18B7D8853249556F1.pdf
Figures